
- Buying pressure on Bitcoin increased in the last week.
- Technical indicators hinted at a trend reversal soon.
Bitcoin [BTC] has been underperforming for the last seven days as its price dropped near $55k. However, the last 24 hours were in investors’ favor.
Does this pose an opportunity for investors to buy the dip? Let’s find out what is going on.
Bitcoin is in a dilemma
CoinMarketCap’s data revealed that in the past seven days, the king of crypto’s price dropped by more than 17%. At the time of writing, BTC was trading at $55,128.85 with a market capitalization of more than $1 trillion.
Since BTC is trading under $56k, this might be the right opportunity to buy BTC. Therefore, AMBCrypto planned to take a look at metrics to find out whether buying pressure on BTC was high.
As per our analysis of Santiment’s data, Bitcoin’s supply on exchanges dropped sharply last week. This meant that investors were buying BTC at press time.
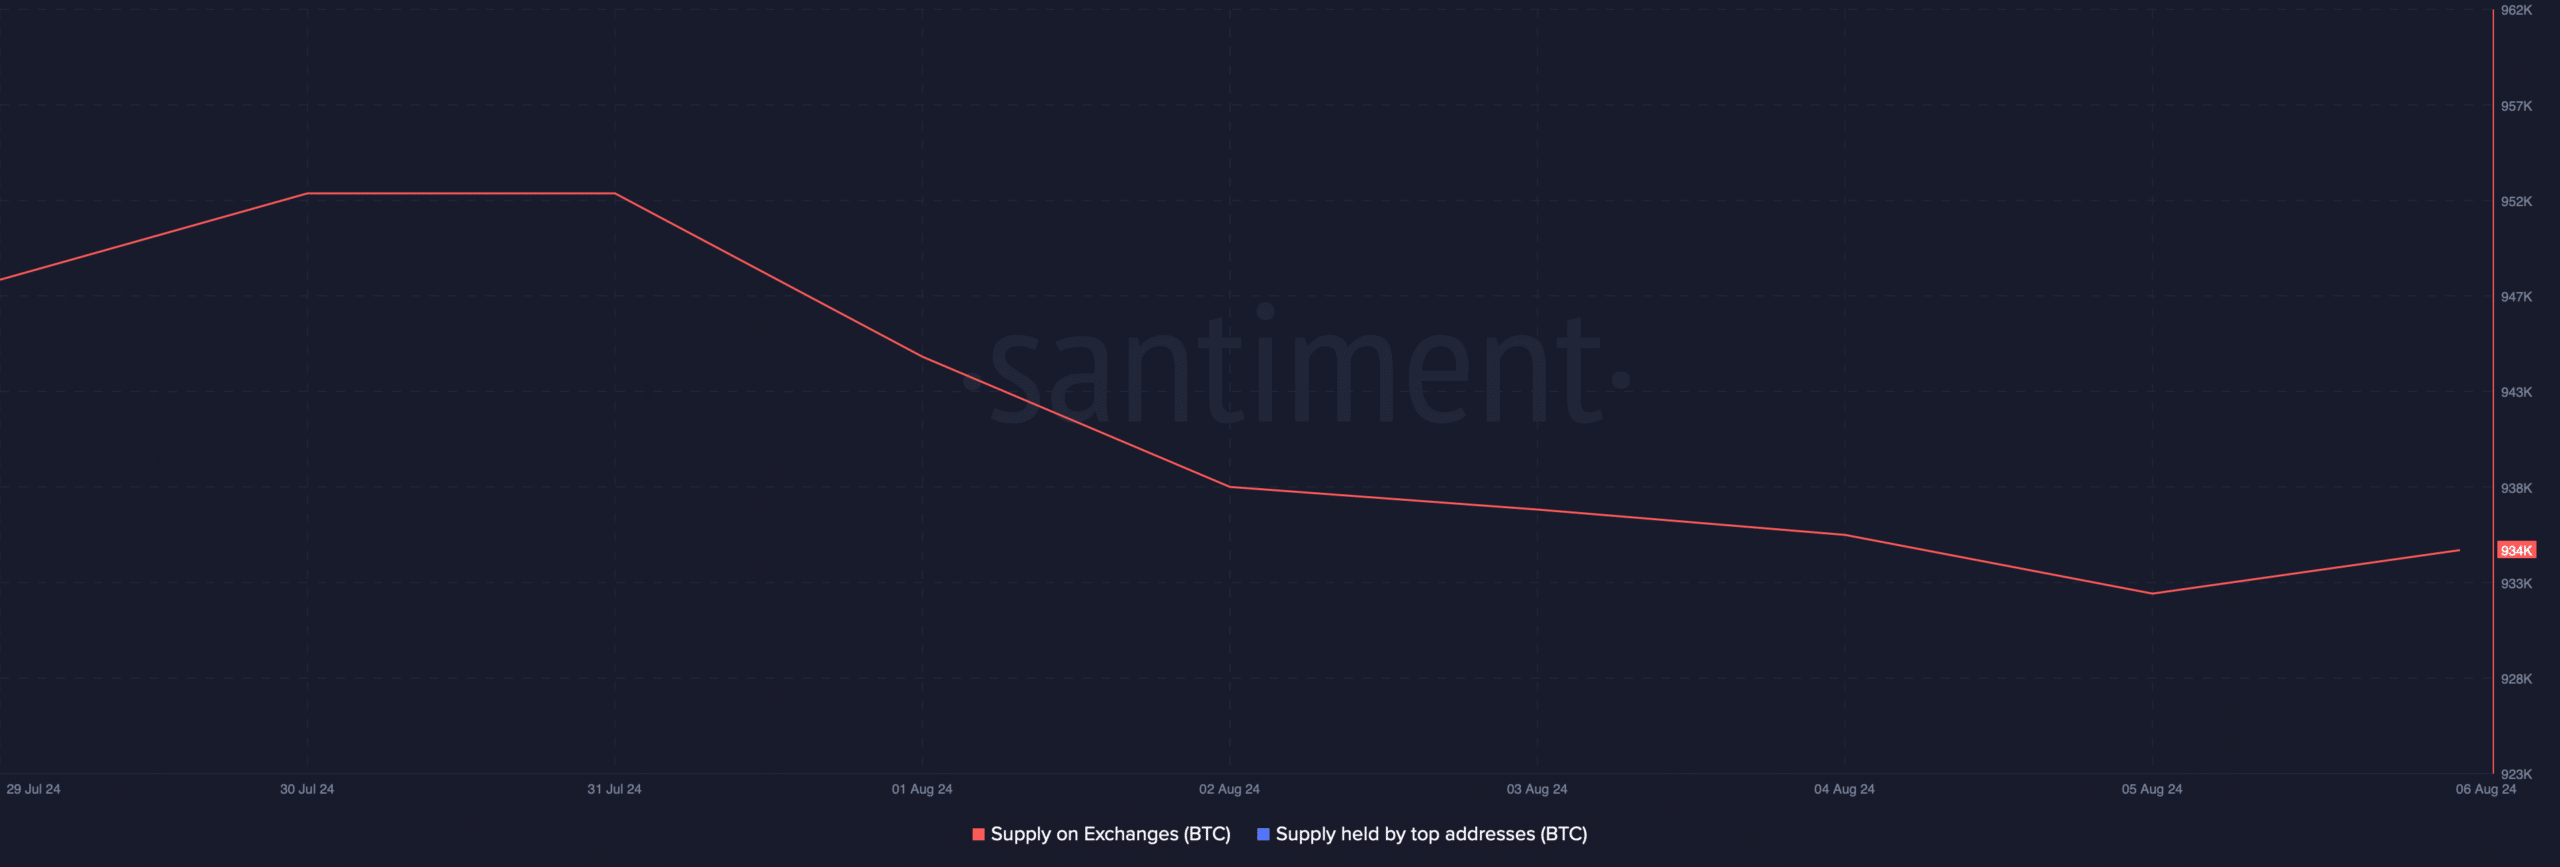
Source: Santiment
Similarly, CryptoQuant’s data suggested BTC’s exchange reserves were dropping. This further proves the point that investors were buying BTC.
Apart from that, BTC’s transfer volume and active addresses also increased, which can be inferred as a bullish signal.

Source: CryptoQuant
BTC’s upcoming days
AMBCrypto then checked other datasets to find out what to expect from the king of cryptos. As per our analysis of Glassnode’s data, BTC was resting well below its market bottom.
The Pi cycle top indicator revealed that BTC’s market bottom was at $64k. At press time, BTC was resting under that level. Additionally, if the metric is to be believed, then BTC’s market top would be above $99k.
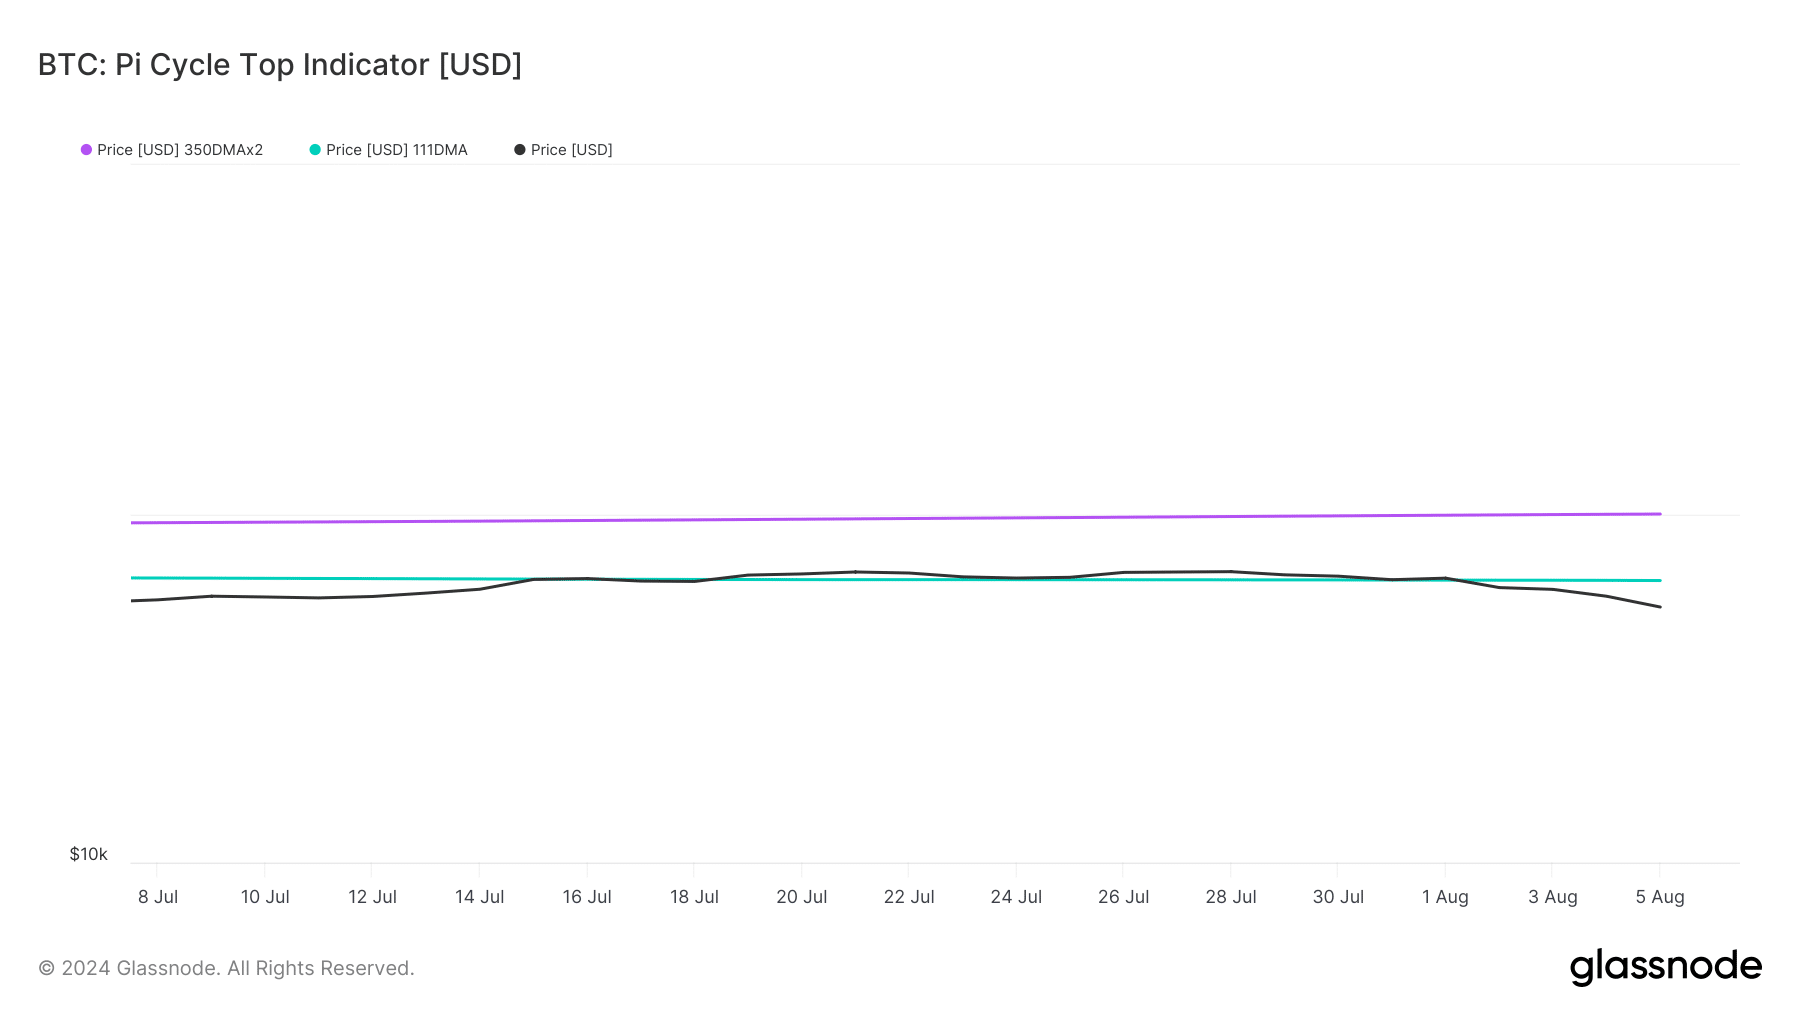
Source: Glassnode
AMBCrypto’s look at Bitcoin’s Rainbow Chart revealed that the coin was in an accumulation phase. Whenever the indicator hits this level, it suggests that there is still a chance for investors to buy the BTC at a lower price.
AMBCrypto then checked BTC’s daily chart to better understand what to expect from the coin in the coming days. According to our analysis, the Relative Strength Index (RSI) registered an uptick.
The Money Flow Index (MFI) also followed a similar trend.
Is your portfolio green? Check out the BTC Profit Calculator
These market indicators suggested that the chances of BTC gaining upward momentum were high.
However, the technical indicator MACD displayed a bearish advantage in the market, which could restrict BTC from moving up in the flooring days.
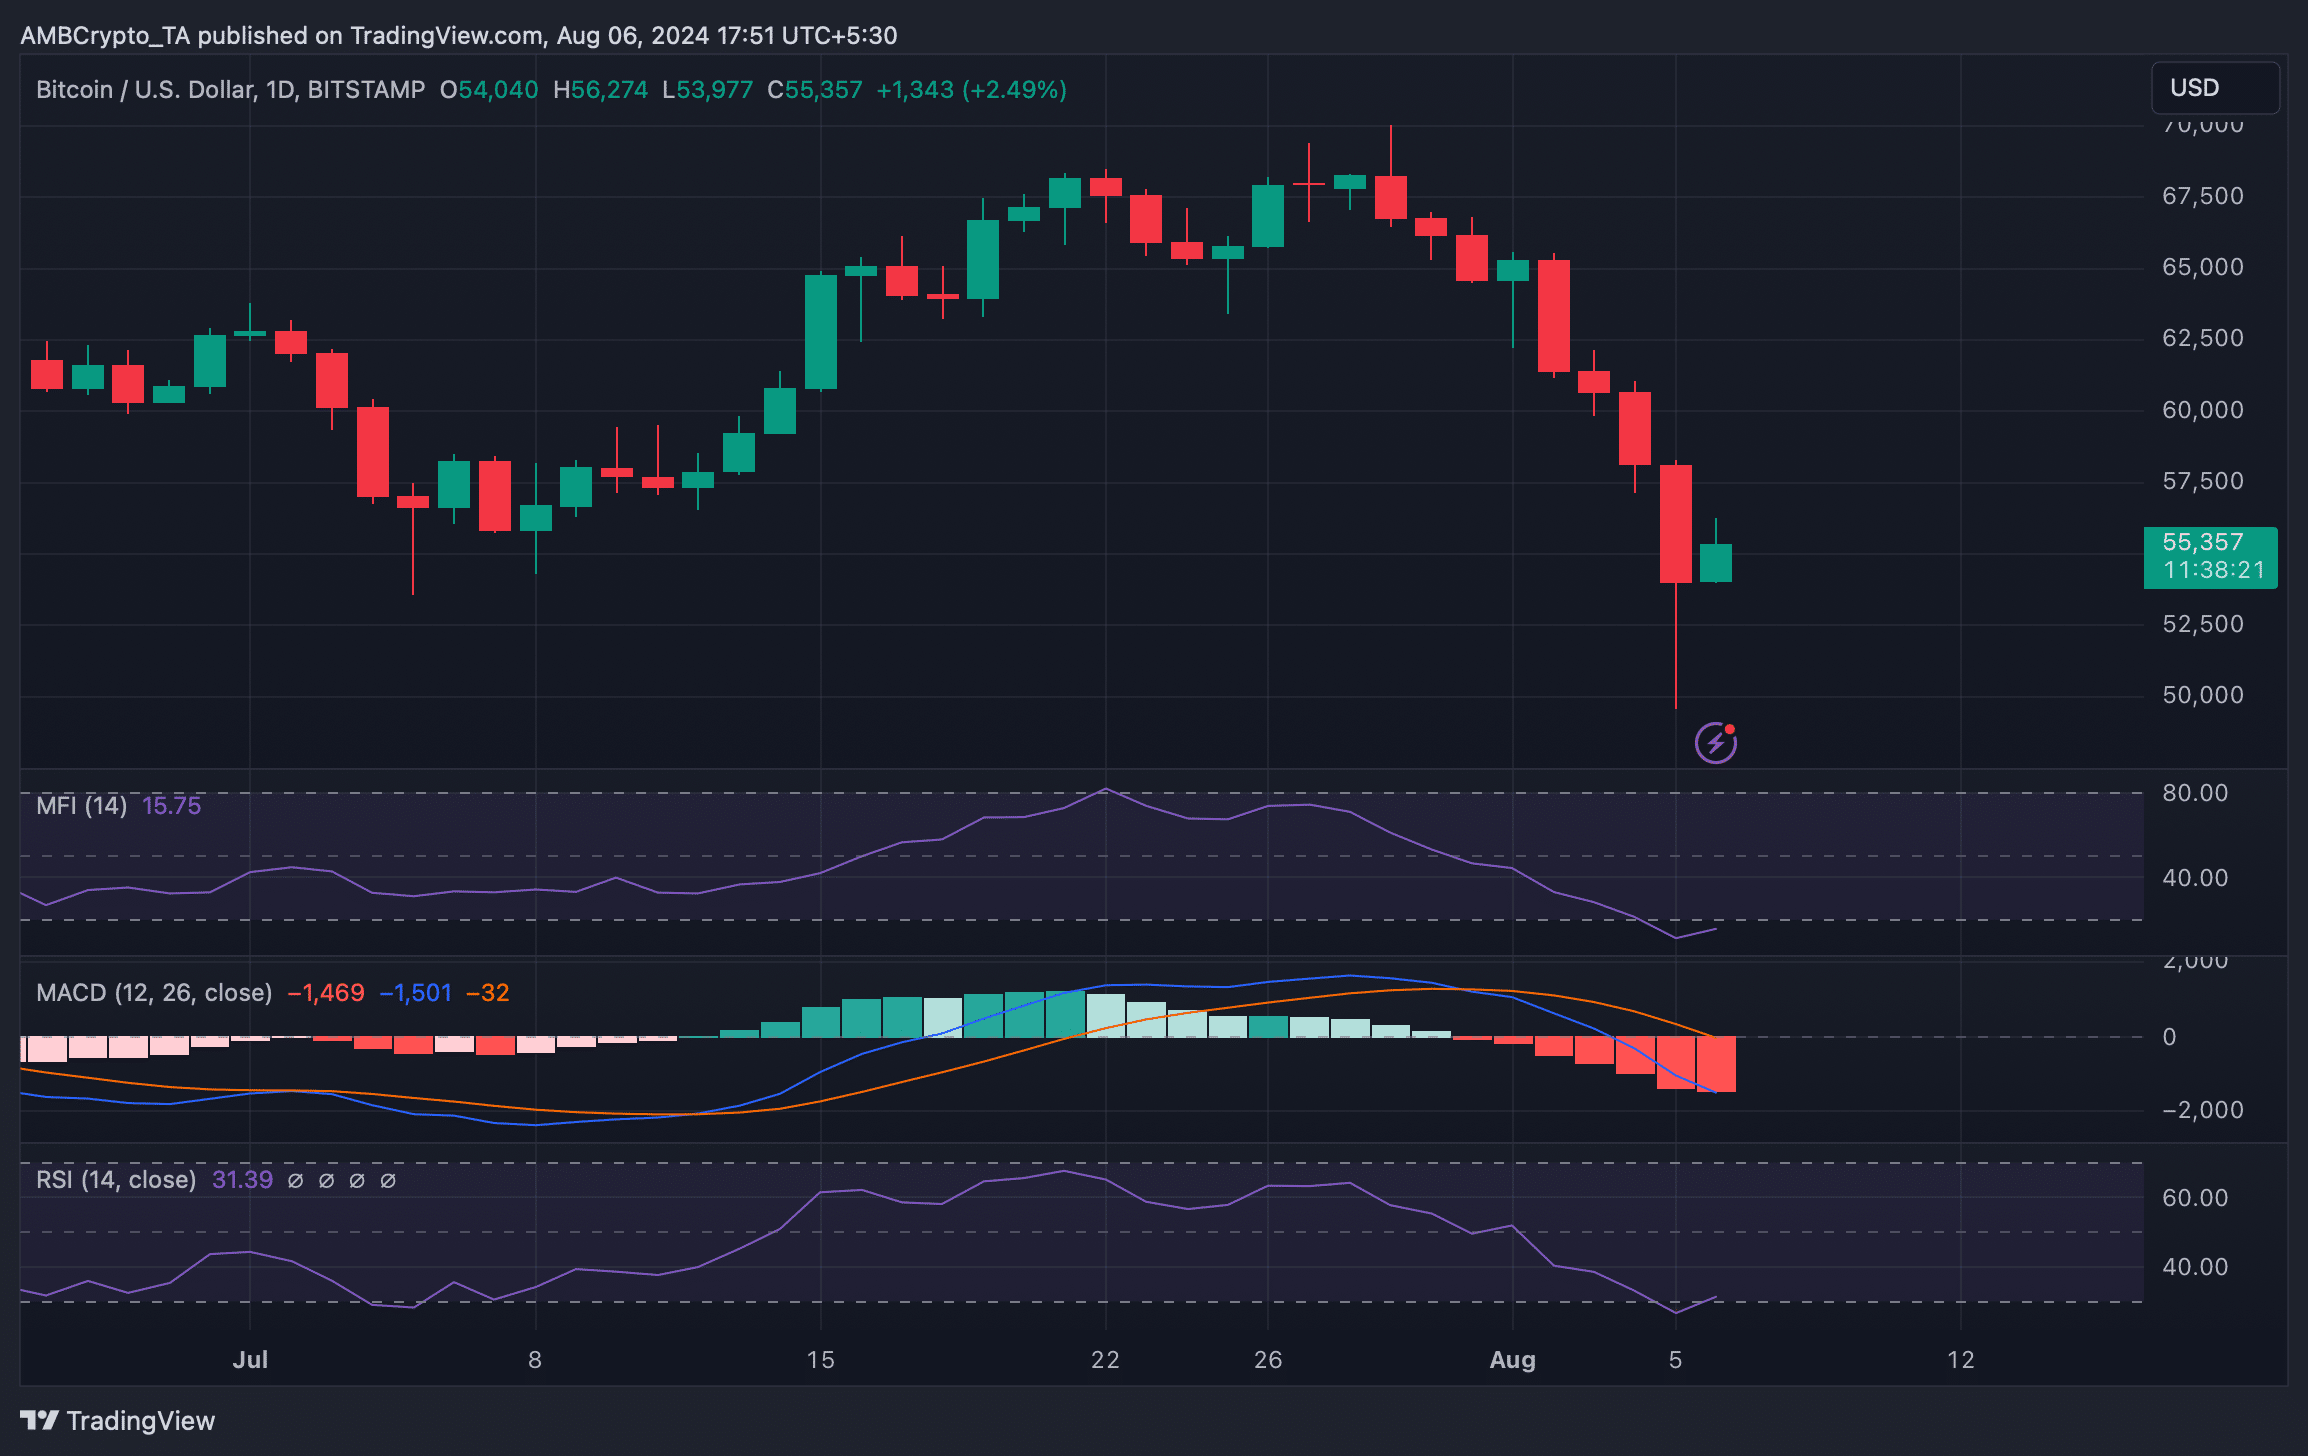
Source: TradingView


![Sei [SEI]](https://ambcrypto.com/wp-content/uploads/2025/06/Gladys-13-400x240.webp)