Bitcoin to enter a 300-day bull run? What this key indicator reveals
Bitcoin could sweep aside $73.7k soon and enter a bull run, which could nearly last a year.

- Bitcoin’s Open Interest surged 9% on the weekly moving average.
- Technical analysis and short-term holder profits showed a bullish breakout was highly likely.
Bitcoin [BTC] could enter a 300-day bull run, according to crypto analyst Axel Adler. Data from CryptoQuant for the Short-term holder profits, he stated that the bull market was in full swing.
With prices just 4.2% below the $73.7k ATH from two months ago and the halving event past us, the buying pressure might be trending higher here on.
The Open Interest suggested that there is more room for prices to grow.
Assessing the previous peaks and what they forecast for the future
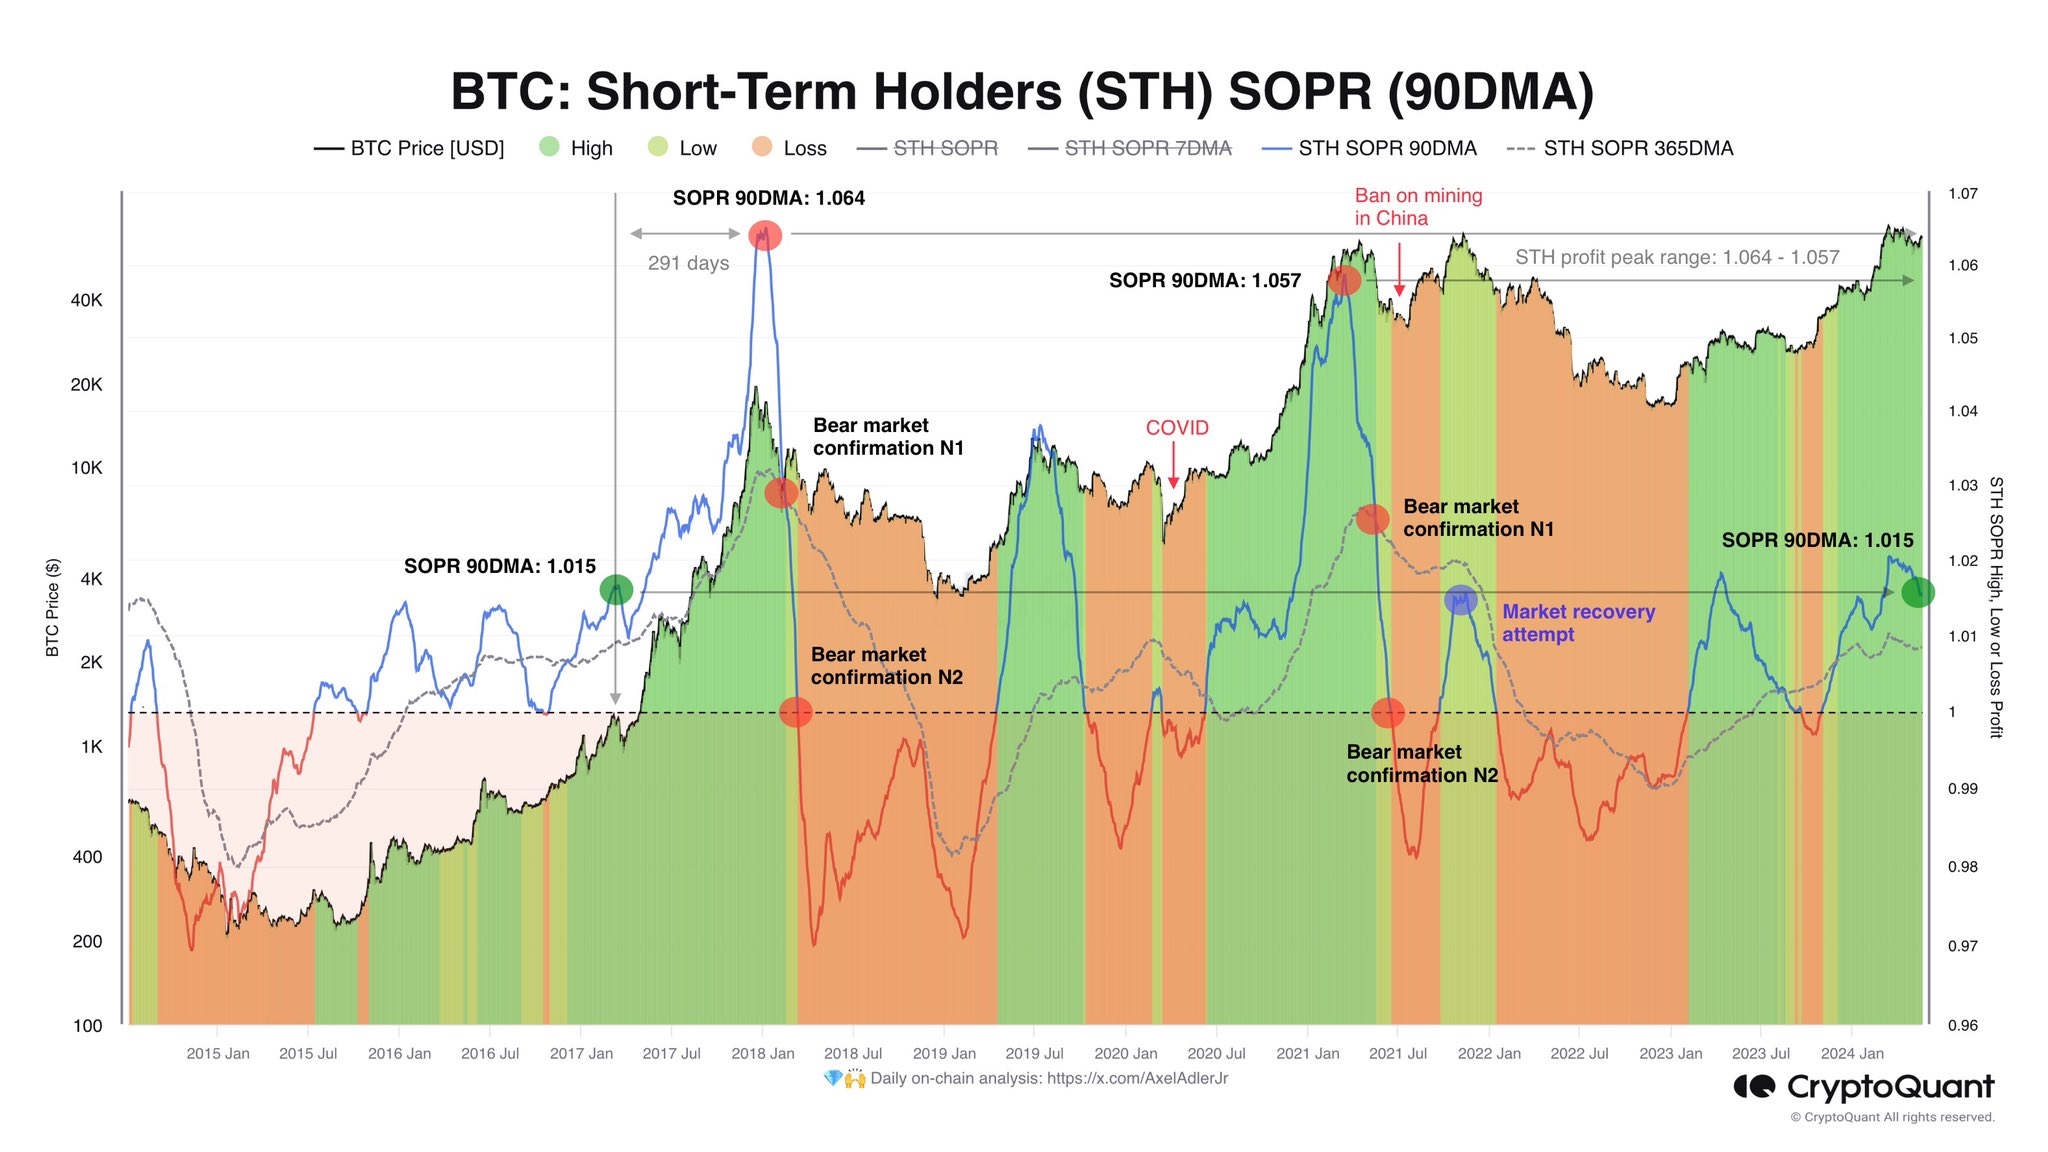
The 90-day SMA for the short-term holder spent output profit ratio (STH SOPR) peaked at 1.064 in January 2018 and at 1.057 in March 2021. This suggested that the STH profit peak range is at 1.064-1.057.
At press time, the STH SOPR’s 90-day moving average was at 1.015.
This indicated that there’s more room for gains and the top was very likely not in. Additionally, there were 291 days between the SOPR 90DMA reaching 1.015 and the cycle peak.
However, there were only 105 days between the same values in the 2020-21 cycle. Hence, we might be in for anywhere from three to twelve months of a bull run.
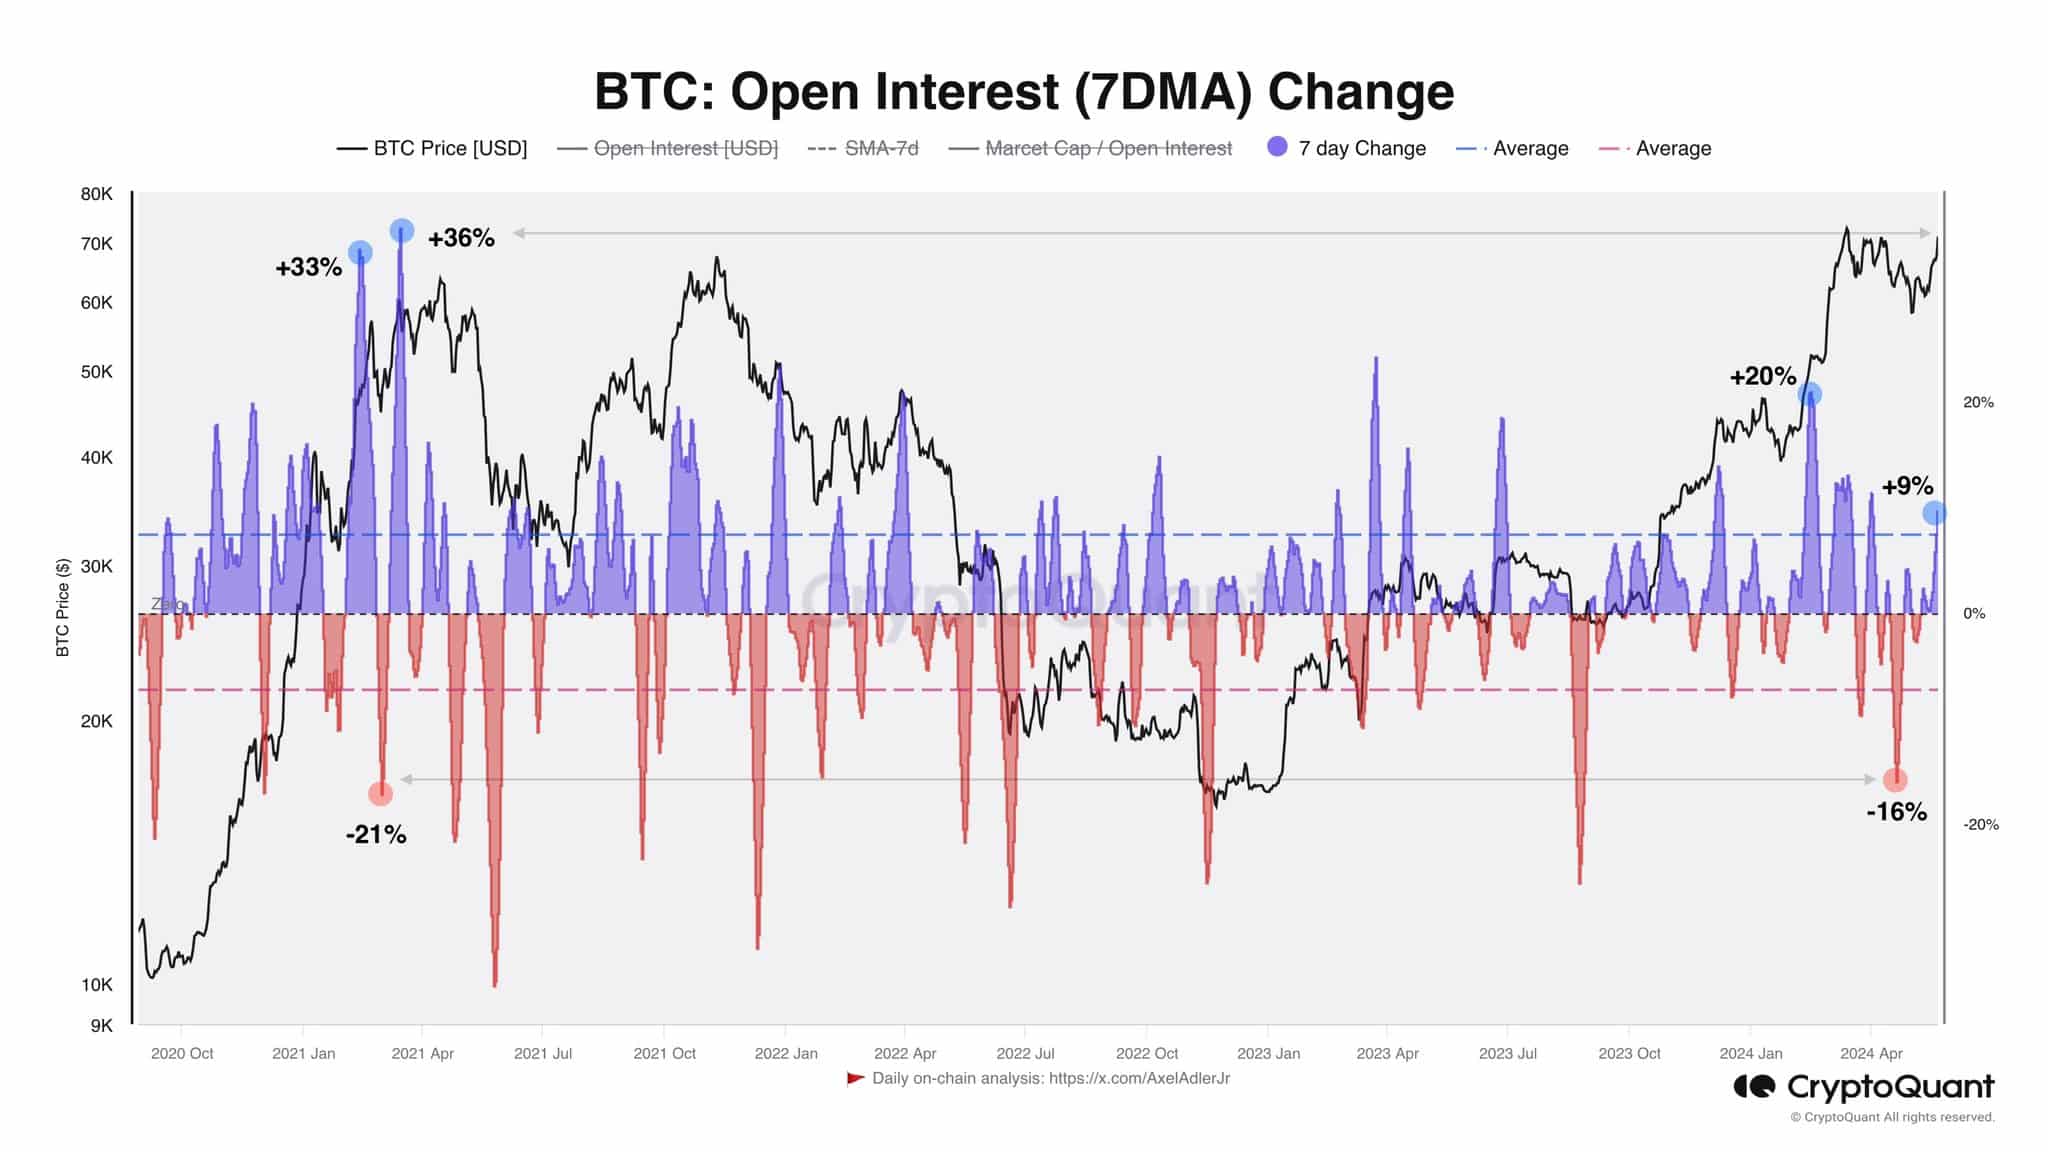
The analyst also pointed out that 7-day moving average of the Open Interest was only up 9% during the recent move.
By comparison, the 2024 January one had 20%, with the 2021 run also seeing multiple OI 7DMA moves close to 20%.
Taken together, both observations support the idea that the Bitcoin market has only begun to rally.
What are the resistance levels to watch out for past the ATH?
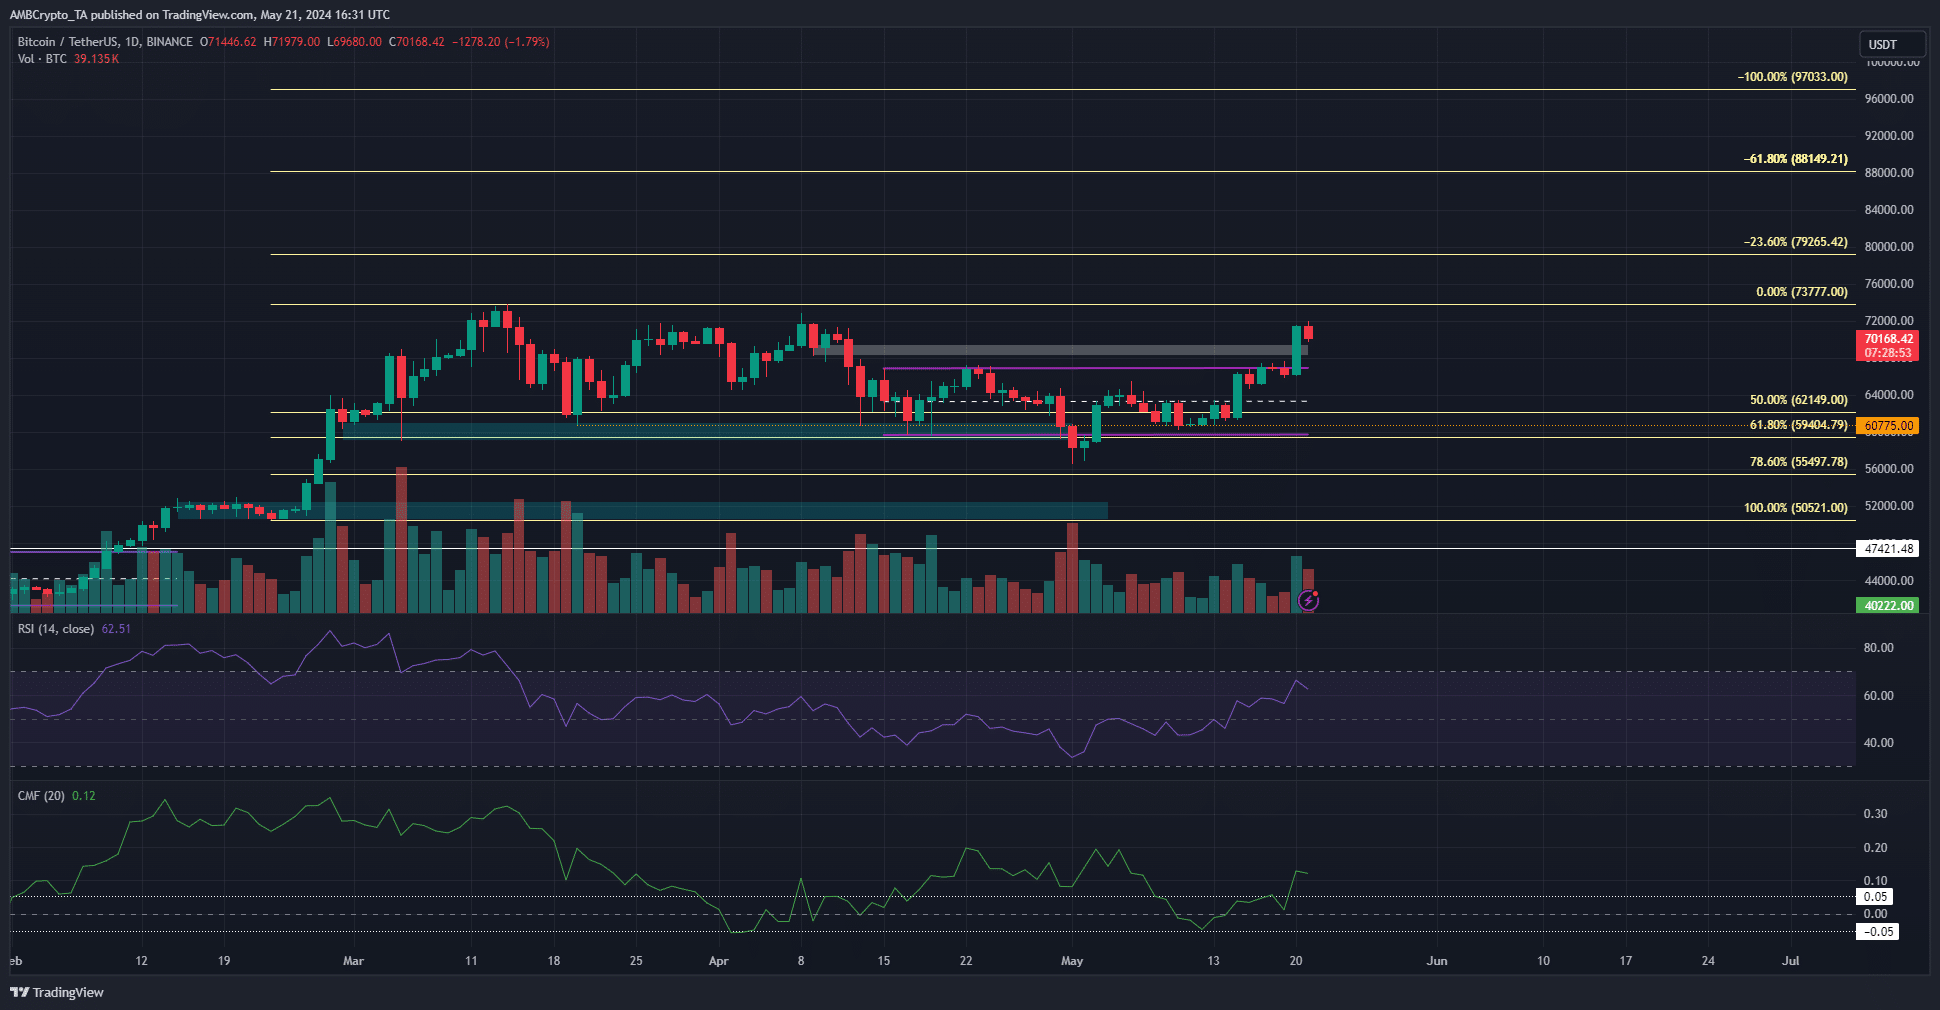
The local range (purple) and imbalance (white) were both convincingly broken. The high at $73.7k could be swept aside soon if the momentum continues.
The RSI has not yet pushed past 70, which would be a strong sign of BTC bullish dominance near the all-time high.
Read Bitcoin’s [BTC] Price Prediction 2024-25
The CMF surged past +0.05 to denote significant capital inflow and increased demand.
The Fibonacci extension levels (pale yellow) showed that $79.2k, $88.1k and $97k are the next resistance levels to watch out for.