Bitcoin to face altcoin onslaught? Here’s what to expect in June
The BTC Dominance was closing in on a short-term range low at 54%, meaning that it would likely bounce soon.

- The altcoin positioning chart showed that alts performed well relative to Bitcoin recently.
- Their market capitalization has steadily grown alongside BTC’s price gains.
The Bitcoin [BTC] slump of early May lasted only for a short while. The ETF inflows were negative for around a week at the beginning of the month, but have quickly picked up since then.
The past two weeks saw consistent inflows which highlighted the presence of demand behind Bitcoin.
The altcoin performance in the past month has also been positive. Memecoins have been some of the best individual performers, but the rest of the altcoin market also expanded its market capitalization.
Will the past nine months’ pattern repeat once more?
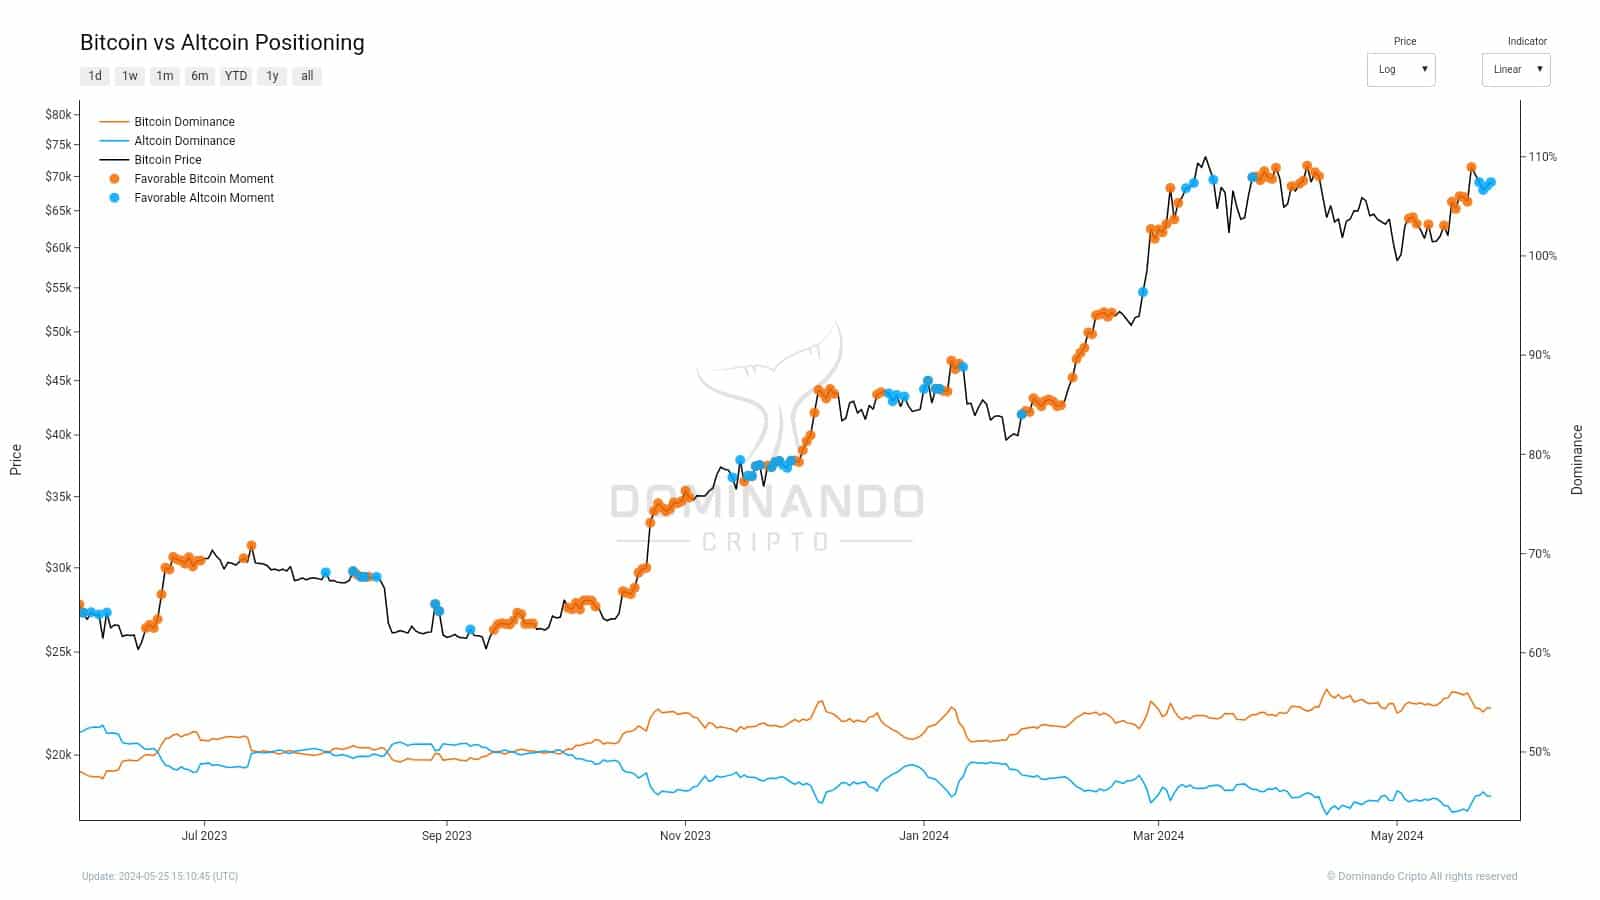
Crypto analyst Jessica Miranda observed in a post on X (formerly Twitter) that altcoins had more prominence compared to Bitcoin. While Bitcoin still held just over 54% of the market share, compared to the king the alts have performed better recently.
The analyst noted that this usually does not last long and is also usually followed by a downturn in BTC prices. That has been true for a large part of the past nine months, when the rally began in earnest in September 2023.
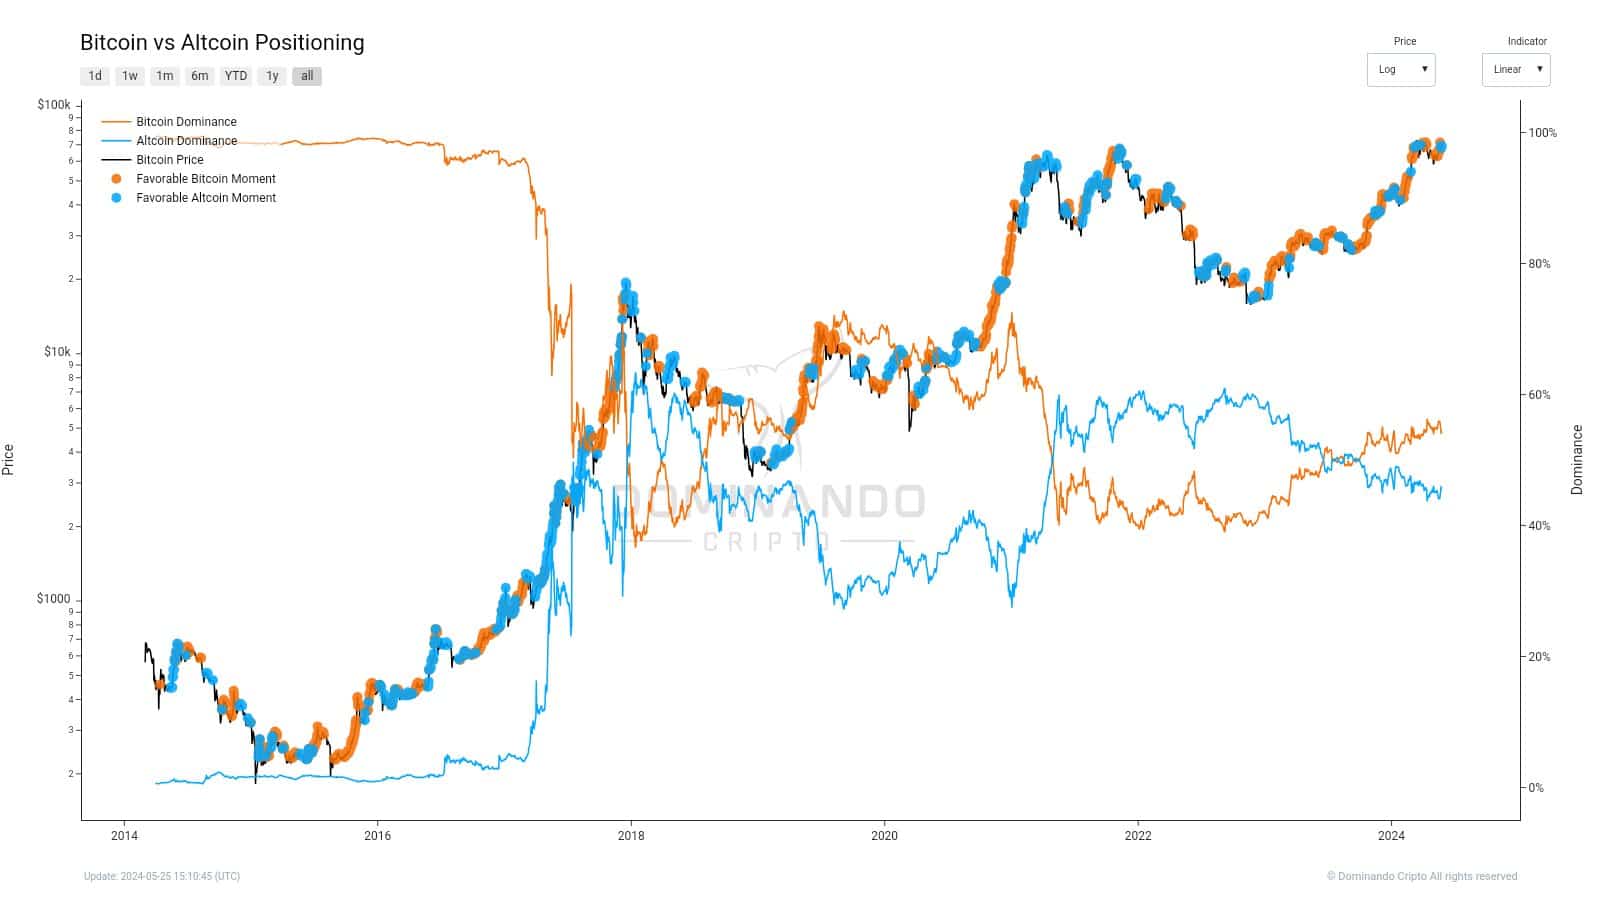
However, on the longer timeframes, even intense bull runs can have periods where altcoins outshine Bitcoin. The 2016-17 run had plenty of such moments. The 2020-21 run had fewer such occurrences but a BTC rally did see favorable altcoin moment.
The bear trend of 2022-23 was when this pattern made itself more clear. If it repeats once more, Bitcoin might see a dip in the coming week or two.
Taking the recent Bitcoin breakout past the $67k resistance into account, such a dip was unlikely. Yet, it is something traders might have to be prepared for.
What does the Bitcoin dominance chart reveal?
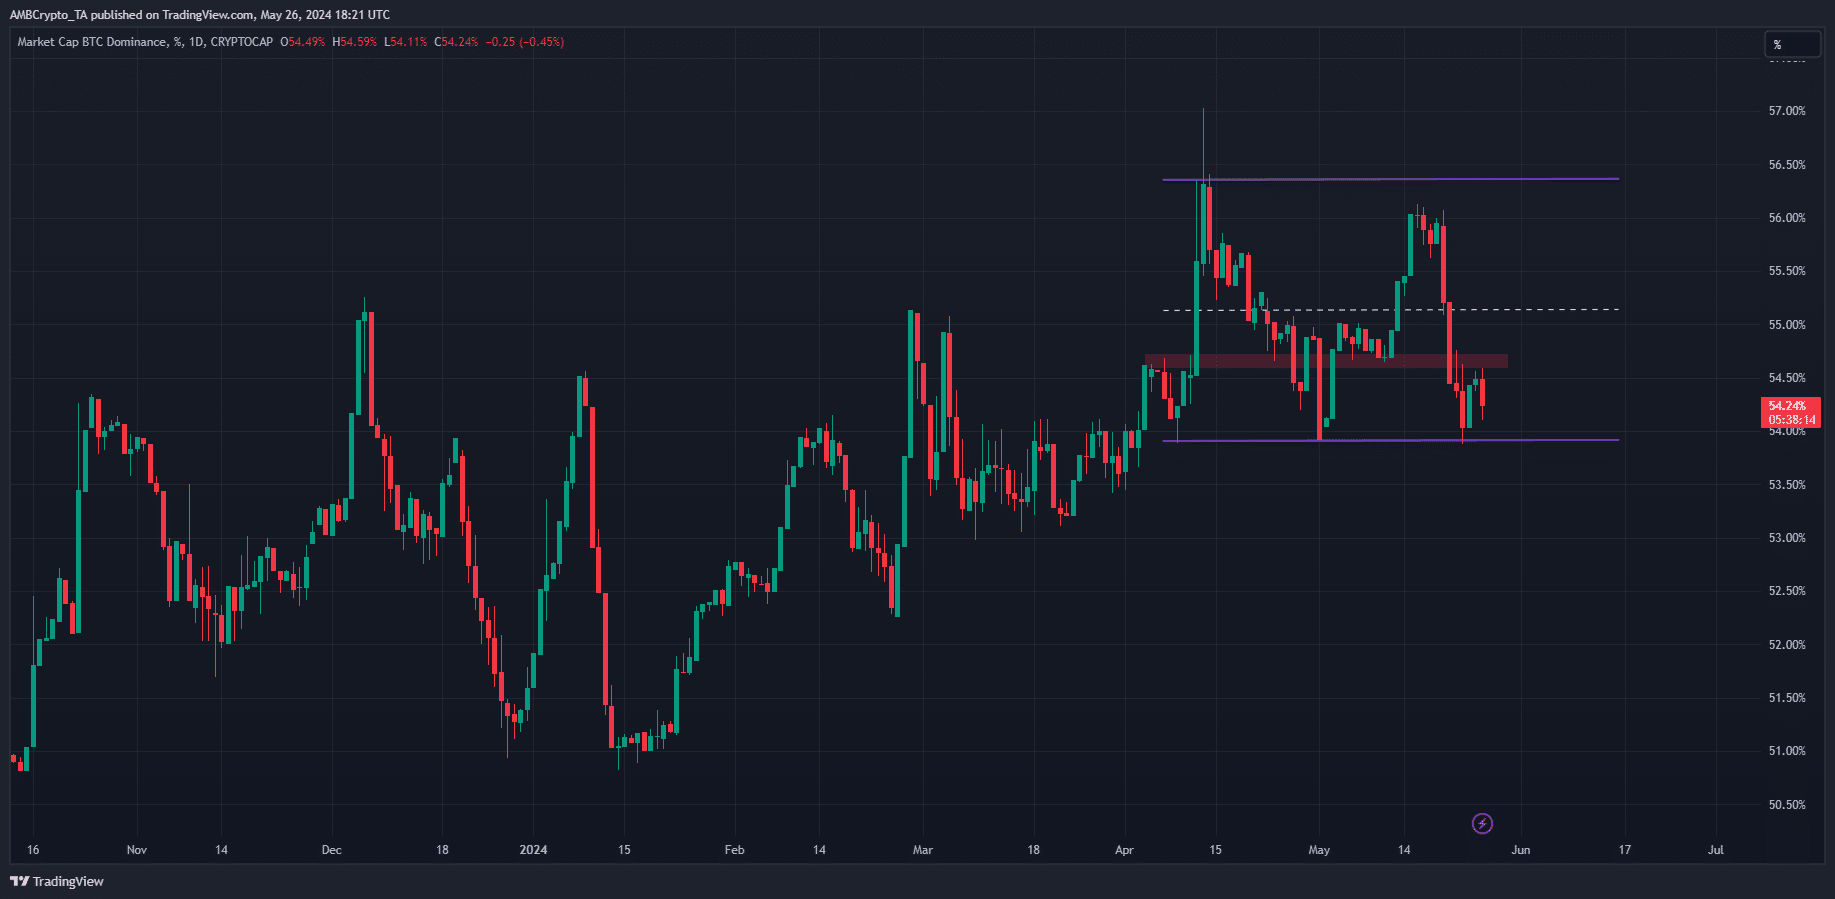
The BTC Dominance was closing in on a short-term range low at 54%, meaning that it would likely bounce soon.
Such a bounce would cut short any rally that the altcoin market has initiated, but it would also subvert expectations of a BTC price drop from the altcoin positioning chart.
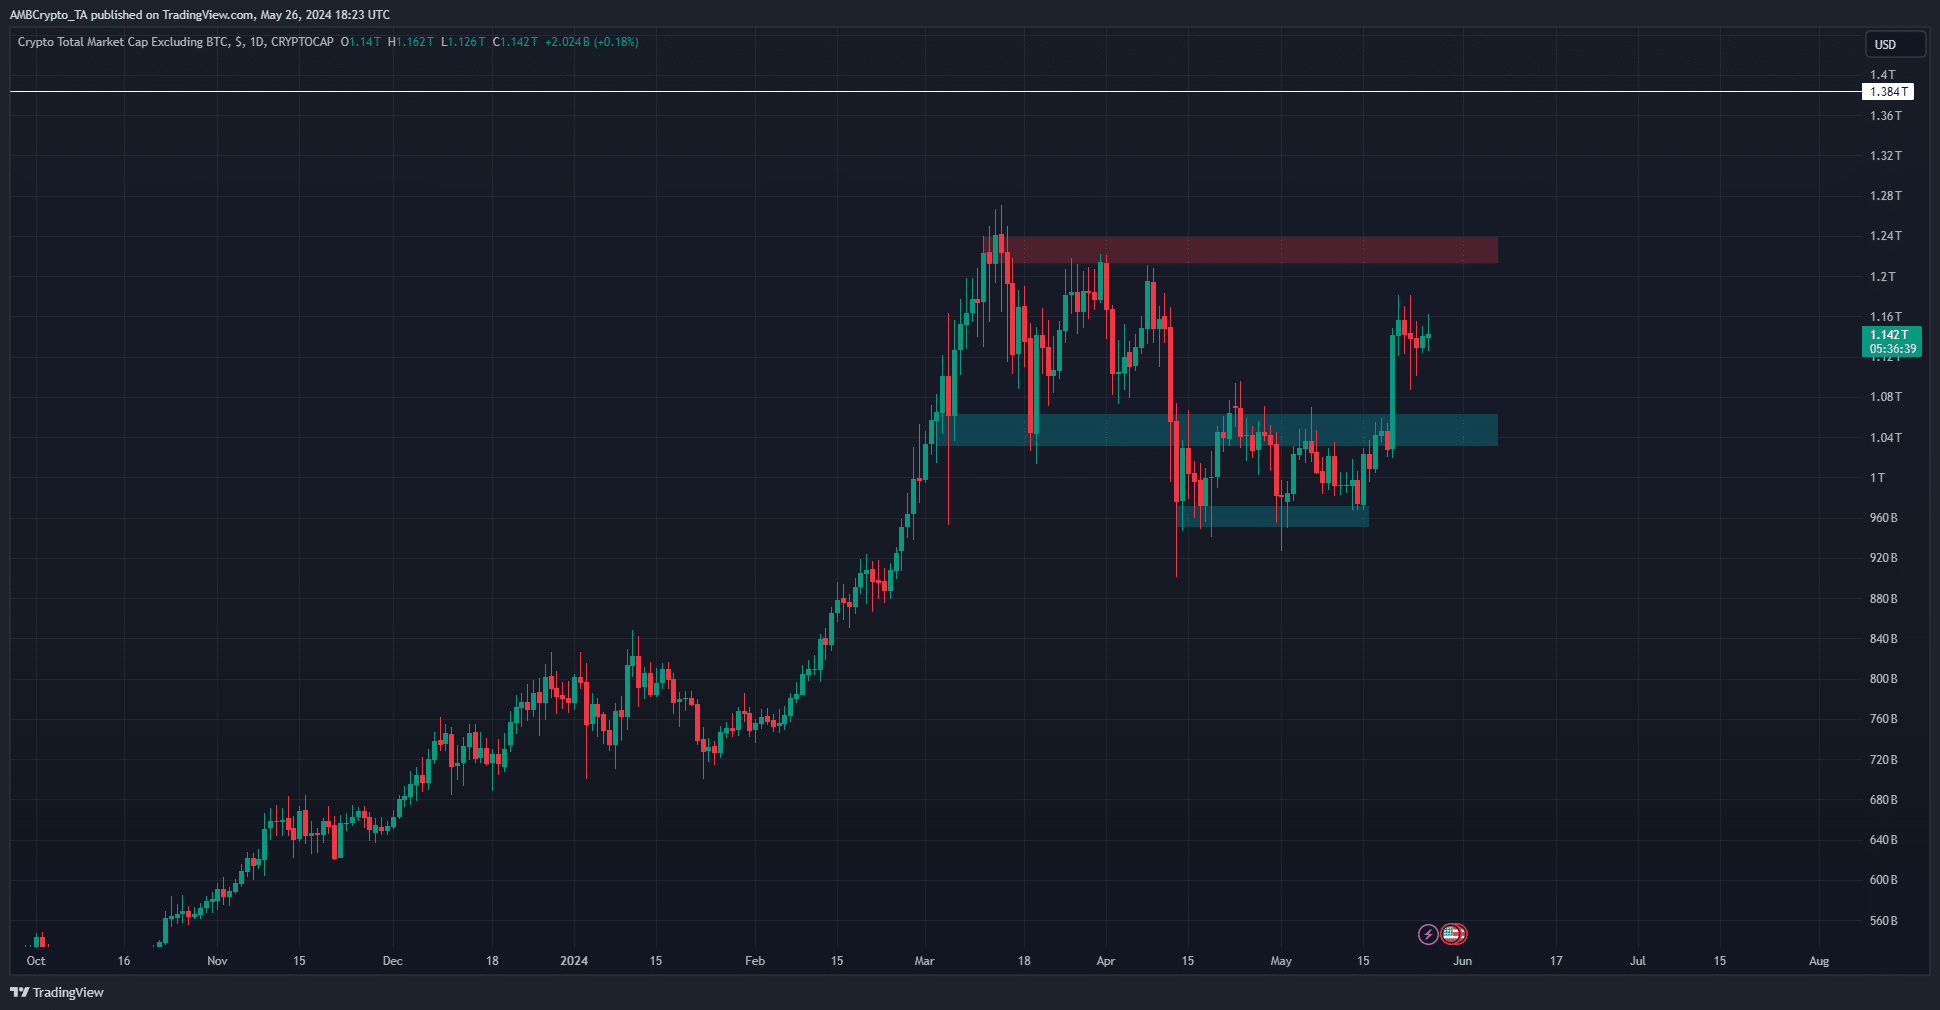
The suggestion that the altcoin market could see a pullback gained more credibility when the altcoin market cap, or the market cap of the entire crypto ecosystem minus that of Bitcoin, was analyzed.
Is your portfolio green? Check the Bitcoin Profit Calculator
The market cap chart approached a key zone of resistance at $1.24 trillion. A rejection from that region was expected from a technical analysis perspective, although eventually this resistance would be broken given the strong uptrend of the past eight months.
Therefore, based on technical analysis, a Bitcoin surge and an altcoin (temporary) slump is expected in the first half of June.


