
- Bitcoin stabilized above its $60,970-support level – A sign of market strength
- Popular analyst Zen is predicting a potential dip to $60,150 or $53,000 though
Over the last 24 hours, Bitcoin’s price appreciated by by 1.34% to trade at $61,571 on the charts. Its latest uptick highlighted a strengthening market, especially with the market cap hitting $1.214 trillion and a daily trading volume of $22.06 billion.
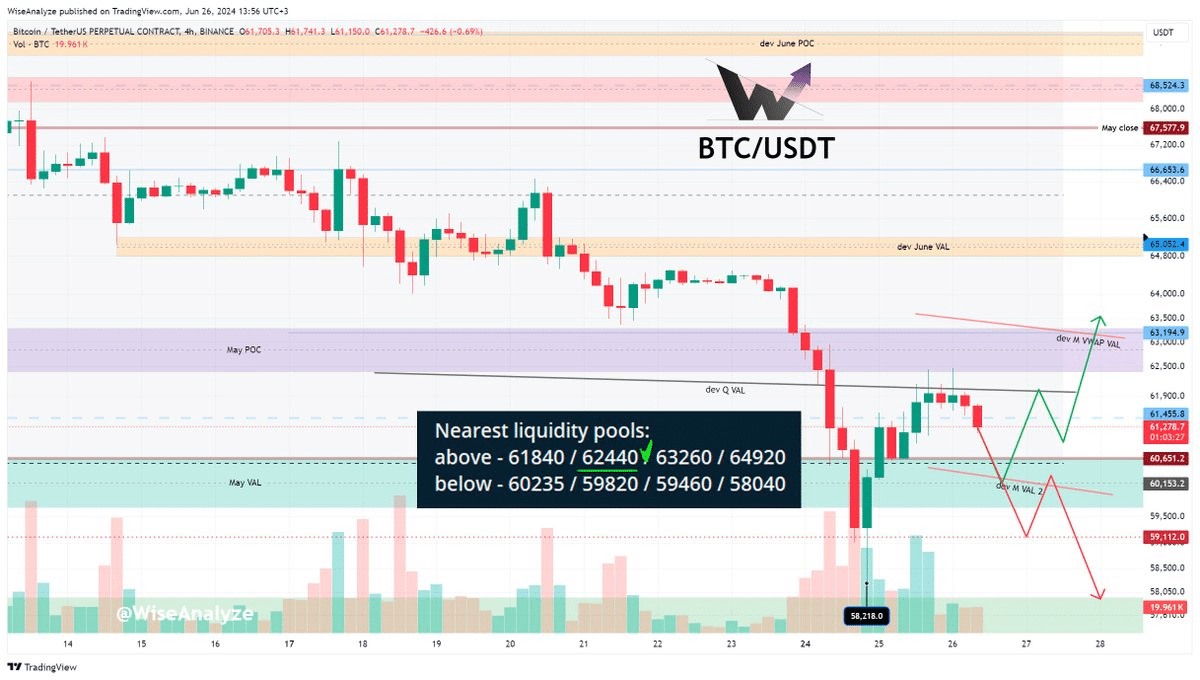
Bitcoin’s ongoing price movement also revealed its immediate support at $60,970 and resistance levels at $62,000 and $62,250. In fact, the recent hike above $61,500 meant that the support level breach is now behind Zen’s forecast, and the price may be stabilizing above the critical $60,622 – $59,600 range.
This stabilization aligns with Zen’s previous analysis about the potential for a bounce from the range bottom, if the price holds above these levels.
Here, it’s also worth noting that Zen predicted a potential dip to $60,150, citing cleared liquidity under $60,630 and a lack of volume in night trading. He noted the day chart’s downtrend and the month chart’s uptrend, suggesting a mixed but potentially bullish outlook in the medium term.
Finally, Zen highlighted the possibility of Bitcoin dipping to $53,000, which aligns with the monthly timeframe. This remains a very speculative possibility though since it would require BTC to fall by over 10% on the charts.
Source: X
Zen’s liquidity pool observations revealed that the nearest pools are at $61,540 and $62,540, above its press time price, and at $60,260 and $59,440 below it. Simply put, Bitcoin’s proximity to these liquidity pools, especially the one near $61,540, could potentially influence short-term price action.
Analyzing Inflows Data
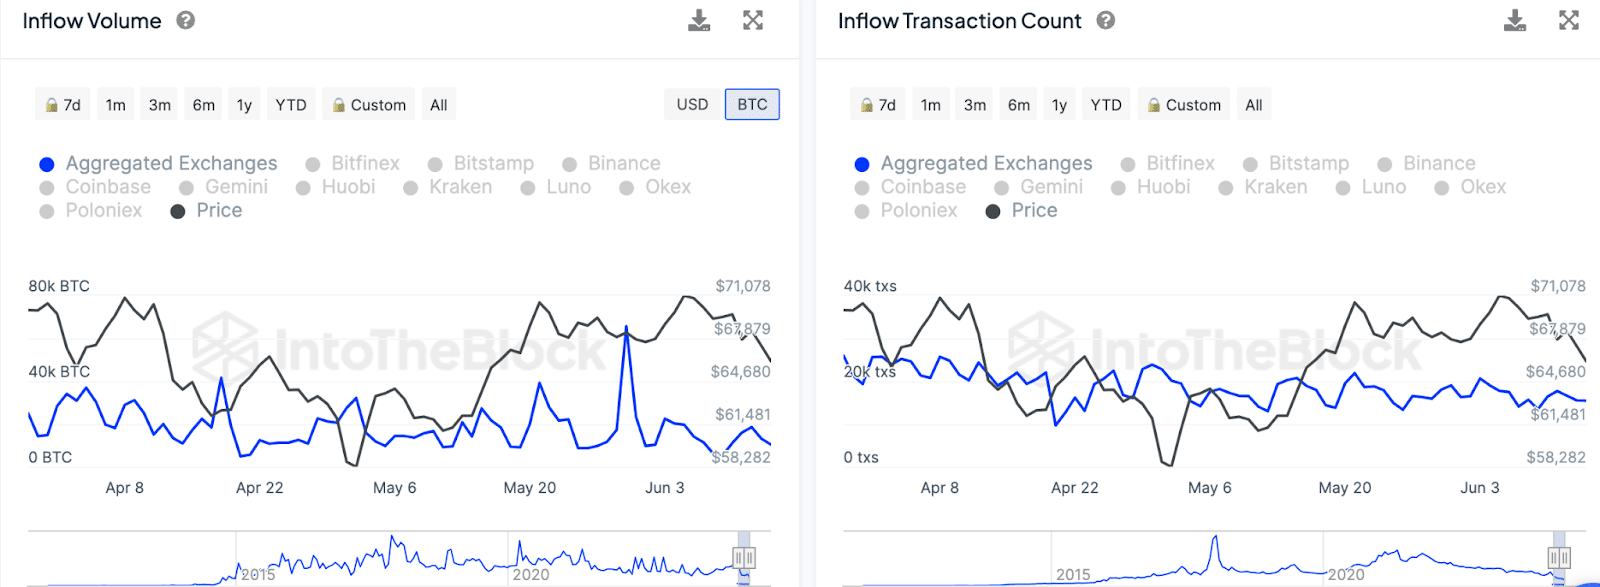
Elsewhere, inflows have fluctuated significantly, with notable spikes in late April and early June. These spikes often coincide with price changes, indicating that large volumes of Bitcoin moving into exchanges can precede price volatility. The transaction count data also highlighted similar patterns, with increased activity correlating with price movements.
Source: IntoTheBlock
In fact, from 8 April to 22 April, both inflow volumes and transaction counts were high, aligning with a price drop from $71,078 to $58,282.
In late April and early May, spikes in inflow volumes and transaction counts corresponded with price peaks around $64,680 and $67,879, respectively.
Finally, early June saw multiple peaks in these metrics, with the price trending around $61,481, close to the current level on the charts.
Hence, these are all levels and metrics worth looking at for a peek into the cryptocurrency’s future price action.