
Disclaimer: The findings of the following analysis are the sole opinions of the writer and should not be considered investment advice.
Bitcoin [BTC] has been trading sideways in the past few days as the bulls struggle to establish an uptrend. Even though they were successful in pushing the price back above $20k, a lot more work would be needed before Bitcoin can change its trajectory.
On the charts, the importance of the $23k area was highlighted yet again. In the coming days, this level of resistance would be one to watch out for.
BTC- 1 Hour Chart
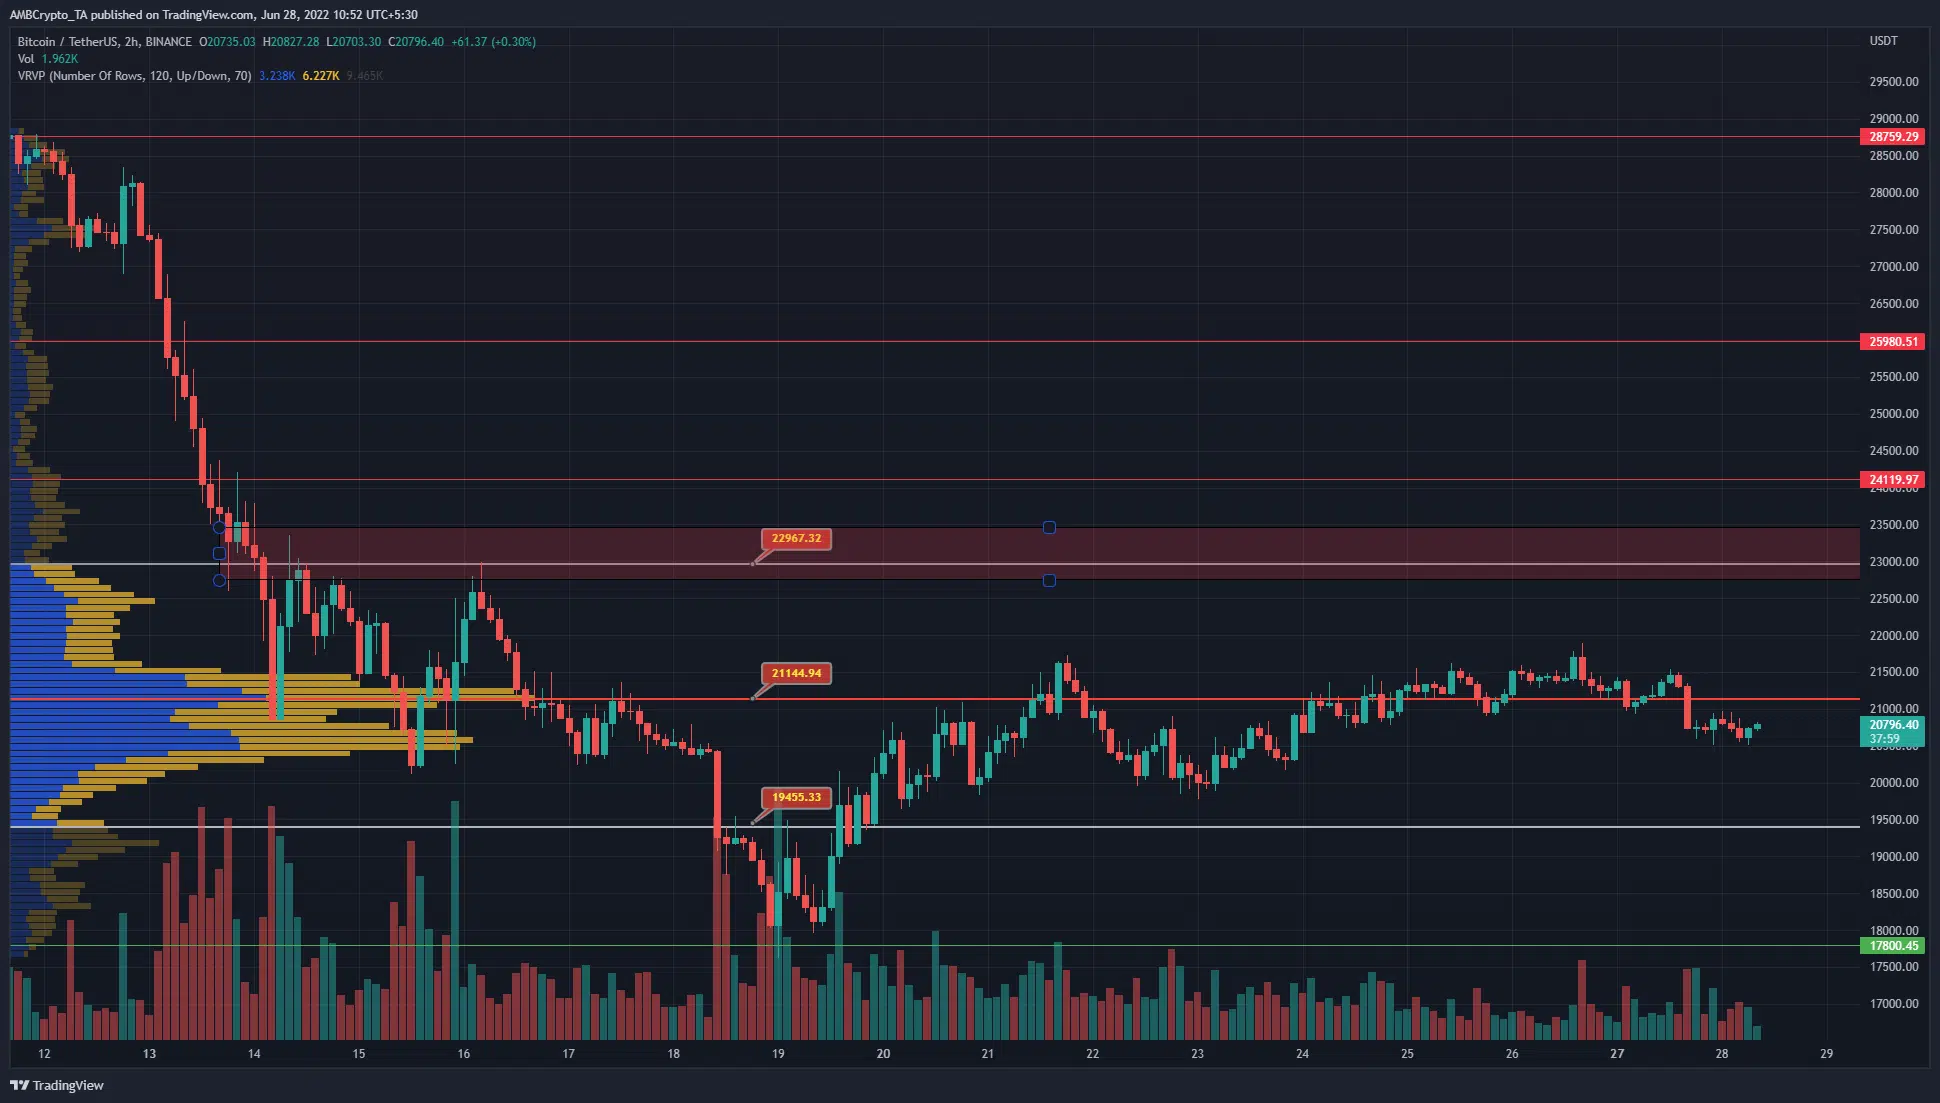
Source: BTC/USDT on TradingView
The Visible Range Volume Profile tool was used to plot the Point of Control (POC), the Value Area Highs (VAHs), and Value Area Lows (VALs). These levels lie at $21.1k, $22.9k, and $19.4k respectively. At the time of writing, the price of Bitcoin had slipped beneath the POC. This suggested that it could move toward the VAL at $19.4k.
The VAH lined up very well with a zone of resistance at $23k. This level was also where the market formed a lower high on its downtrend. Therefore, to flip the market structure to bullish, the price would have to close a higher timeframe trading session above this level.
Rationale
Source: BTC/USDT on TradingView
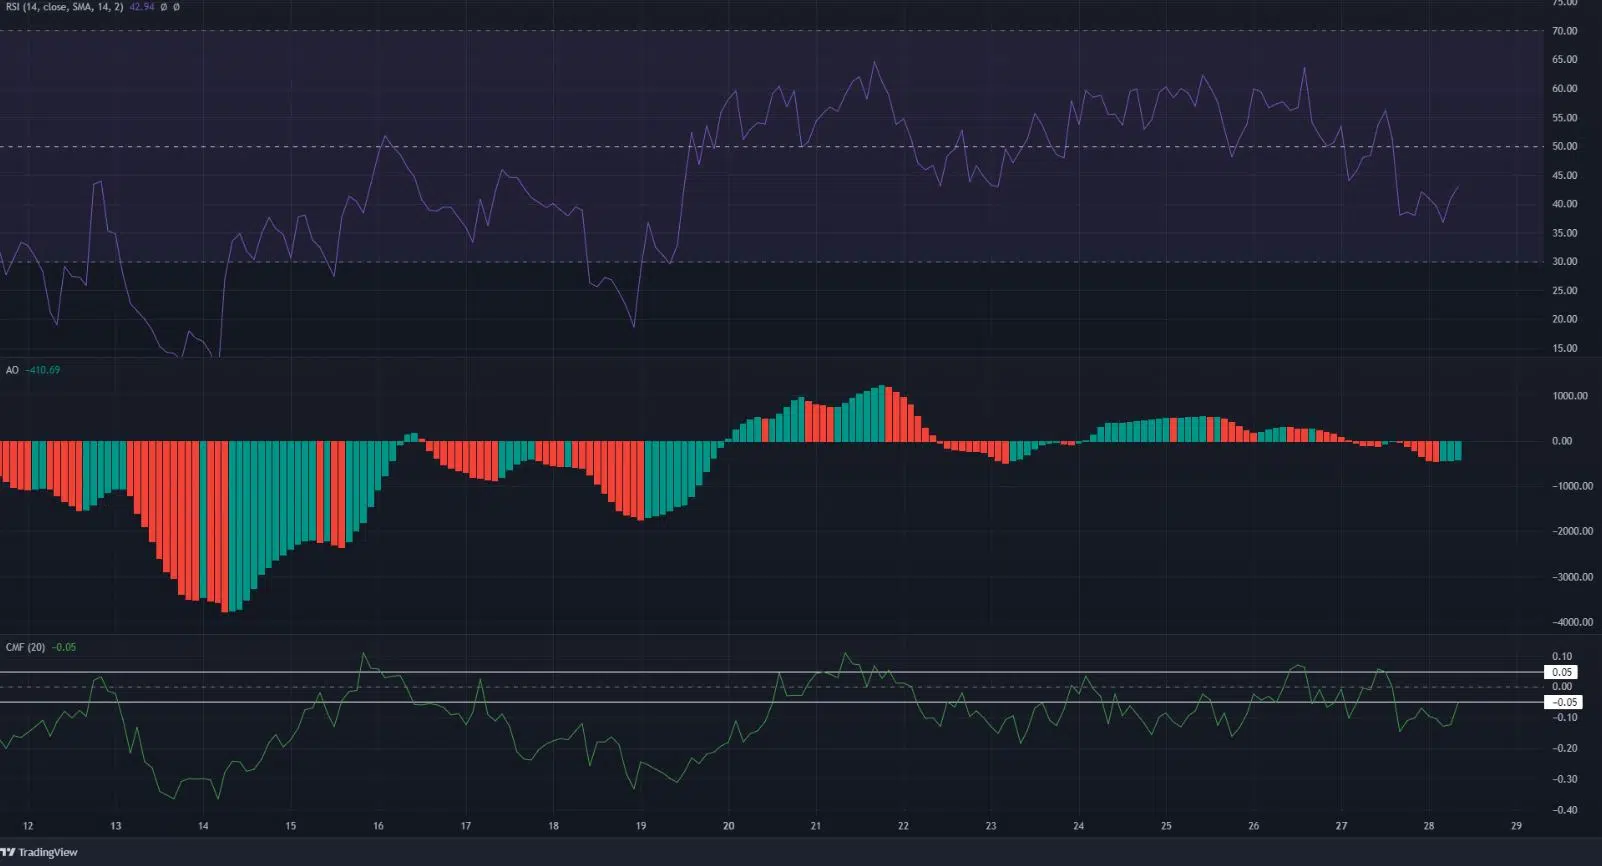
On the hourly chart itself, the momentum was sliding back into the favor of the bears. The RSI slipped beneath neutral 50 once again, after it was unable to convincingly break above the 60 mark to denote strong bullish momentum.
The Awesome Oscillator (AO) also fell beneath the zero line to hint at bearish dominance in terms of momentum. This came at a time when the price fell below the POC at $21.1k (red) on the price charts. Hence, the confluence of selling pressure could see BTC dip lower.
The Chaikin Money Flow has also been unable to climb past +0.05 and was at -0.05 at press time. This showed that recent trading hours saw significant capital flow out of the market.
Conclusion
The lower timeframe charts highlighted bearish momentum and selling pressure to be on the rise. For Bitcoin, the inability to climb past the $21.8k-$22k level meant that buyers still lacked strength in the market. Another dip to $19.5k-$19.8k could be likely.