Bitcoin traders, here’s why you should brace for a pullback to $100k
A rally led by the derivatives market could be at risk of heightened volatility and deeper pullback- will Bitcoin experience this soon?
- Bitcoin saw high trading volume in the derivatives markets, but not in the spot markets.
- The build-up of liquidation levels at $100k and lower could pull prices lower.
Bitcoin [BTC] reached an all-time high of $111,980 on Binance on Thursday, the 22nd of May. It was reported that the Open Interest (OI) reached a record high of $74 billion. The influx of capital into the derivatives market in recent days signaled bullish conviction.
At the same time, numerous liquidations have built up under the $100k level. This could attract the price southwards, since price is attracted to liquidity. Should traders expect a pullback in the short term?

Data from Coinalyze showed that the OI trend has flattened out after BTC reached a new all-time high. The Funding Rate had been strongly positive, but over the past 24 hours, it has fallen to neutral levels.
Traders need to prepare for a short-term pullback
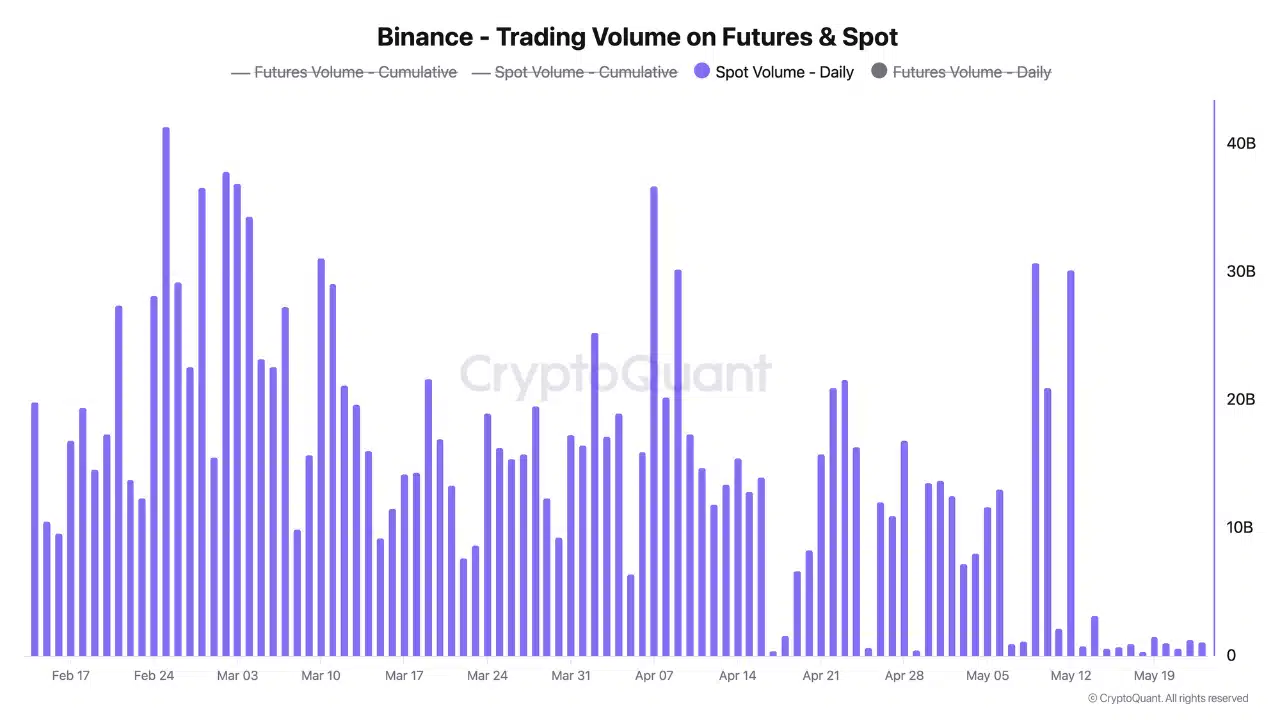
In a post on CryptoQuant Insights, user Darkfost pointed out that the spot demand was dwindling. The futures trading volume was going strong, highlighting high speculative interest. Yet, the drop in spot volume as Bitcoin entered its price discovery phase was a disappointment.
The lack of spot demand suggested investors were cautious about buying BTC above the $94k-$96k area. This region served as resistance earlier in May before the price broke out to nearly touch the $112k mark.
A rally led by the derivatives market could be at risk of heightened volatility and deeper pullbacks.

Zooming out to cover the price action of the past six months, the 1-day chart of Bitcoin highlighted a possible range formation (white). Two routes were possible in the coming weeks- a sustained uptrend, or a reset to $100k or even $93k.
When ranges form, price action within the range induces liquidation levels to build up around the extremes of the range. The retracement to $77.5k in March and the subsequent recovery saw short liquidations build up at $99.6k, $108k, and $113k.
The first two levels have been swept. The dwindling spot demand suggested a market reset was possible, and $113k might be out of reach for now.

The 3-month chart underlined the build-up of liquidation levels at $100k and $92k as the next potential targets.
Depending on the profit-taking activity and whether the bulls can find their feet again, Bitcoin might cede $106k to the bears again.