
Ripple – 3 signals hint XRP could lead altcoins into Q3

- Bitcoin’s price appreciated by more than 4% in the last 24 hours
- Several metrics hinted that BTC was overbought on the charts
Bitcoin [BTC], as the market’s top crypto, led the bull market last week as its price rallied considerably on the charts. However, that’s not all, as data revealed another interesting update, one that might precipitate another price hike.
However, nothing can be said with any certainty, especially since another indicator seemed to suggest otherwise at press time.
Bitcoin’s market dilemma
The king of crypto’s price comfortably rose by more than 14% in the last seven days. So was the case in the last 24 hours too, with the coin’s value surging by over 4%. At the time of writing, BTC was trading at $66,616.52 with a market capitalization of over $1.3 trillion.
Ali, a popular crypto analyst, recently shared a tweet highlighting a bullish development though. According to the same, the crypto has once again broken above a resistance level. This clearly indicated that BTC’s price might advance further in the coming days.
However, not everything seemed to be working in BTC’s favor. For instance, the TD sequential indicator flashed a sell signal on BTC’s daily chart, as per another tweet from Ali.
If that’s true, then BTC’s rally might come to an end soon. Nevertheless, the tweet also mentioned that if BTC manages to sustain the uptrend and climbs above $67.5k, then the sell signal will be invalidated.
Where is BTC heading?
Since the aforementioned datasets looked pretty ambiguous, AMBCrypto took a closer look at the king of crypto’s metrics to better understand what to expect.
According to Glassnode’s data, BTC’s NVT ratio dropped on the charts. Usually, a drop in the metric means that an asset is undervalued, which often results in price upticks later on.
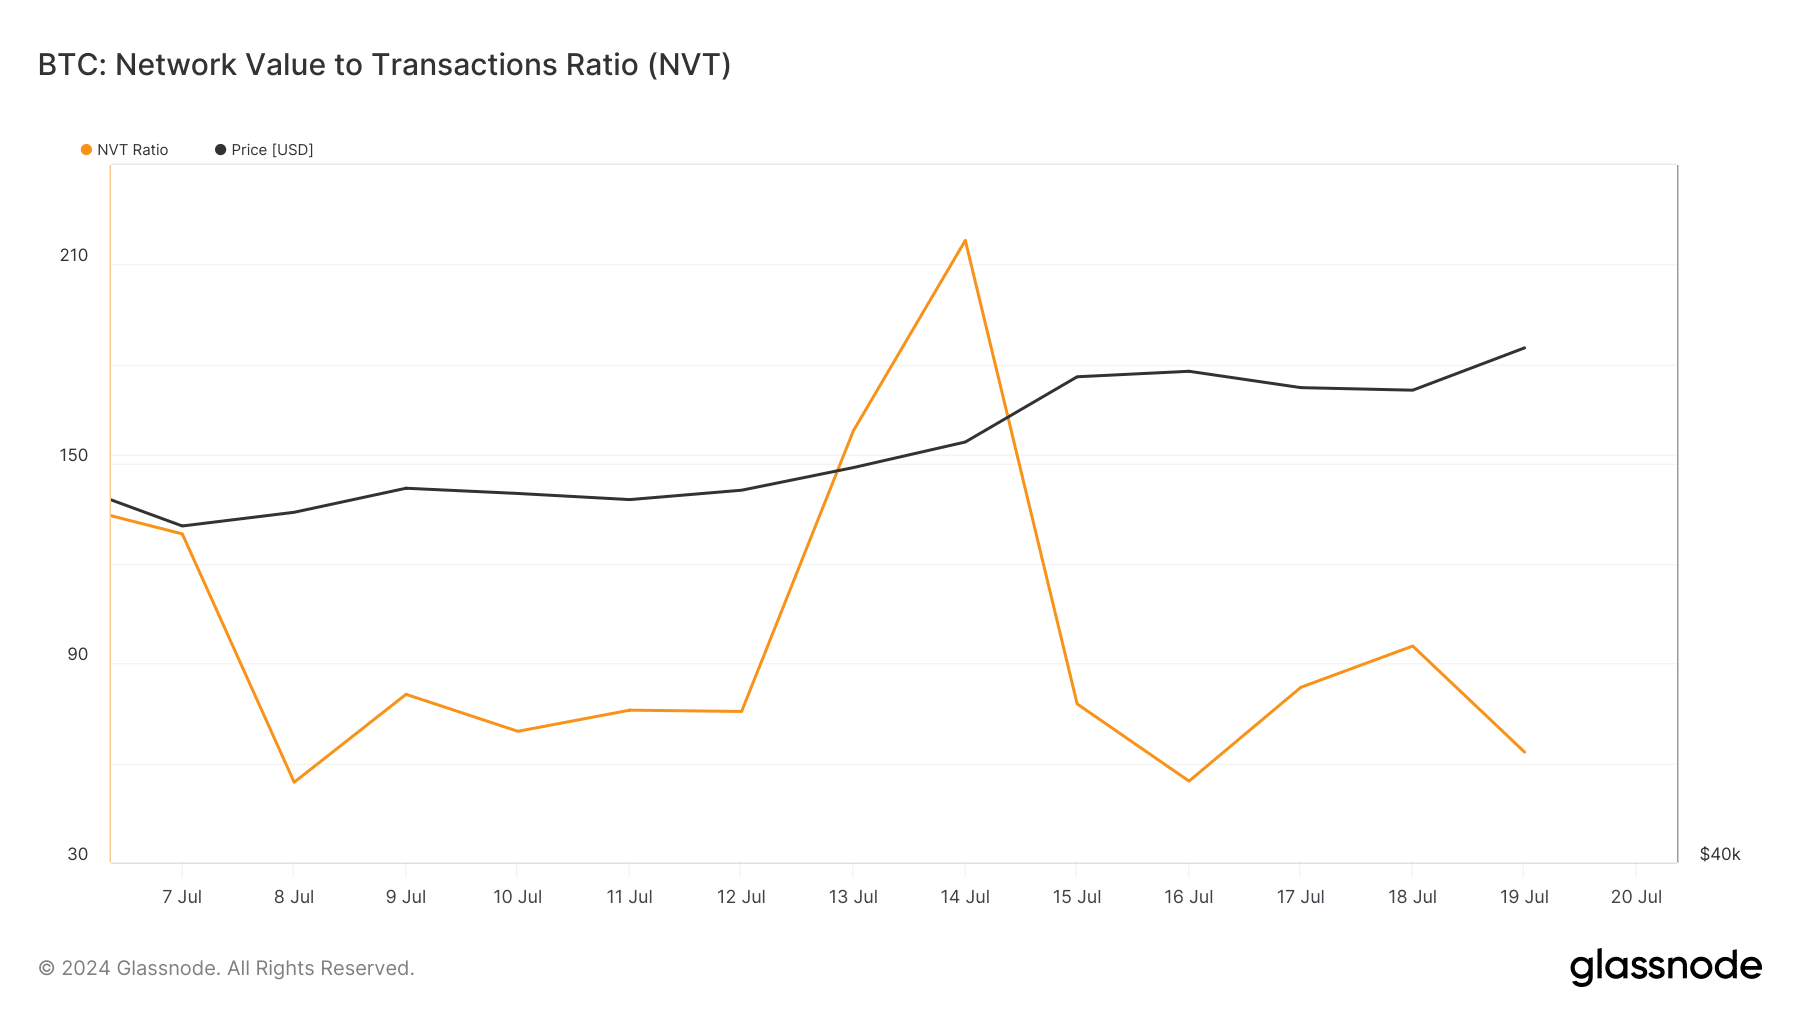
Source: Glassnode
An additional look at CryptoQuant’s data revealed a few other bullish metrics too. For instance, BTC’s net deposit on exchanges was low, compared to the last seven days’s average – A sign that buying pressure was high. Its binary CDD revealed that long-term holders’ movements in the last 7 days were lower than average. They have a motive to hold their coins.
Other metrics and indicators, however, were concerning. For example, both Bitcoin’s Relative Strength Index (RSI) and Stochastic were in overbought zones.
This indicated that selling pressure might rise soon, in turn putting an end to BTC’s rally on the charts.

Source: CryptoQuant
At press time, the crypto’s fear and greed index had a reading of 69%, meaning that the market was in a “greed” phase. Whenever the metric hits that level, it indicates that the chances of a price correction are high.
Read Bitcoin’s [BTC] Price Prediction 2024-25
Hence, we then checked BTC’s daily chart. We found that both its Money Flow Index (MFI) and Chaikin Money Flow (CMF) registered downticks, hinting at a price correction soon.
On the contrary, the MACD supported the buyers as it displayed a bullish upper hand.
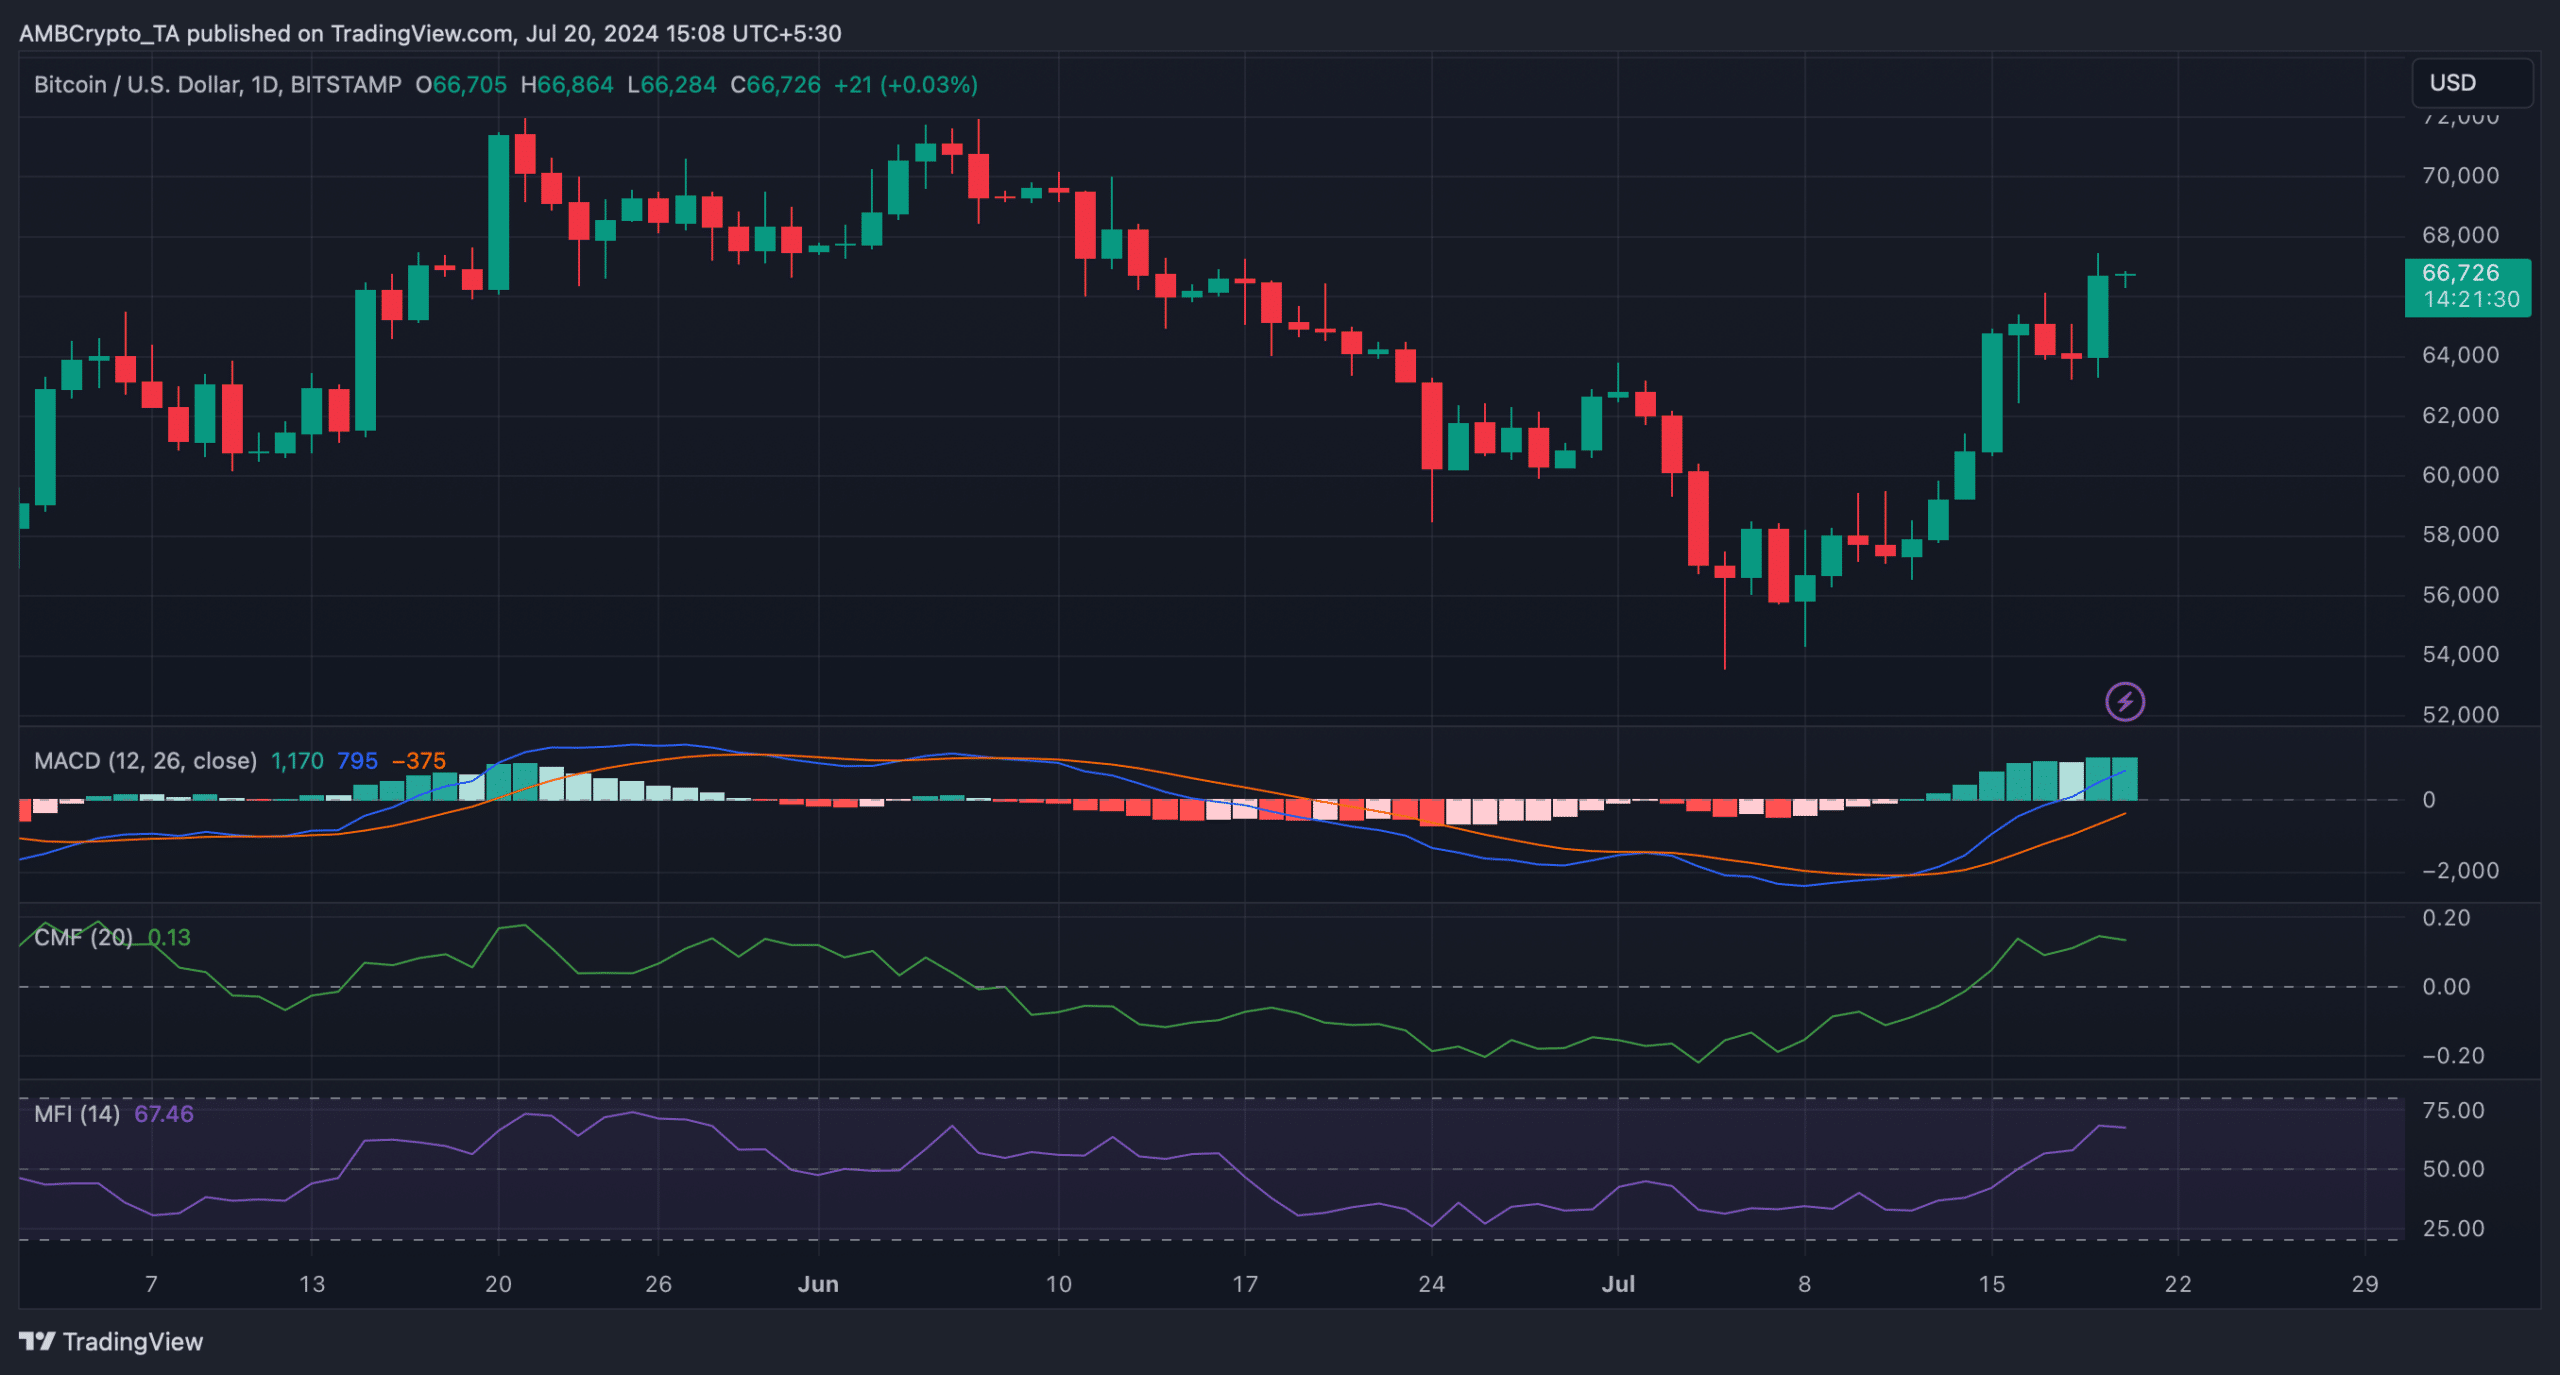
Source: TradingView


