Bitcoin: Transaction value surges despite…
Bitcoin recorded a decline in miner revenue between May and June despite seeing growth in on-chain transaction volume.

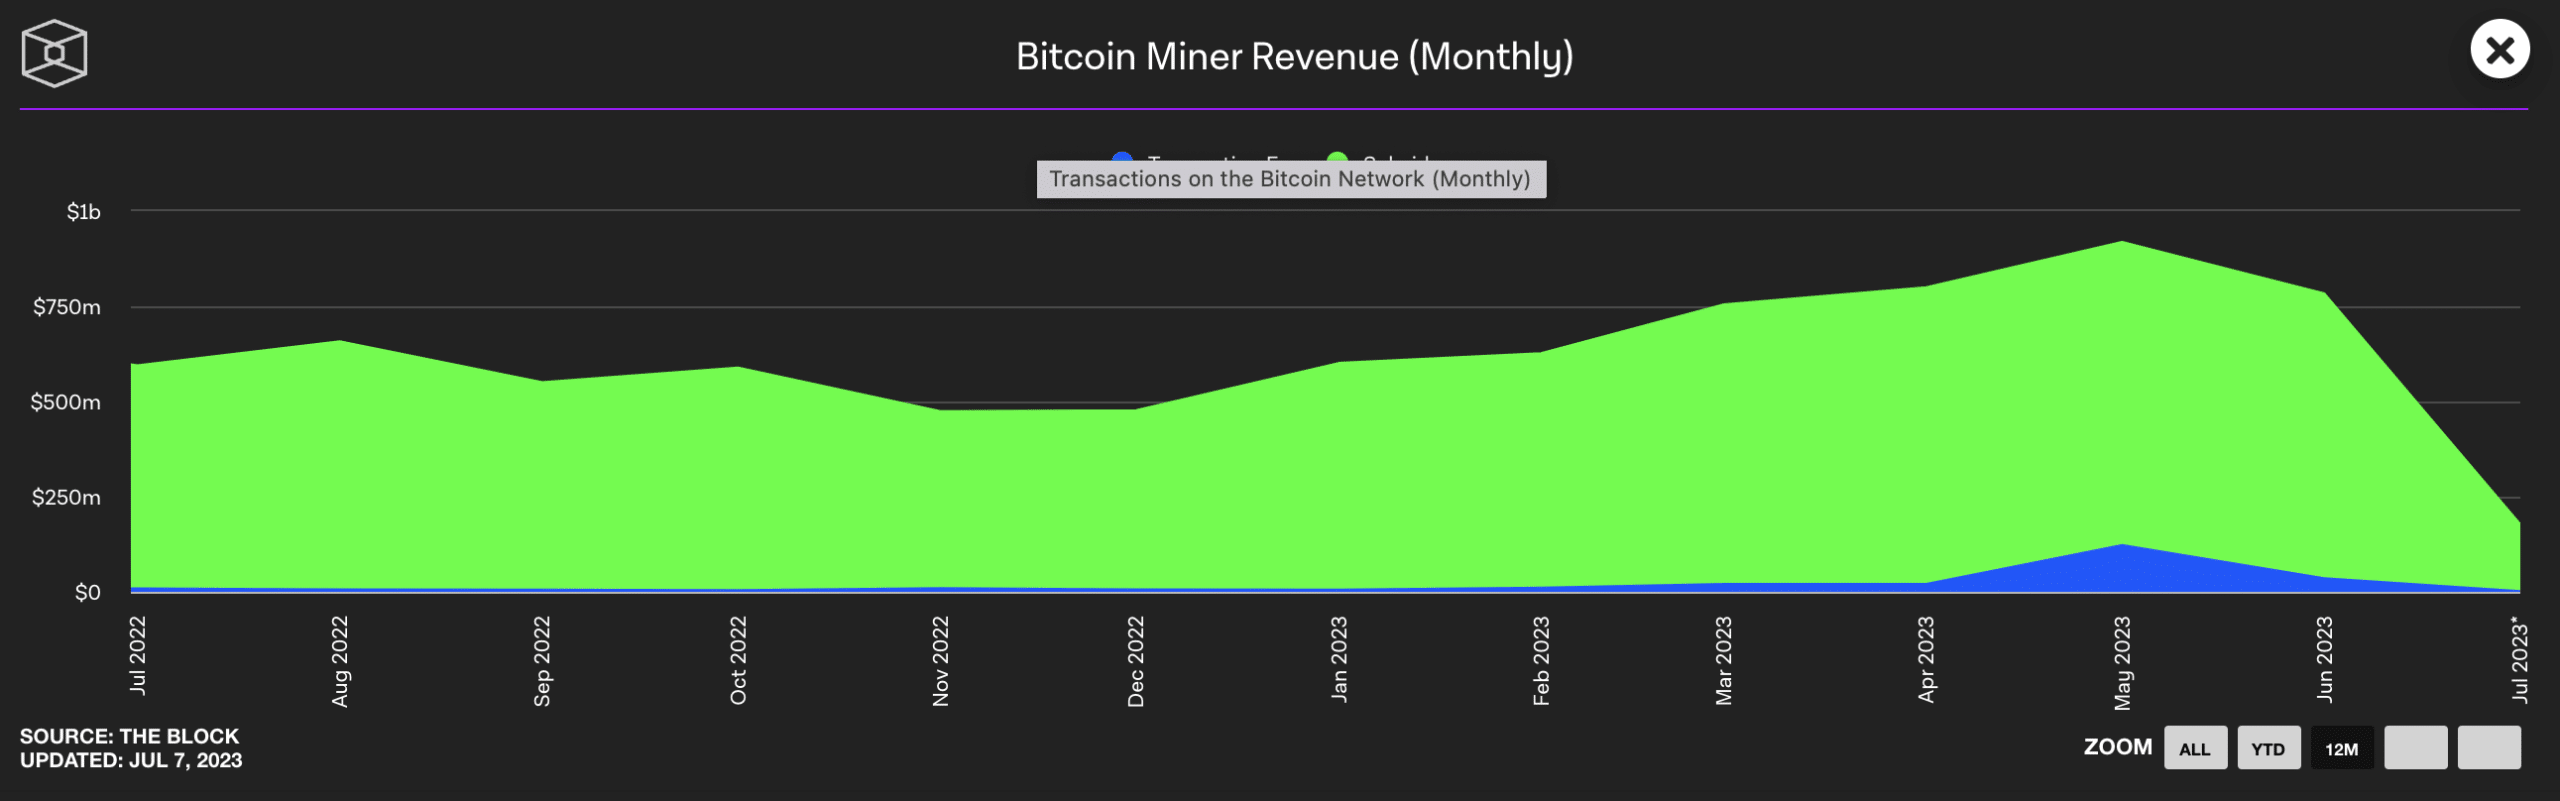
- Miner revenue on the Bitcoin network fell between May and June.
- As BTC traded in a narrow range, buying momentum withered.
Bitcoin [BTC] miner revenue has experienced a decline on a month-over-month basis, despite the network witnessing a significant increase in on-chain transaction volume, data from TheBlock revealed.
Read Bitcoin’s [BTC] Price Prediction 2023-24
Being a proof-of-work network, Bitcoin miners’ revenue is derived from two primary sources: inflation rewards (block subsidies) and transaction fees. When miners successfully add a new block, they are rewarded with a certain number of newly minted Bitcoins.
In addition to the block subsidy, miners also earn transaction fees, which are paid by users who initiate BTC transactions. According to information retrieved from TheBlock, Bitcoin’s block subsidy dropped by 6% between May and June.
During the same period, revenue earned by miners on the Bitcoin network from transaction fees paid to use the blockchain also declined by 15%. In the current month, miners have accumulated $173 million in revenue from inflation rewards, while their earnings from transaction fees over the past seven days have reached $177 million.
While miner revenue fell between May and June, BTC on-chain transaction volume rallied. Per data from TheBlock, this increased by 24% during that period.
Interestingly, while the total value of transactions conducted on the BTC network went up between May and June, BTC transactions count fell by 25%.
BTC remains tightly positioned
After breaching the $31,000 price point briefly on 23 June, BTC’s price has since traded within a narrow range, maintaining the psychological $30,000 price region as support. At press time, the number one cryptocurrency exchanged hands at $30,212.56, logging a 50% drop in trading volume in the last 24 hours, per data from CoinMarketCap.
An assessment of BTC’s price movements on a daily chart revealed that a new bear cycle was underway. On 6 July, the short-term moving average of BTC’s MACD indicator crossed below the long-term moving average, signaling a potential shift towards bearish momentum.
This occurrence is often interpreted as a sell signal by traders and investors. Thus, it indicated a potential downtrend in an asset’s price.
Is your portfolio green? Check out the Bitcoin Profit Calculator
Moreso, key momentum indicators trended downwards at press time and have been so since the beginning of the month. This showed that while BTC’s price lingers in a narrow price range, buying momentum has fallen.
Despite all this, buyers remained solidly in control of the BTC market. A look at the asset’s Directional Movement Index (DMI) showed the buyer’s strength (green) at 25.48, resting above the sellers’ (red) at 14.50.