Bitcoin transactions trail off after September surge
The month so far has seen a dip in Bitcoin's user activity. Amid this decline, the average transaction fee on the network continues to grow.

- Daily transaction count on the Bitcoin network has fallen to its lowest level since May.
- Despite the drop in user activity, the average transaction fee continues to climb.
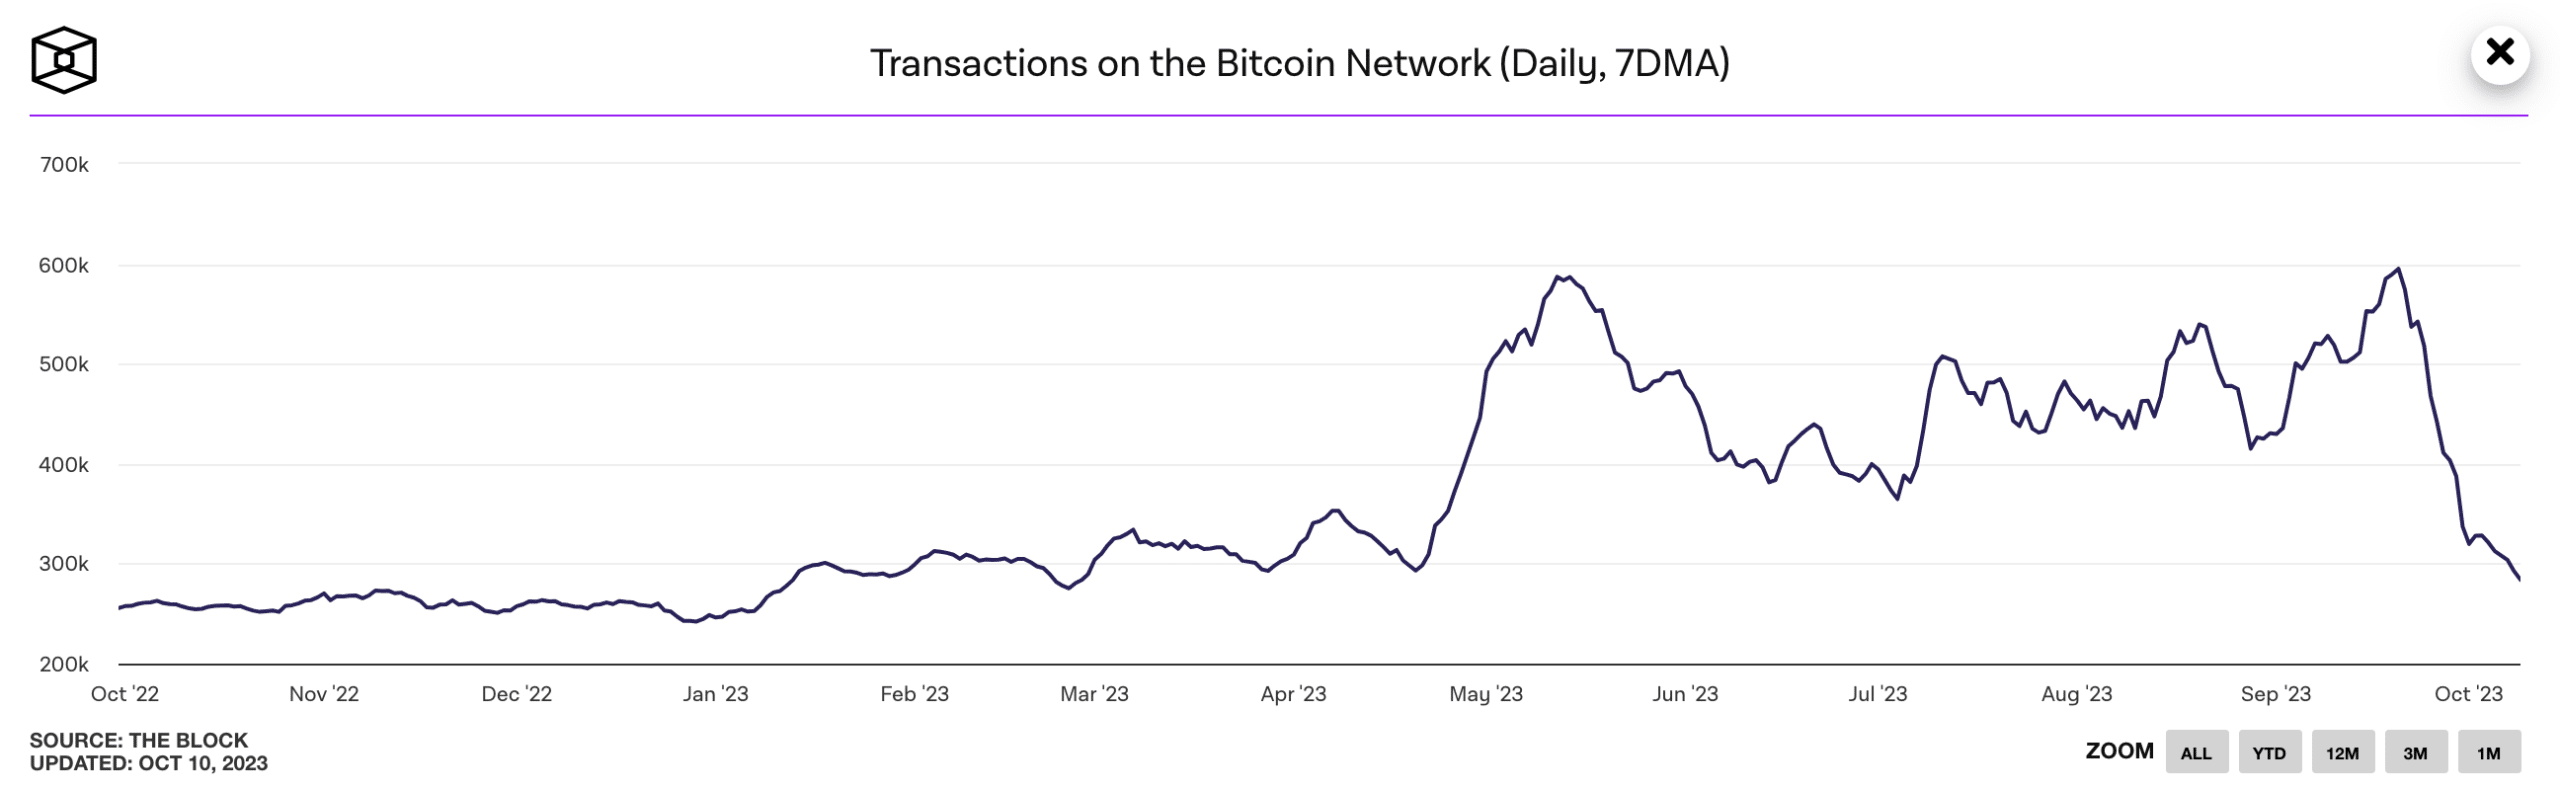
After a surge in September, the number of daily transactions on the Bitcoin [BTC] network has been on a downward trend since the start of October, according to information retrieved from The Block Data.
Read Bitcoin’s [BTC] Price Prediction 2023-2024
The daily transactions count on the network observed on a seven-day moving average showed that the average number of weekly transactions completed on the network ranged from 400,000 to 500,000 between May and mid-September.
By 20 September, the chain recorded a daily transactions count of 595,110, its highest since 16 May.
After attaining this peak, BTC began to see a steady decline in transaction count. As of 9 October, only 284,000 transactions were completed on the network. This represented a 52% drop from the 20 September peak and an 11% month-to-date (MTD) decline.
Some Ws and some Ls
An assessment of BTC’s on-chain performance since the month started revealed a general decline in user activity. In addition to a drop in the daily transaction count, the network has also seen a decrease in its number of active daily addresses since the month started.
This rallied steadily in September to reach a daily high of 1.11 million unique addresses on 15 September, its highest daily count in over a year.
However, this has since declined, and by 9 October, the chain recorded less than 950,000 active addresses.

Moreover, the number of unique addresses involved in first-time transactions involving BTC on the network has also witnessed a dip.
Information sourced from The Block Data showed that this also surged in September to peak at 648,000 new addresses on 19 September. It has since declined by 37%.
Is your portfolio green? Check the BTC Profit Calculator
A decline in a network’s daily active address signals less demand for its native coin, which can impact its price. Since BTC’s price rallied above $28,000 to briefly exchange hands at $28,400 on 2 October, it has since traded below $27,600, data from CoinMarketCap showed.
Interestingly, despite the waning user activity on the network, the average transaction fee has risen steadily since the month began. At $2.83 as of this writing, the average cost of executing transactions on the BTC network has increased by 19% since 30 September.


