
- Bitcoin price recorded its lowest weekly close in four months.
- Markets ushered in more volatility this week with several catalysts lined up, including the U.S. CPI and PPI data release.
Bitcoin [BTC] led altcoins in a heavy downtrend for the better part of last week, weighed down by sell-side pressure induced by the Mt. Gox repayments and BTC sales by Germany.
The flagship crypto took a break from the downtrend on the 6th of July, rising as high as $58,472 from an intraday low of $53,717 on the 5th of July before ultimately resuming losses on the 7th of July.
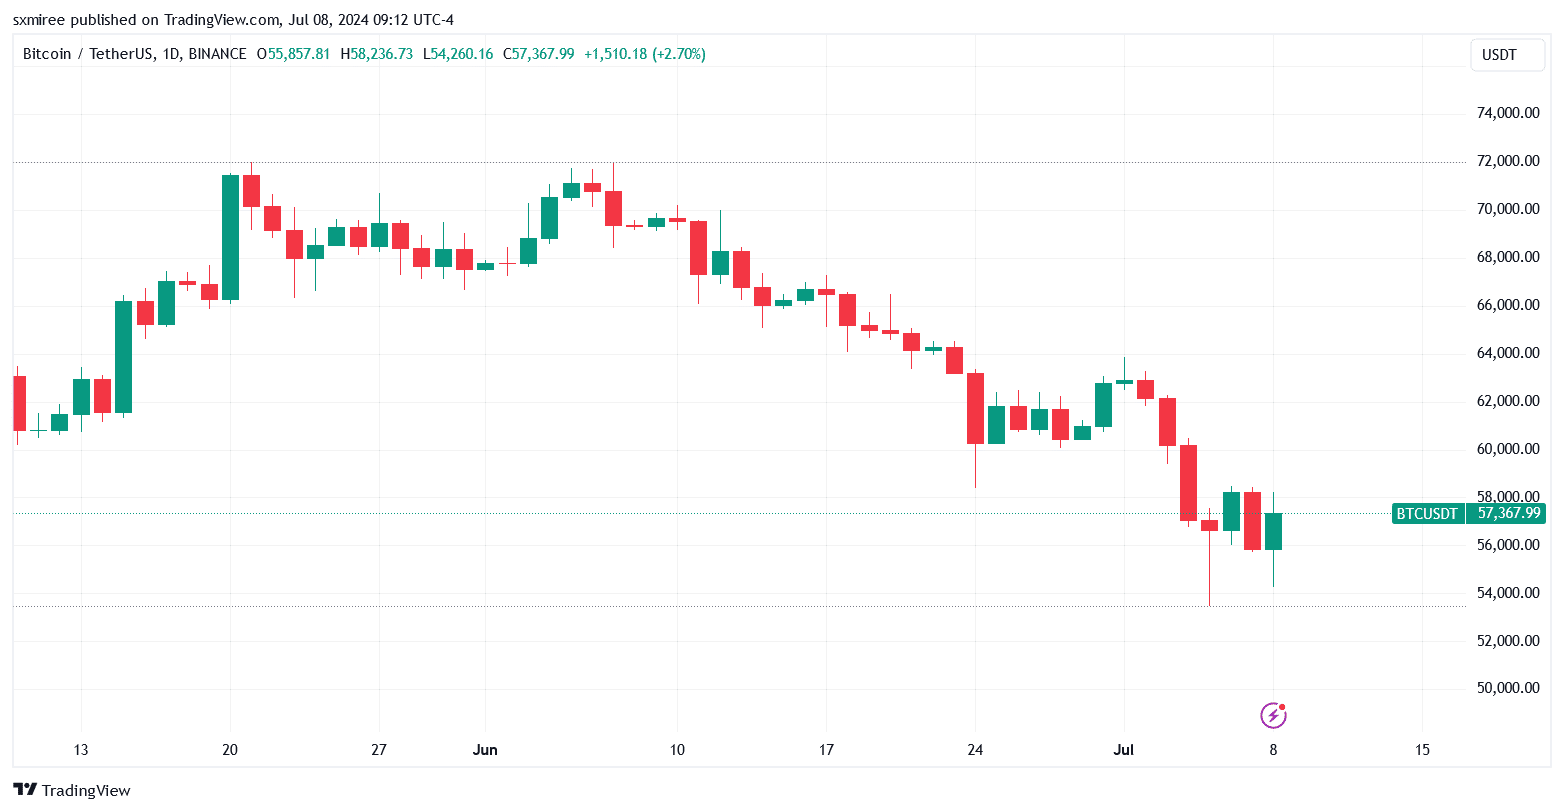
Source: TradingView
Reports of continued BTC dumping by Germany slowed Bitcoin’s positive action on the 8th of July as well.
Bitcoin technical analysis
Double top formation and moving averages
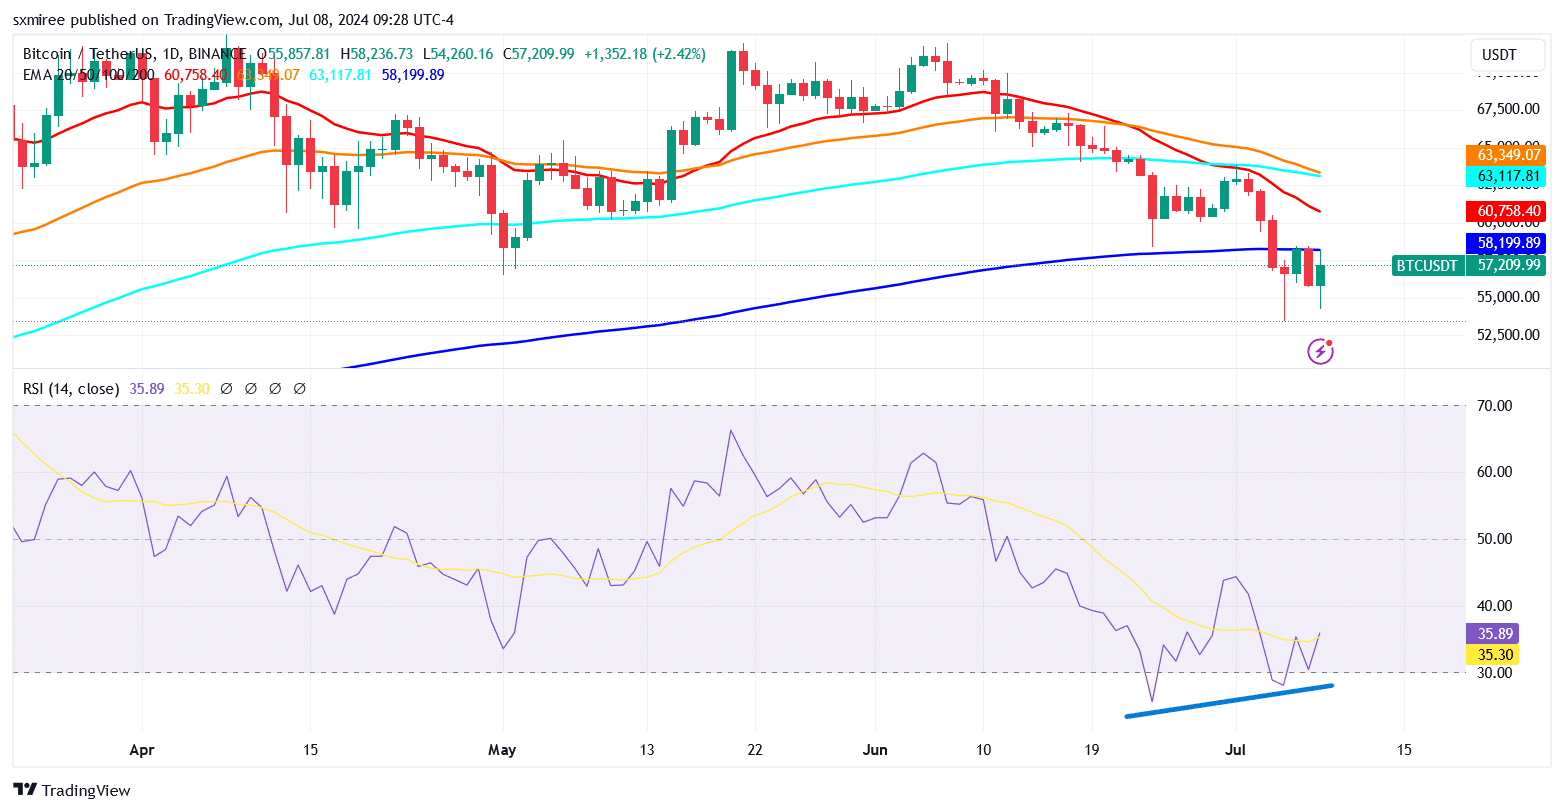
Bitcoin’s extended declines have brought into focus a double-top setup on the daily chart.
The formation of a double top generally implies a bearish reversal, signaling that the asset’s price is likely to decline after failed attempts to break above a major resistance level.
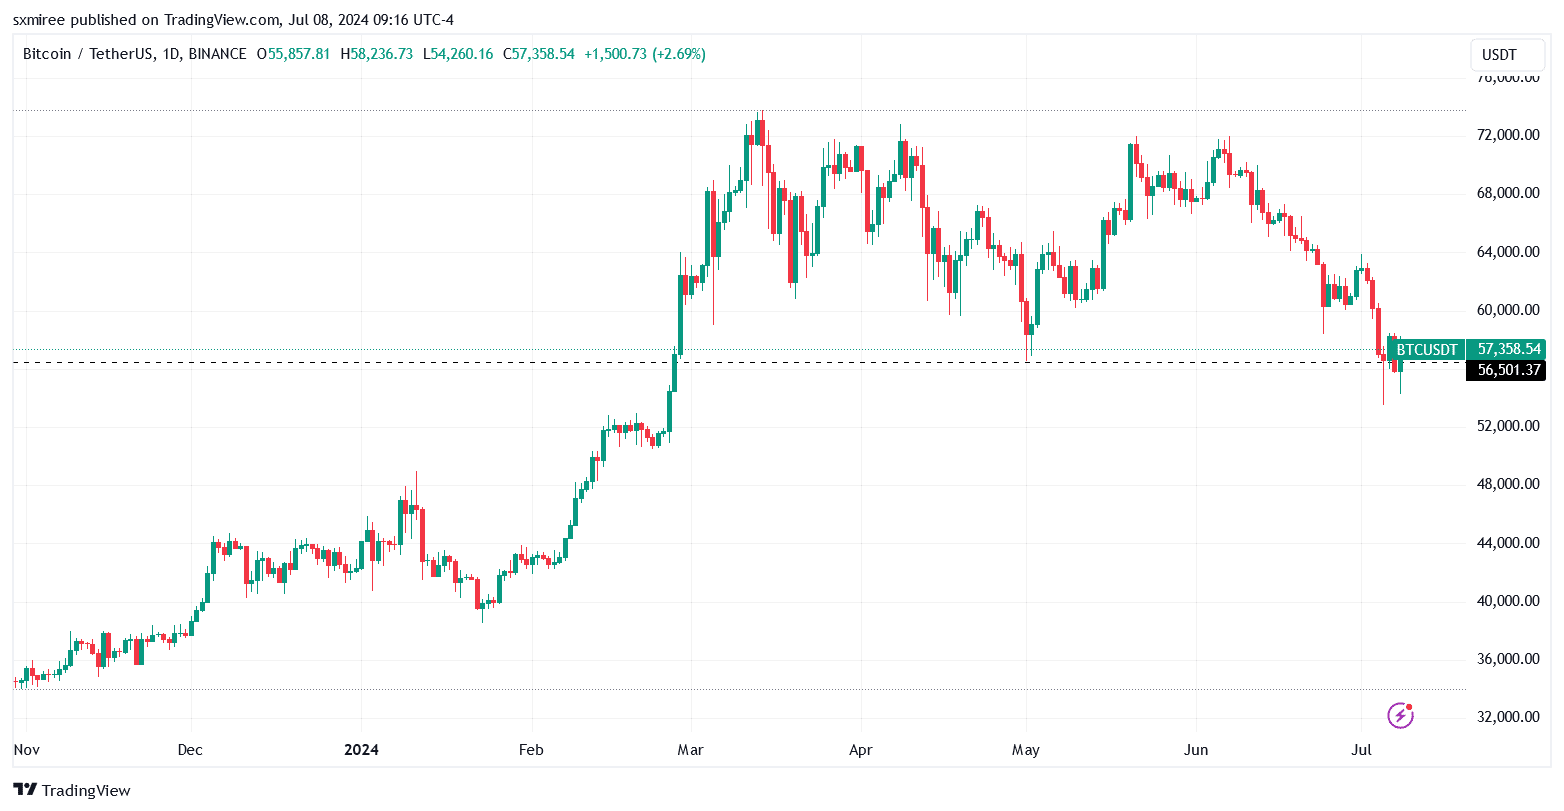
Source: TradingView
The price slump ahead of the weekly close confirmed a breakdown out of multi-month consolidation.
On the weekly chart, Bitcoin closed below the lower Bollinger Band, hinting at the possibility of lower price targets.
Prices moving outside the bands typically indicate strong trends, whereas contraction suggests low volatility and potential upcoming breakouts.
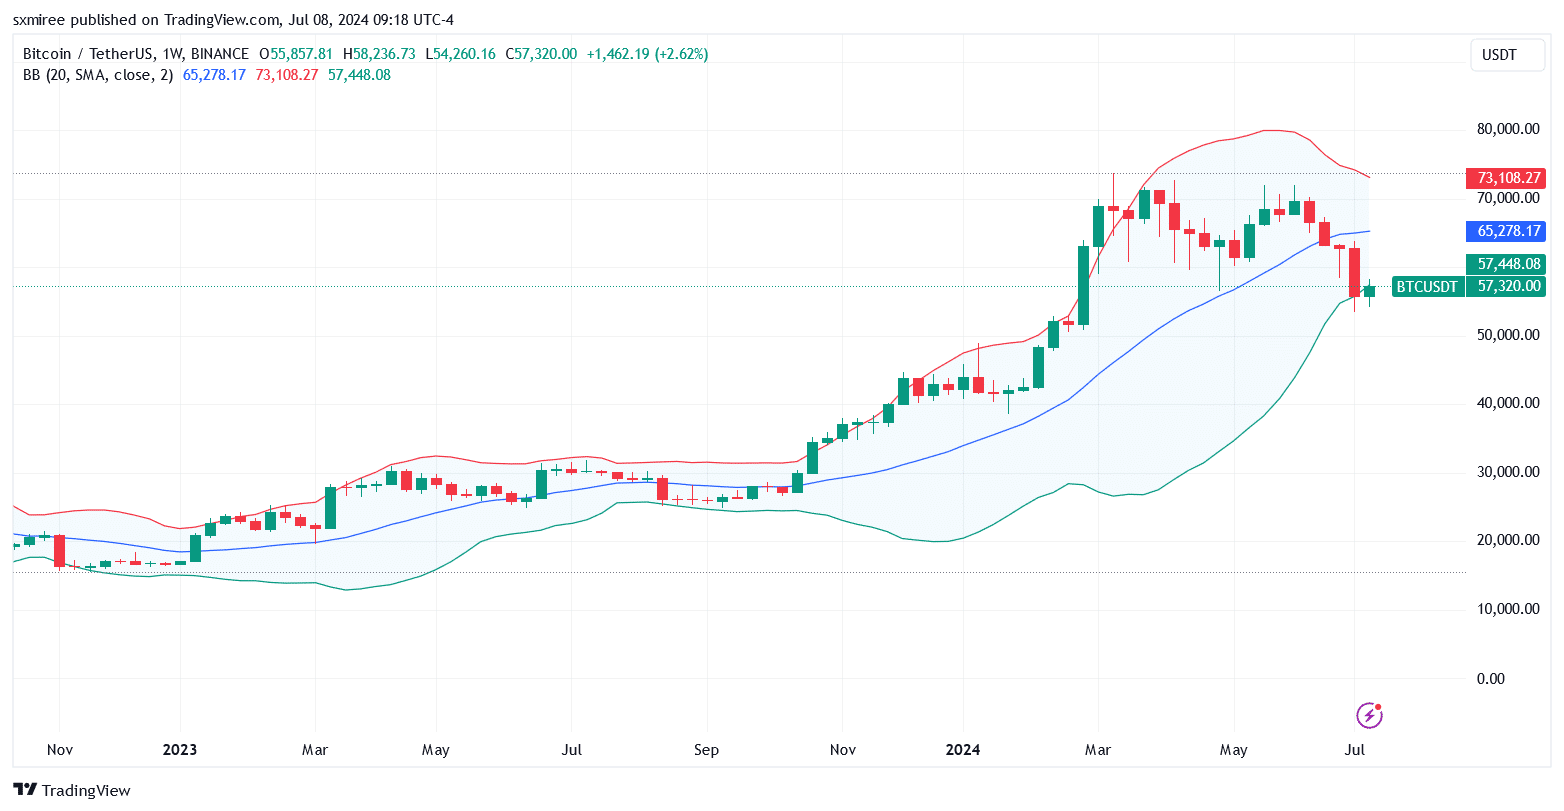
Source: TradingView
Markedly, at press time, Bitcoin was trading below the 50-, 100 and 200-day exponential moving averages (EMA) on the 4-hour chart, to the advantage of bearish speculators.
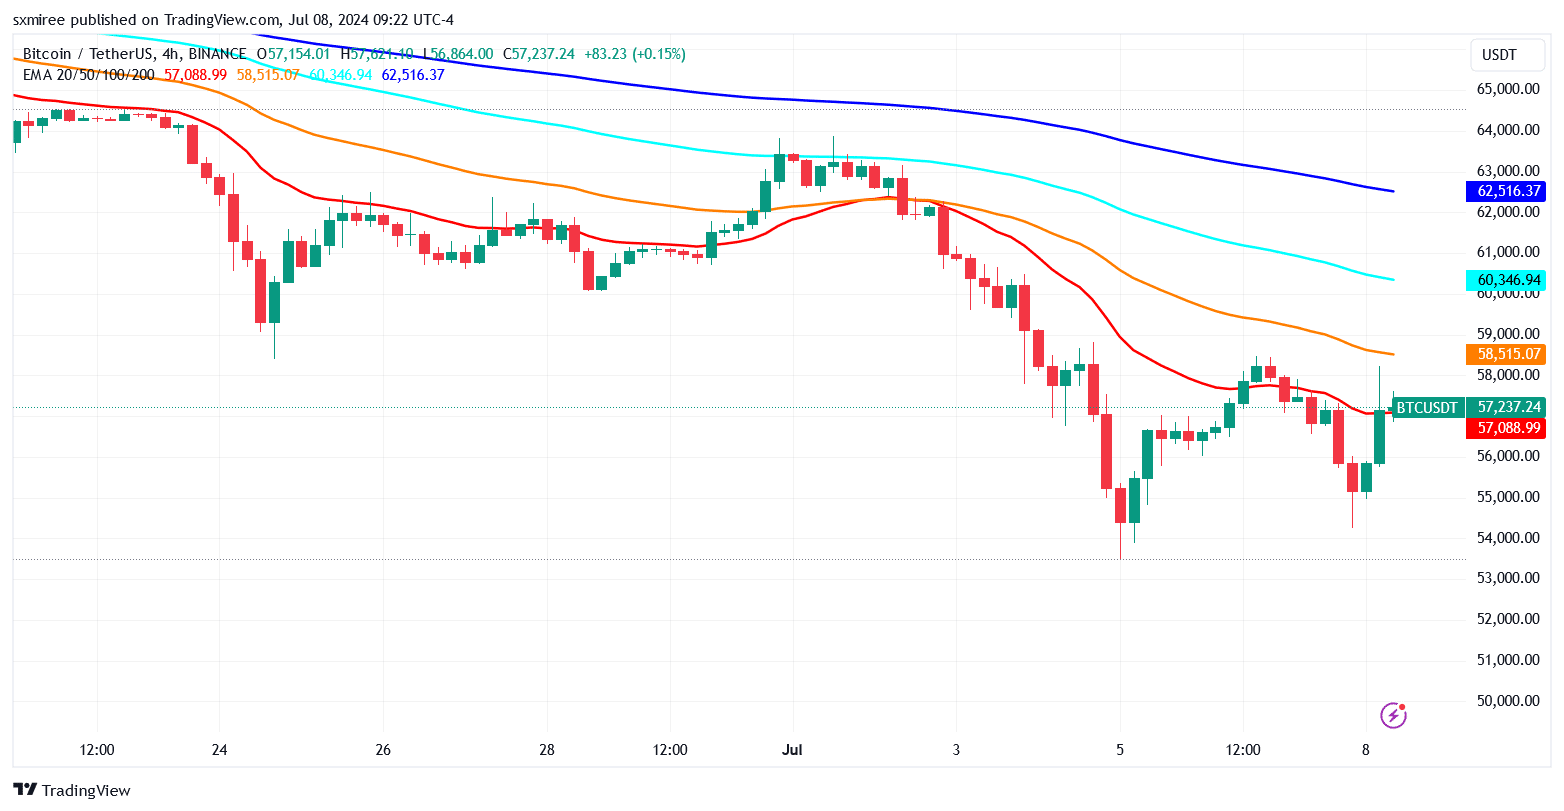
Source: TradingView
To manage the correction, bulls will need to push the price above the flattening 20-day EMA on the 4-hr chart.
Positive divergence on the daily RSI
Bitcoin’s Relative Strength Index hovered below 30 on the daily chart between the 4th and the 5th of July, marking the second time the RSI dropped into oversold territory in less than three weeks.
Source: TradingView
The RSI readings on daily time frames also confirmed a daily bullish divergence, suggesting that despite BTC’s price moving lower, the downward momentum could be slowing down.
Historically, a daily bullish divergence has mostly been in the company of trade setups near bottoms. The daily RSI stood at 36.04 at the time of writing.
Macro narratives
Macroeconomic data in the form of the U.S. Consumer Price Index (CPI) and Producer Price Index (PPI) prints expected this week is expected to test the resolve of crypto traders.
Analysts at Citi Research on Sunday forecasted that the Fed could slash rates by 200 basis points over eight straight meetings from September through July 2025.
The rate cuts extending to summer will lower the benchmark to 3.25%- 3.5% range.
Lower interest rates are generally bullish for riskier assets like cryptocurrencies because they reduce the cost of borrowing and increase liquidity, encouraging investors to seek higher returns in alternative instruments like cryptocurrencies.
The U.S. M2 money supply, which measures the total money in circulation, including cash, checking, and savings deposits, has been swelling.
In the most recent release on the 25th of June, the U.S. M2 money stock stood at 20.96T, up from 20.87T on the 28th of May (for April) and 20.84T on the 23rd of April (for March).
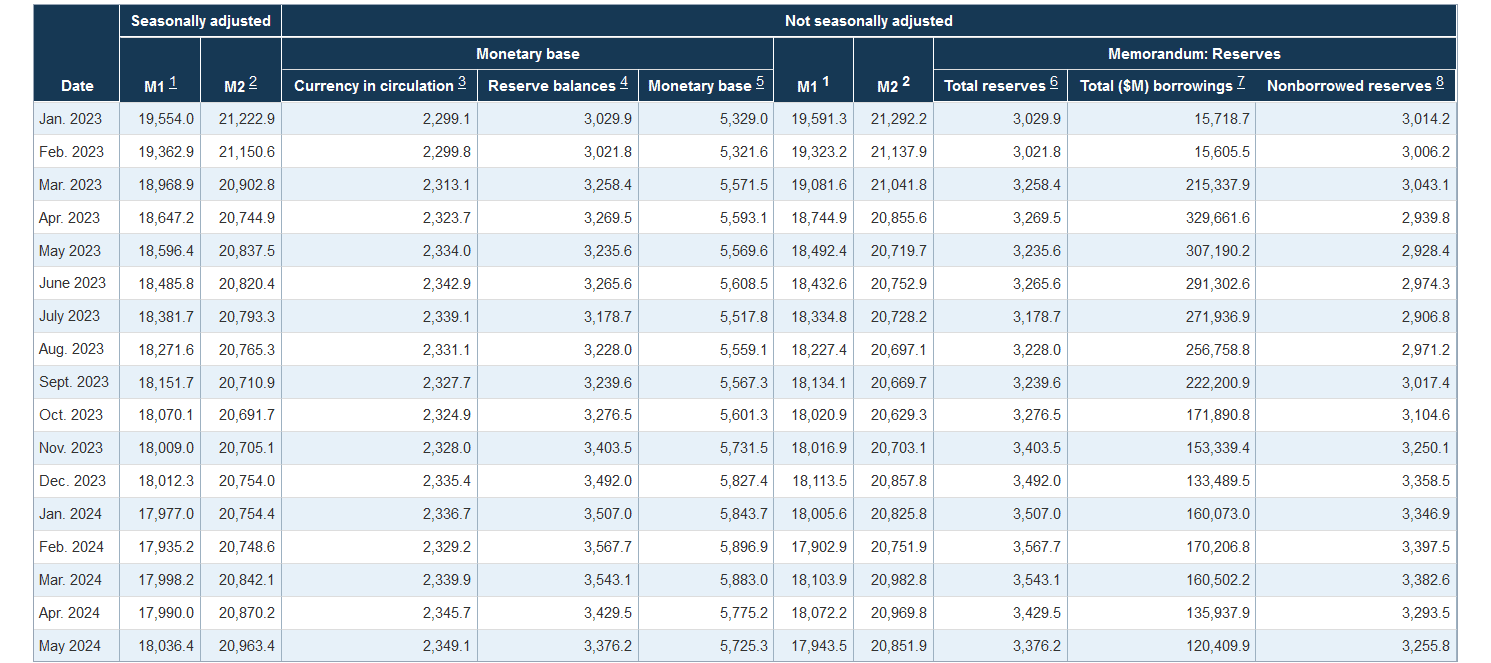
Source: Federal Reserve
A growing M2 supply indicated increased liquidity, which can lead to higher inflation and drive investors toward alternative assets like cryptocurrencies, potentially boosting crypto prices.
Miner capitulation signals a potential market bottom
Bitcoin network hash rate (SMA 7-day) dropped across June from a peak of 656 EH/s on the 27th of May to a four-month low of 556 EH/s on the 30th of June.
A lower hash rate, the total combined computational power used to mine and process transactions, often reflects miners shutting down due to reduced profitability.
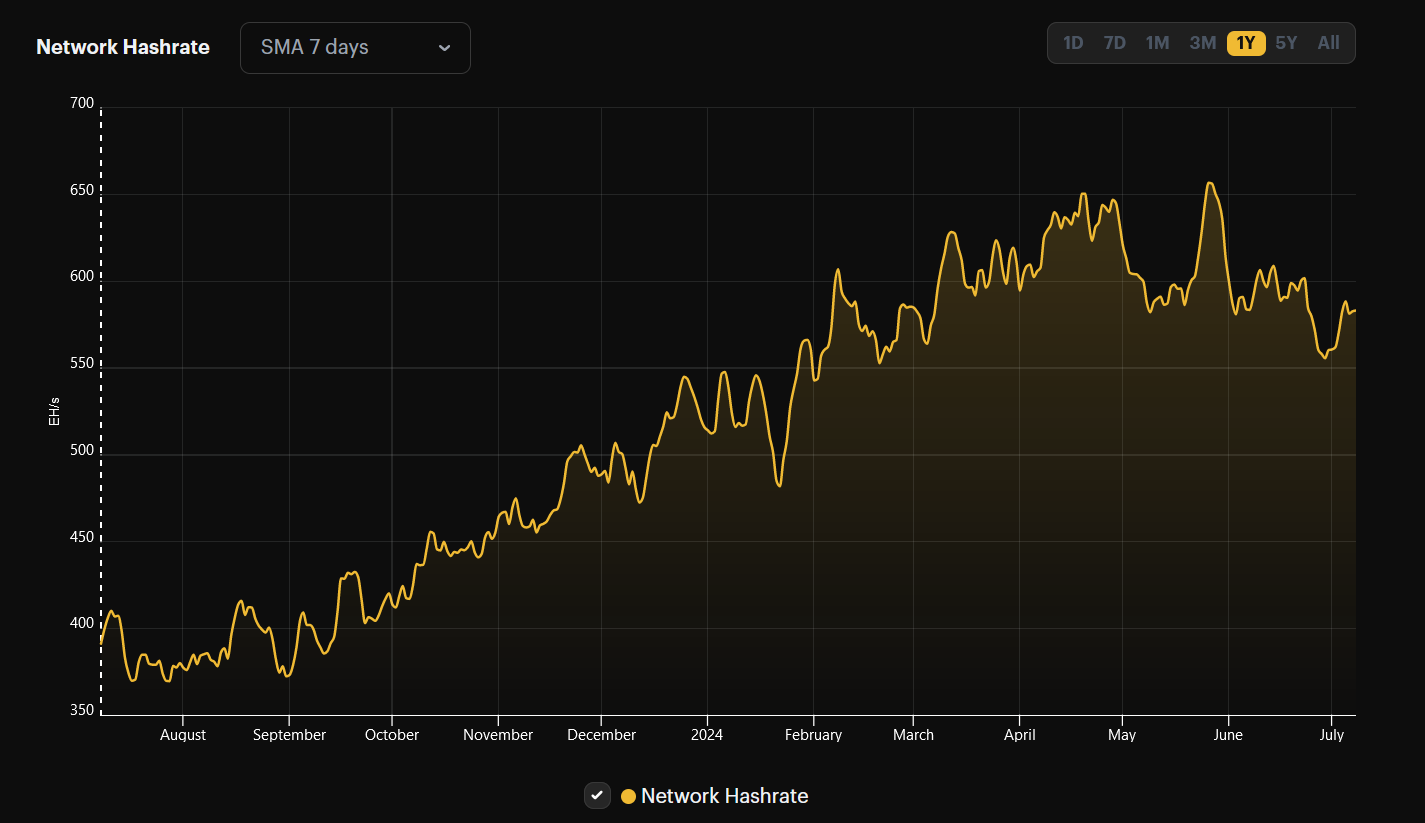
Source: Hashrate Index
Read Bitcoin’s [BTC] Price Prediction 2024-2025
The continuous decline in hash rate thus suggested that some miners could be scaling back operations.
Miner sell-offs and operational reductions have signaled in the past that prices are near a cyclical low and might soon recover.