Bitcoin, Uniswap and Chainlink Price Analysis: 09 August

Bitcoin’s rejection of the $45,000 mark also dragged the industry’s altcoins down. The likes of UNI and LINK logged considerable daily losses. UNI broke below its support line of $26 while LINK inched closer to its crucial support line of $21.54.
Bitcoin (BTC)
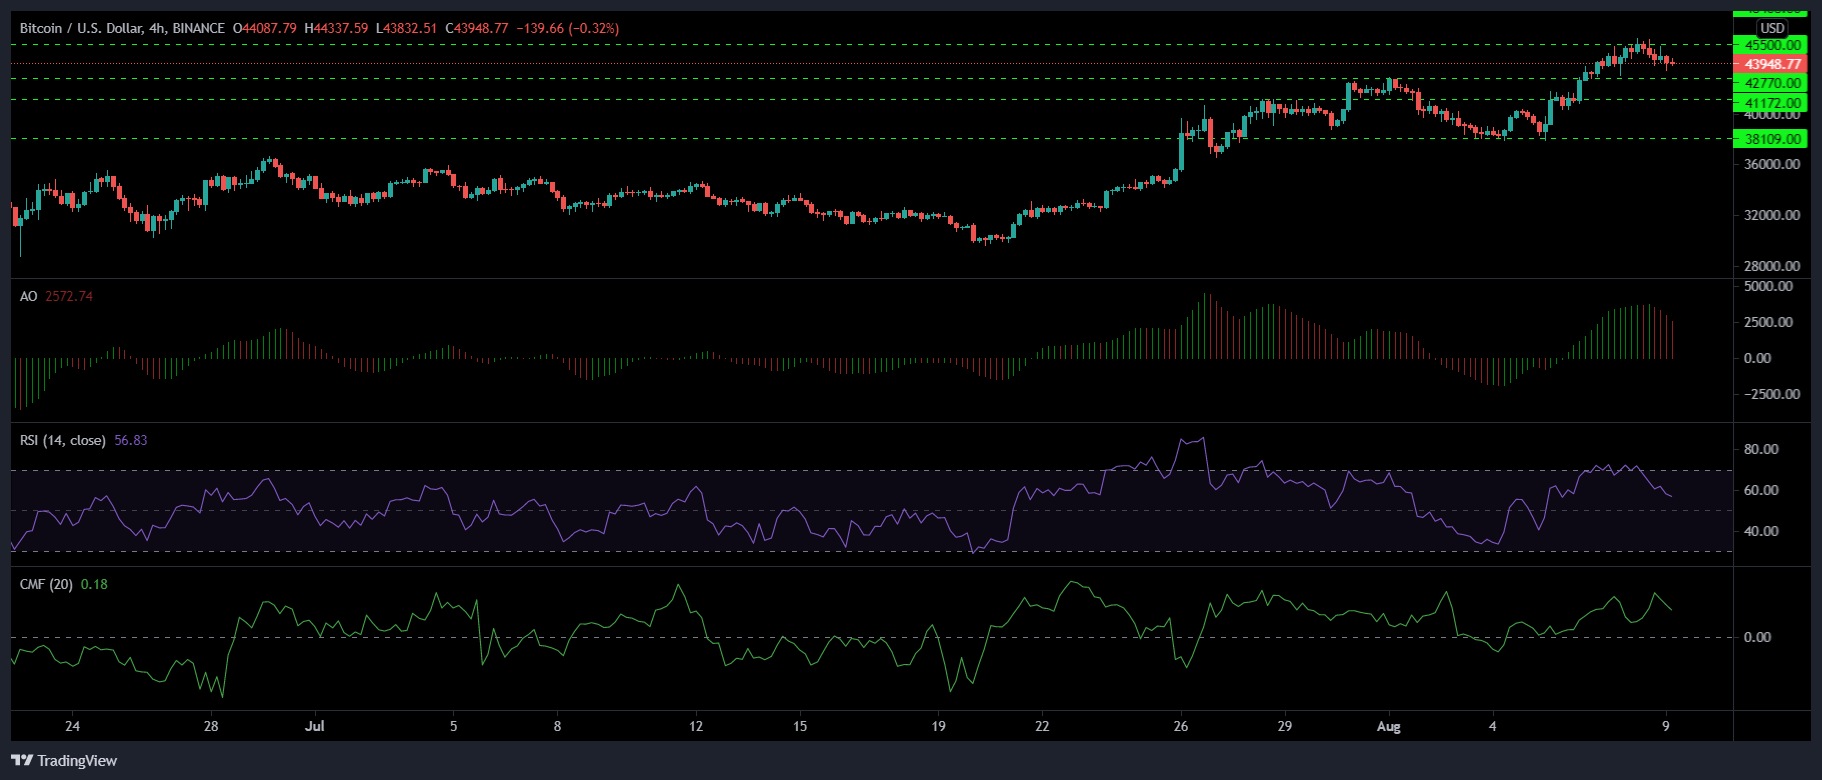
Bitcoin’s press time value stood at $43,948 as it retraced after facing resistance at $45,500. Over the last 24 hours, the crypto asset dipped by 3.8%, the immediate support line for the coin is at $42,770.
Technicals pointed toward a decline in buying pressure, substantiated by the drop from the overbought zone on the Relative Strength Index, however, the indicator was still in the bullish territory. Awesome Oscillator flashed red signal bars implying bearish strength and a decrease in buying pressure.
Lastly, Chaikin Money Flow also noted a fall in capital inflows over outflows at press time but still remained above half-line.
Uniswap (UNI)
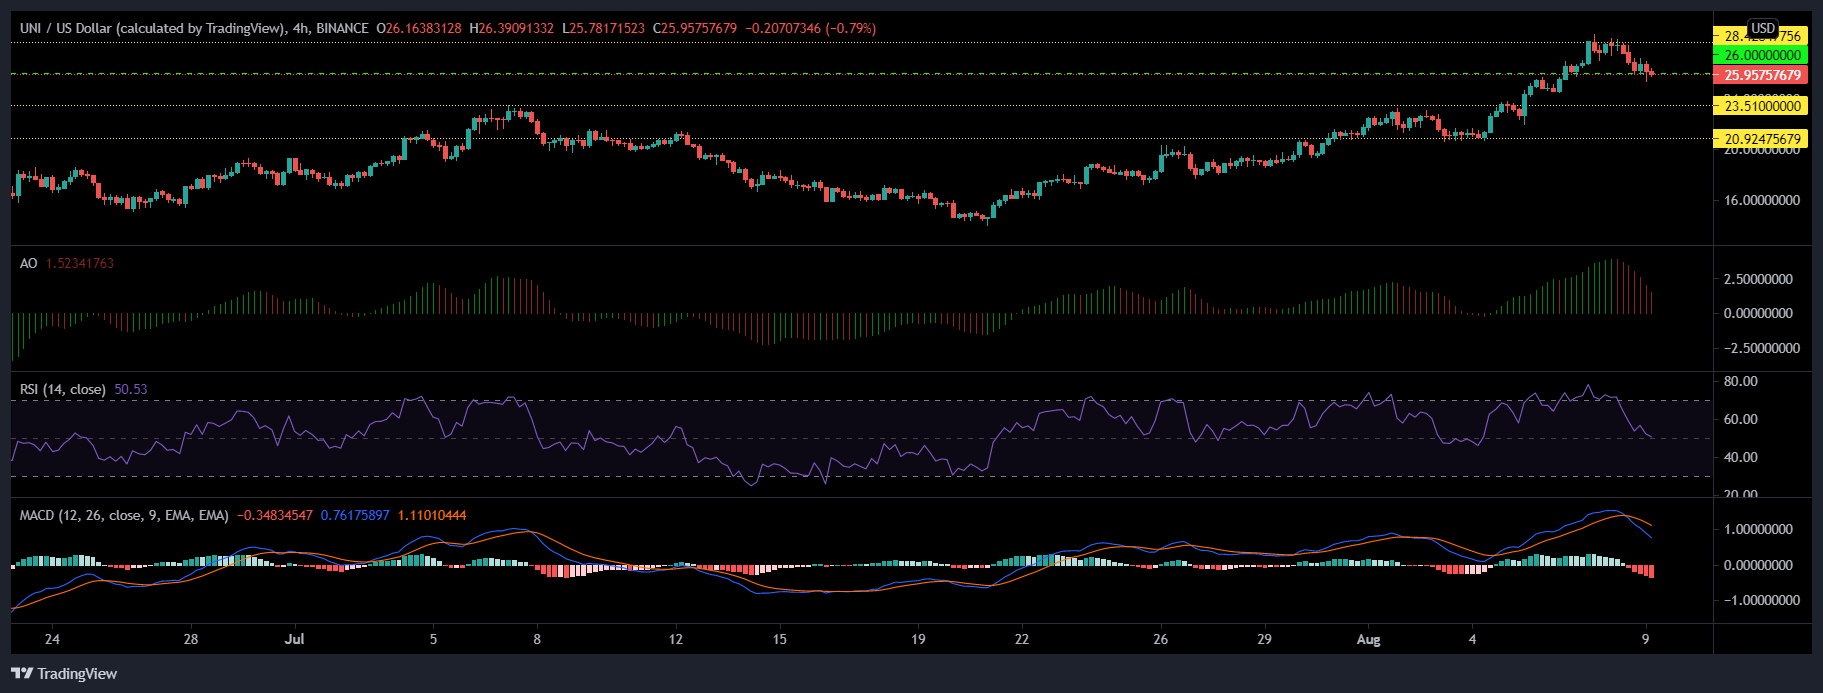
UNI saw an 8.6% decline in prices over the last 24 hours. At the time of writing, UNI traded for $25.95 as it breached its $26 support line. The immediate support level for UNI lay at $23.51 and subsequently in $20.92.
Awesome Oscillator emanated increased bearish strength, which even the MACD indicator corresponded to, as red histograms grew in size. Relative Strength Index traded at the half-line, but pointed south as sellers were on top.
In case of a price reversal, which seemed unlikely over immediate trading sessions, UNI would again try to test the $28.42 resistance level.
Chainlink (LINK)
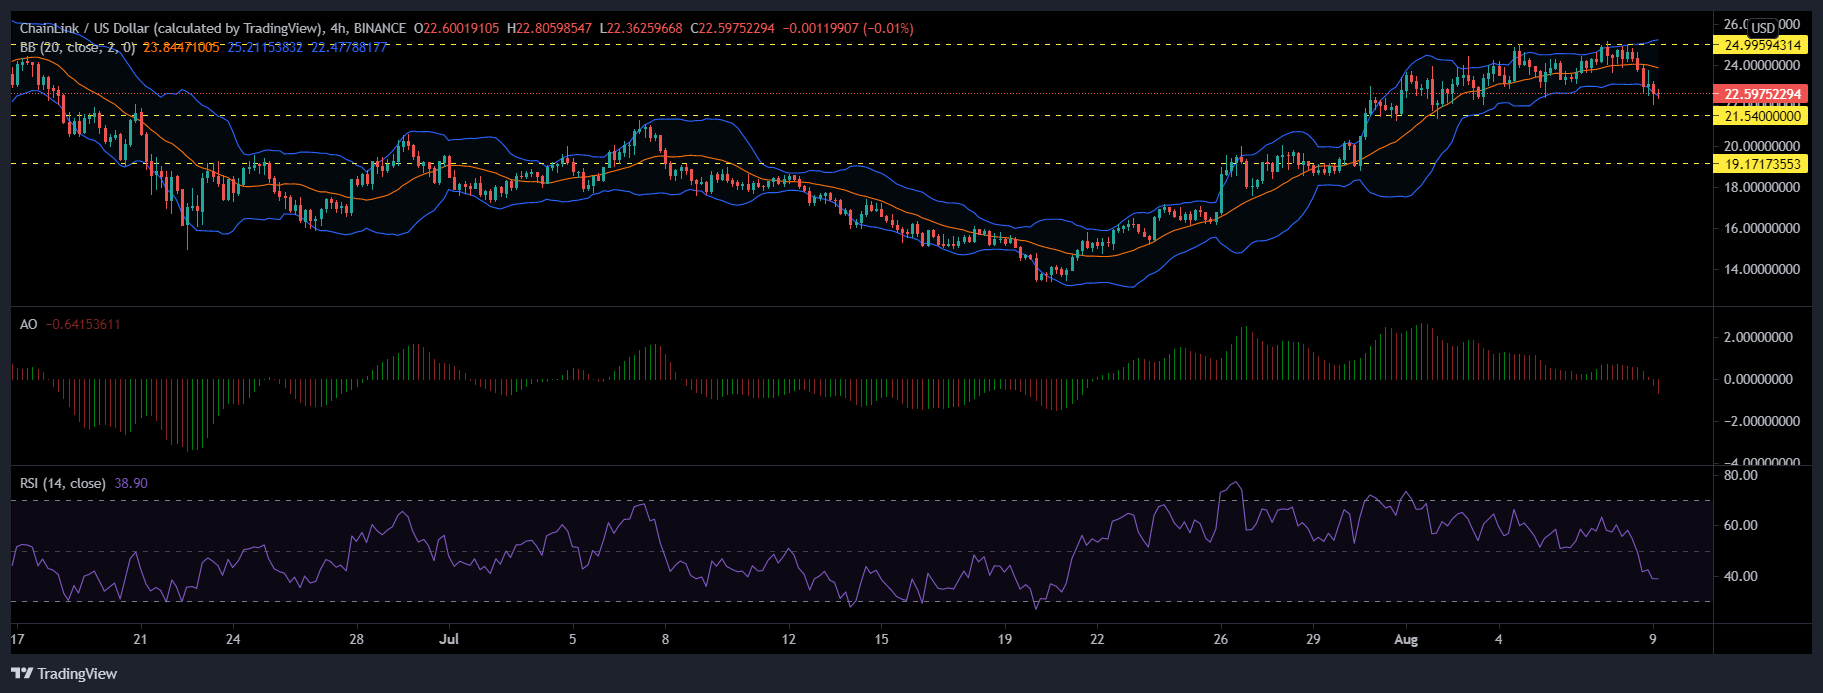
LINK descended on the charts by 8.5% over the last 24 hours, it rejected its crucial resistance level of $24.99, twice over the last few days and was finally trading at $22.59.
LINK could, over the next trading sessions, rest on its support level of $21.54. It is vital for LINK to hold itself on the $21.54 support level in order to avoid touching the lows of the $19.17 support region.
Bearish strength shot up as pictured on the Awesome Oscillator, the red bars appeared below the midline. Relative Strength Index dove into the bearish zone, as it was seen near the 40-mark implying decreased buying strength.
Bollinger Bands opened up and underlined chances of incoming market volatility and additional losses.


