Bitcoin: Unraveling the breakout potential and how investors can capitalize on it

After the bears found a renewed selling pressure at the $47.5K level in late March, the last two months have been a constant strive to breach the chains of Bitcoin’s [BTC] 20 EMA (red).
While the near-term trajectory revealed a sideways market, BTC HODLers were visibly keen on defending the 16-month floor at $28.8K.
Given the confluence of hurdles at the $30.8K-level, BTC could continue its sluggish tight phase. Should any factors worsen the sentiment, a close below the current pattern would provide a shorting opportunity.
At press time, BTC was trading at $30,526, up by 5.18% in the last 24 hours.
BTC Daily Chart
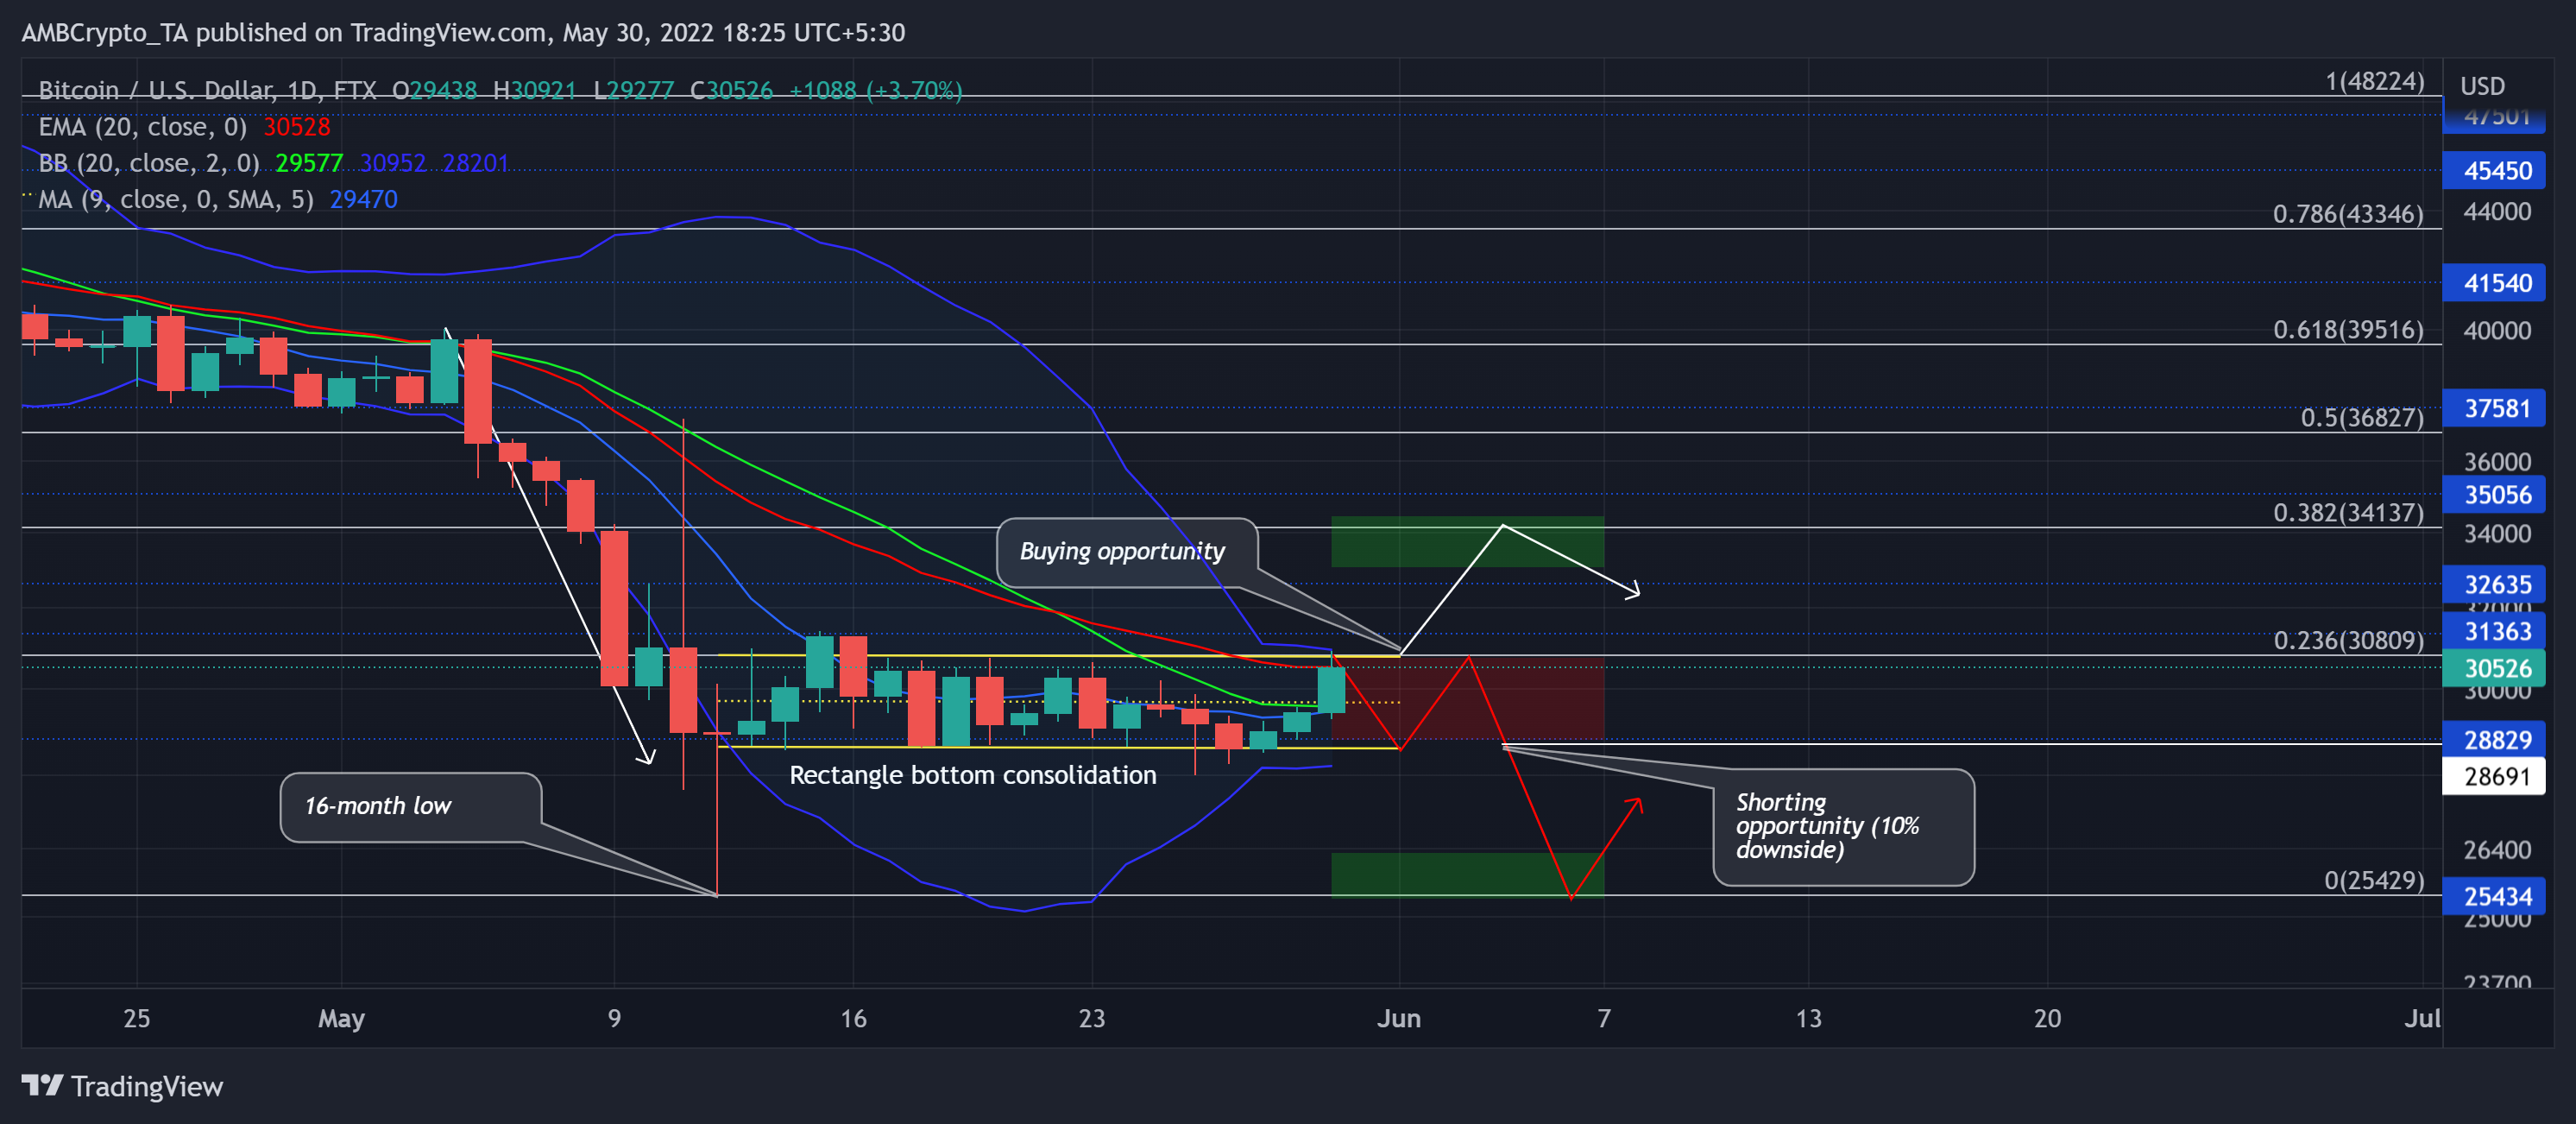
From a slightly conservative standpoint stemming from the long-term bearish trend, BTC could see a continued tight phase in the $28.8K-$30.8K range in the coming sessions.
For the last three weeks, the king coin has formed a rectangle bottom on its daily chart as well as lower timeframes. Due to this, the Bollinger Bands (BB) entered a squeeze phase.
As the upper band of BB coincided with the 23.6% Fibonacci level alongside the 20 EMA, the $30.8K-level represented a host of resistances. Meanwhile, the price action hovered near the ‘expensive’ side of the BB.
Any close below the rectangle would make room for a shorting opportunity. In this case, the take-profit levels would lie in the $25K-$26K range.
However, in a relatively unlikely case of a bearish invalidation, a close above the pattern would open a 10% upside possibility. With the price closing in above the basis line of BB, the buying pressure saw a decent spike over the last 24 hours.
Rationale
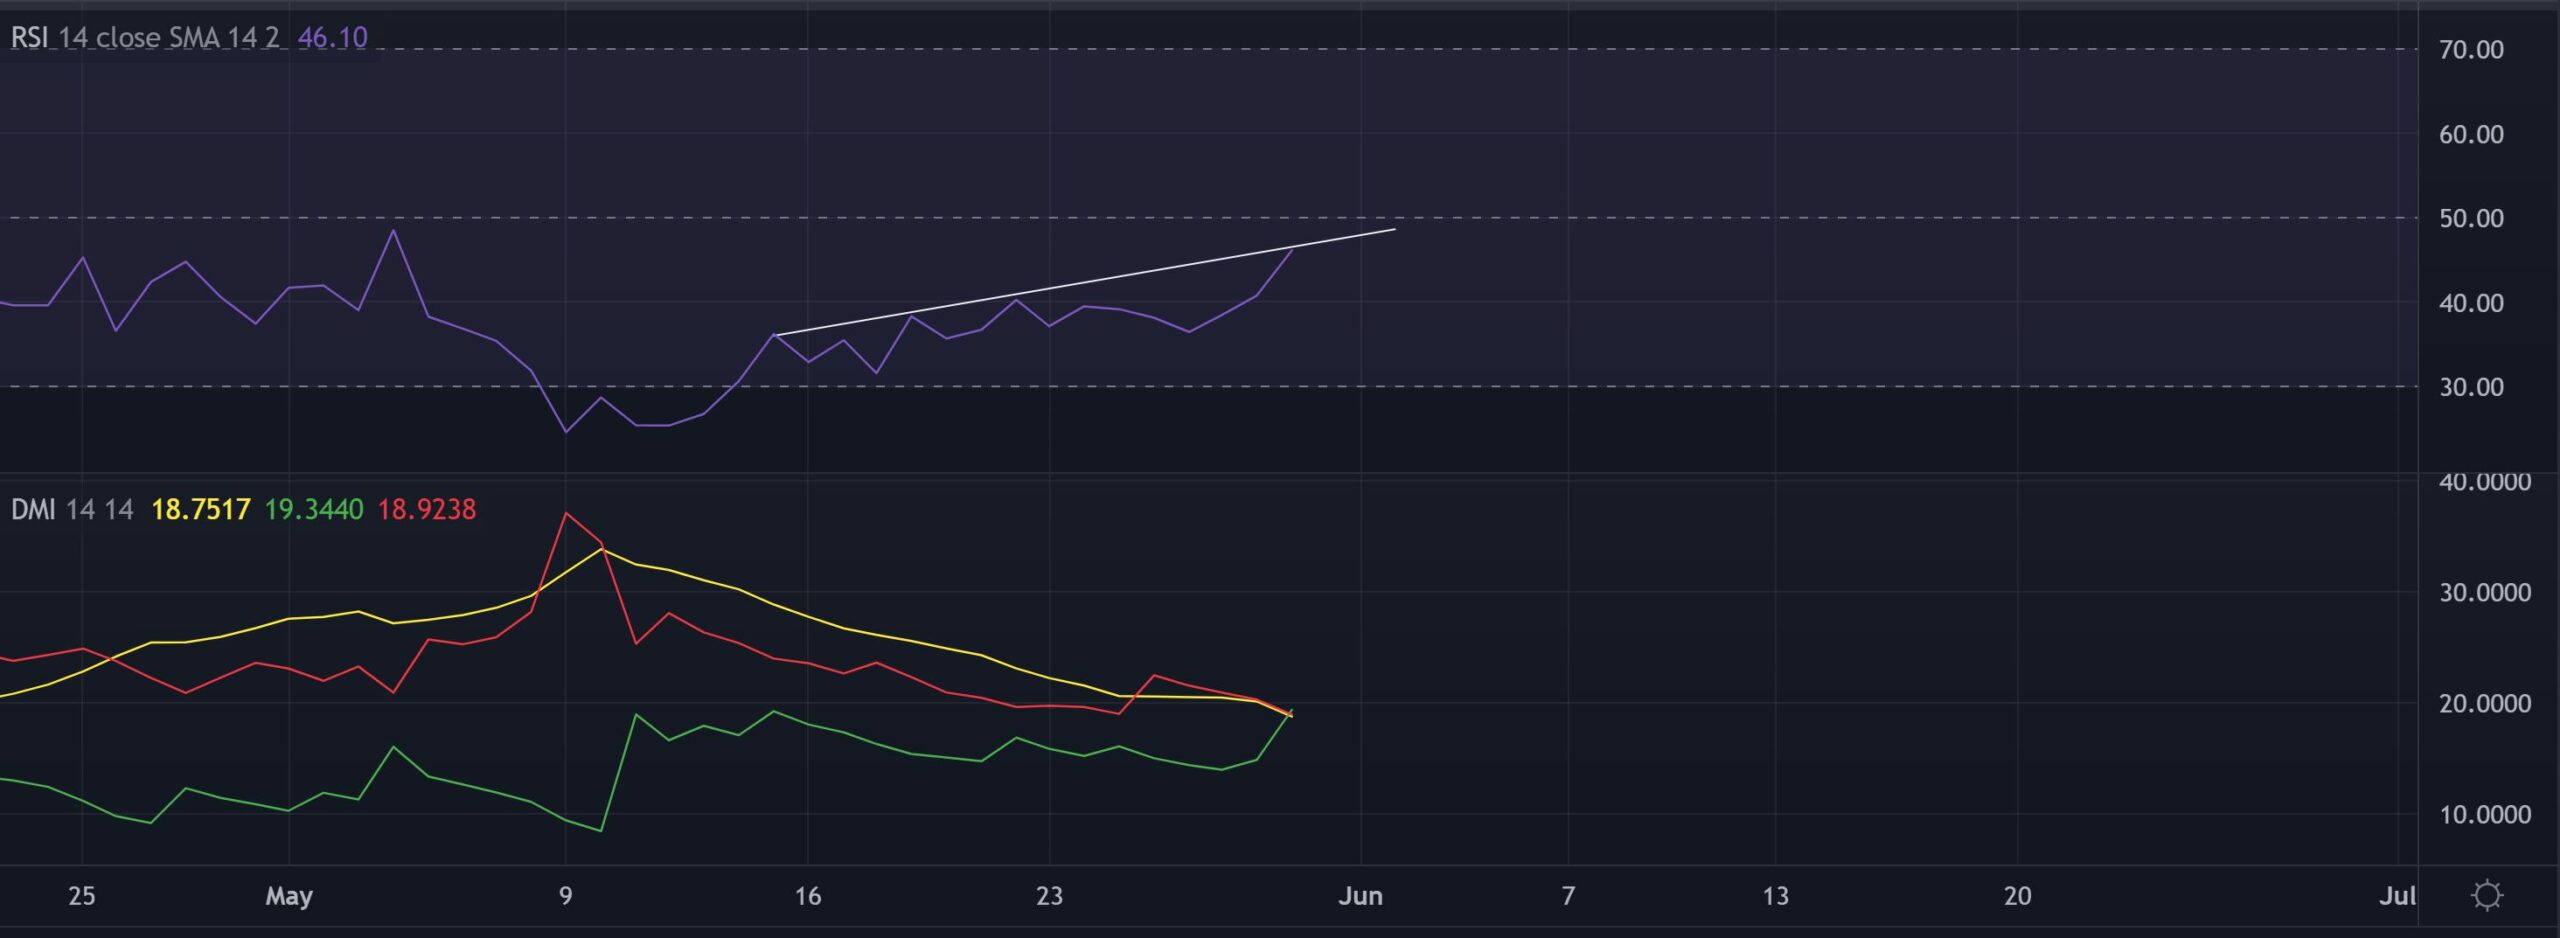
The daily Relative Strength Index (RSI) was yet to cross the equilibrium and claim a bullish edge on the daily timeframe. But won the four-hour timeframe, the RSI projected overbought readings. Thus, increasing the chances of a near-term pullback from the 23.6% level on the chart.
Despite the +DI barely crossing over the -DI, BTC’s directional trend [ADX] seemed pretty weak.
Conclusion
The bears still kept the broader trend under their control. Looking at the current barriers in the $30.8-level, BTC’s bears can reinforce the coin’s consolidation tendencies.
A close below the rectangle bottom could provide a 10% downside shorting opportunity.
Should the sentiment improve enough for the buyers to recoup, the investors/traders must watch out for a close above the pattern to capitalize on short-term gains toward the 38.2% level.