Bitcoin wallets shift to ‘buy mode’ – Is a bullish reversal imminent?
Bitcoin’s accumulation trend strengthens as whales and retail investors position for a potential bullish breakout.

- Bitcoin faced resistance at $106K, with RSI near overbought and OBV showing stalled buying pressure.
- Dense long positions between $101K-$106K could trigger liquidations if BTC drops below key support.
Bitcoin [BTC] is showing signs of a potential shift, as recent data highlights a notable increase in long positions clustered between the $101K-$106K range.
Although a price retracement could trigger liquidations, on-chain indicators reveal fresh accumulation from retail investors and large holders.
This growing confidence suggests the market may be entering the early stages of a bullish reversal.
Bitcoin wallets enter buy mode
Recent data from Glassnode revealed a clear change in market behavior, with accumulation trends now spanning nearly all wallet sizes.
Smaller holders with less than 1 BTC have reversed their previous distribution trend and are now lightly accumulating, reflected in an accumulation score of approximately 0.55.
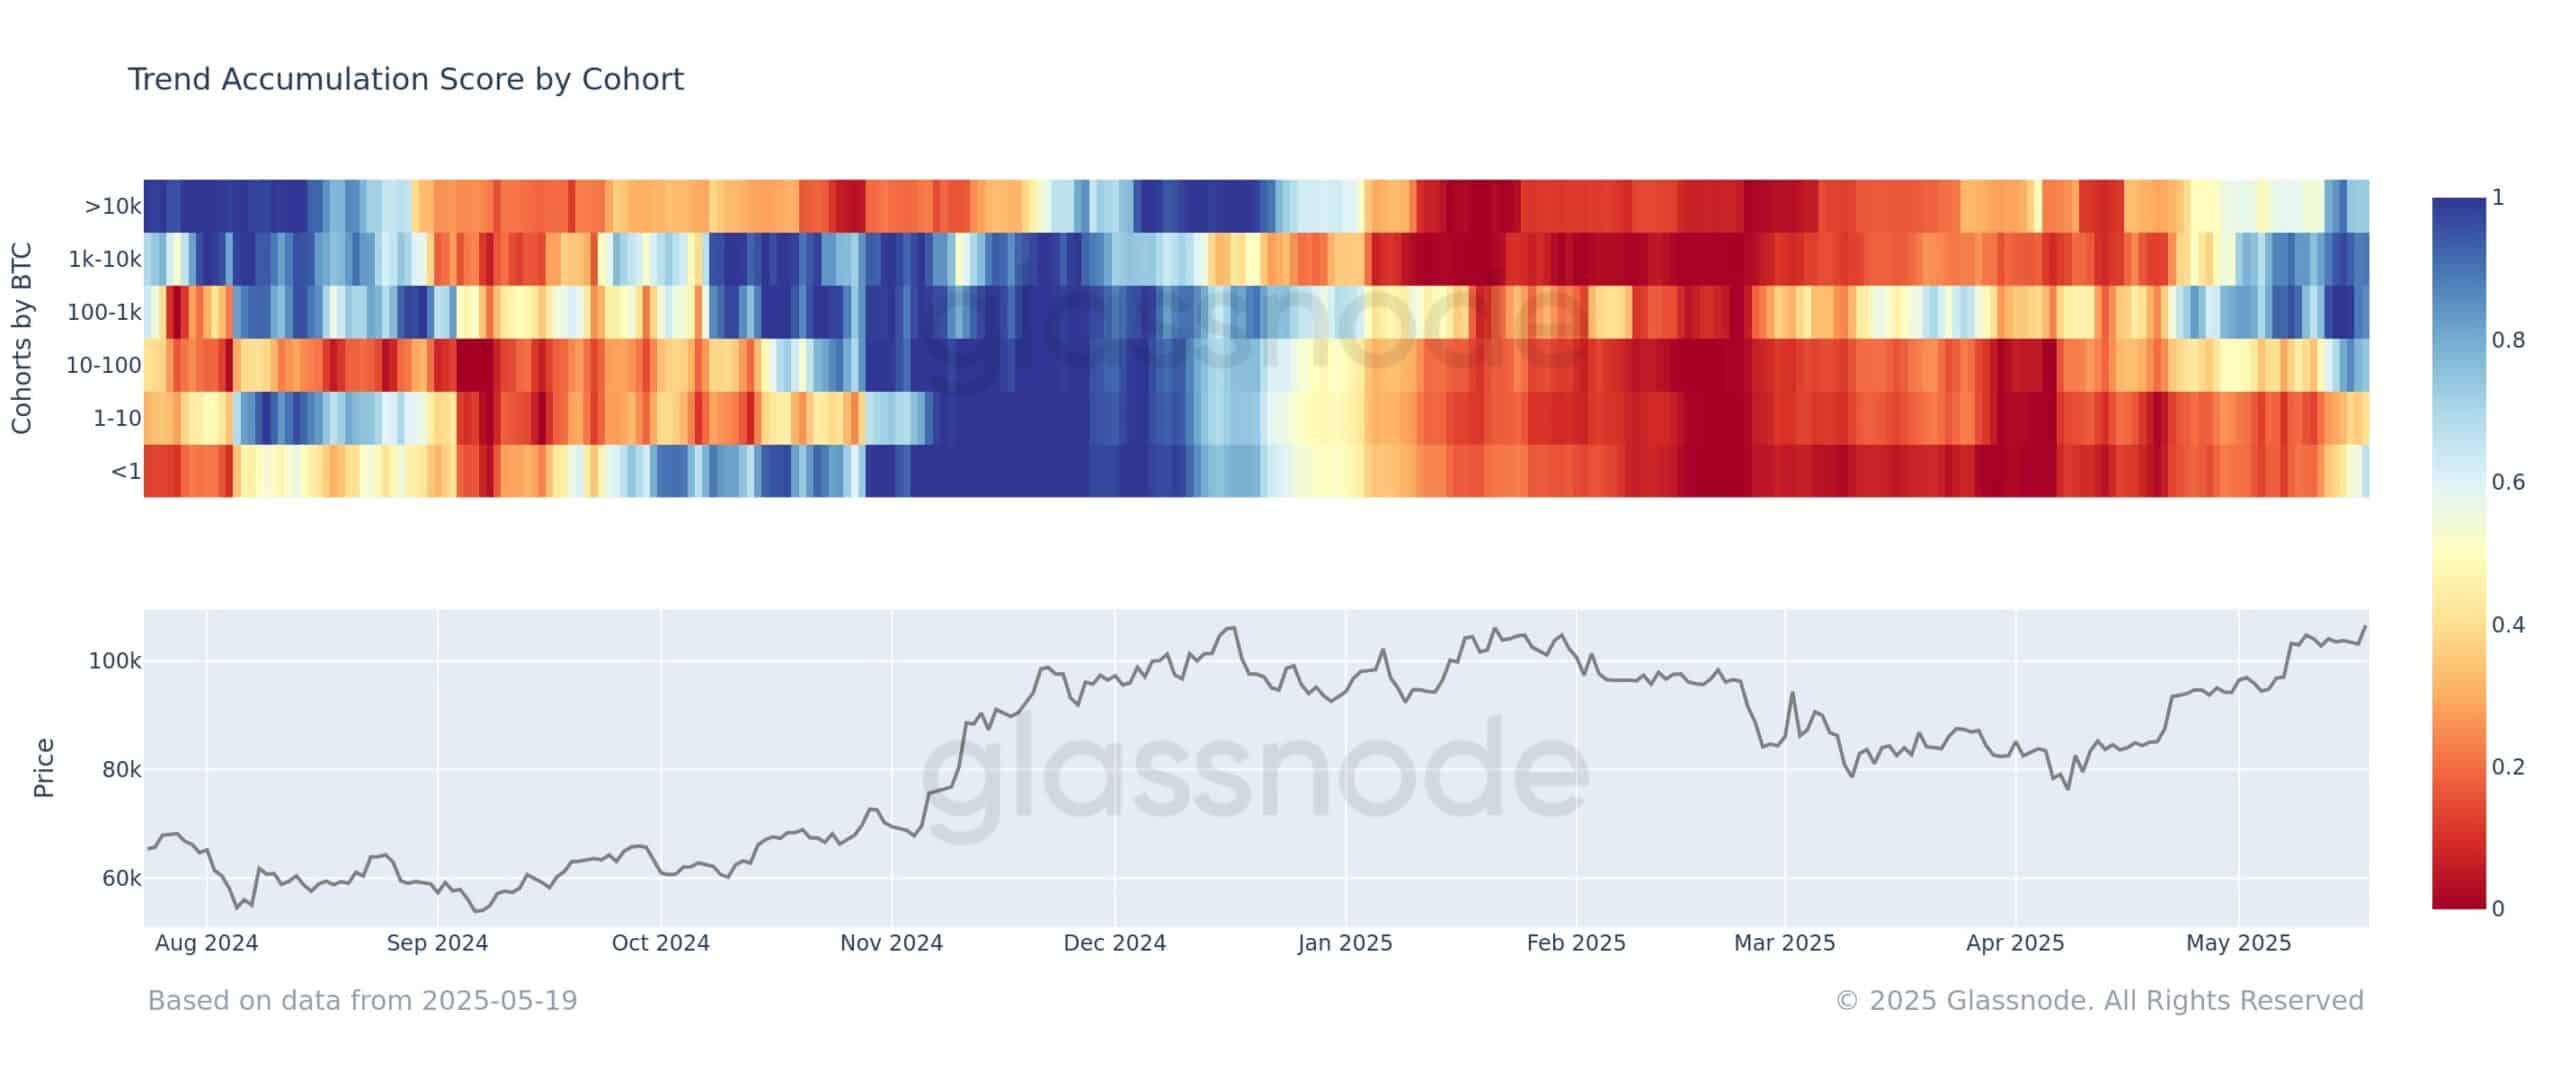
Meanwhile, larger wallet cohorts—holding between 100–1,000 BTC and 1,000–10,000 BTC—are exhibiting even stronger accumulation trends.
The only segment still in net distribution mode is the 1–10 BTC range, reinforcing a broader resurgence in confidence toward Bitcoin’s price action.
Clustered long positions could amplify downside volatility
A significant concentration of long positions between $101K and $106K has formed a high-risk liquidity zone.
According to Alphractal data, this setup increases the market’s vulnerability to sharp liquidation cascades, especially if Bitcoin’s price falls below the $100K threshold.

In contrast, the potential for short liquidations on upward moves appears relatively limited. With long exposure heavily stacked in this zone, any signs of weakness in BTC could quickly unravel into forced selling and increased volatility.
Price stalls near resistance
As seen on the daily chart, BTC showed signs of exhaustion just under the $106K level. Despite briefly touching $106,813, BTC failed to close above this key resistance, slipping slightly to $105,504 at press time.

At the time of writing, the RSI stood at 69.42 – hovering just beneath the overbought threshold – a sign of waning bullish momentum.
Meanwhile, the OBV has flattened around -86.6K, hinting at a pause in buy-side pressure.
If Bitcoin can maintain support above $105K, a breakout toward $110K remains plausible. However, a dip below $101K could trigger long liquidations and escalate downside volatility.


