Bitcoin – What do Global M2 patterns have to say about BTC’s next bull cycle?

- Global m2 money supply has turned positive.
- Historical patterns indicate BTC might be set to surge on the charts now
Bitcoin [BTC], the world’s leading cryptocurrency, continues to flash uncertainty among traders, whales, and institutions. Especially as the market waits for better conditions in the final quarter of the year.
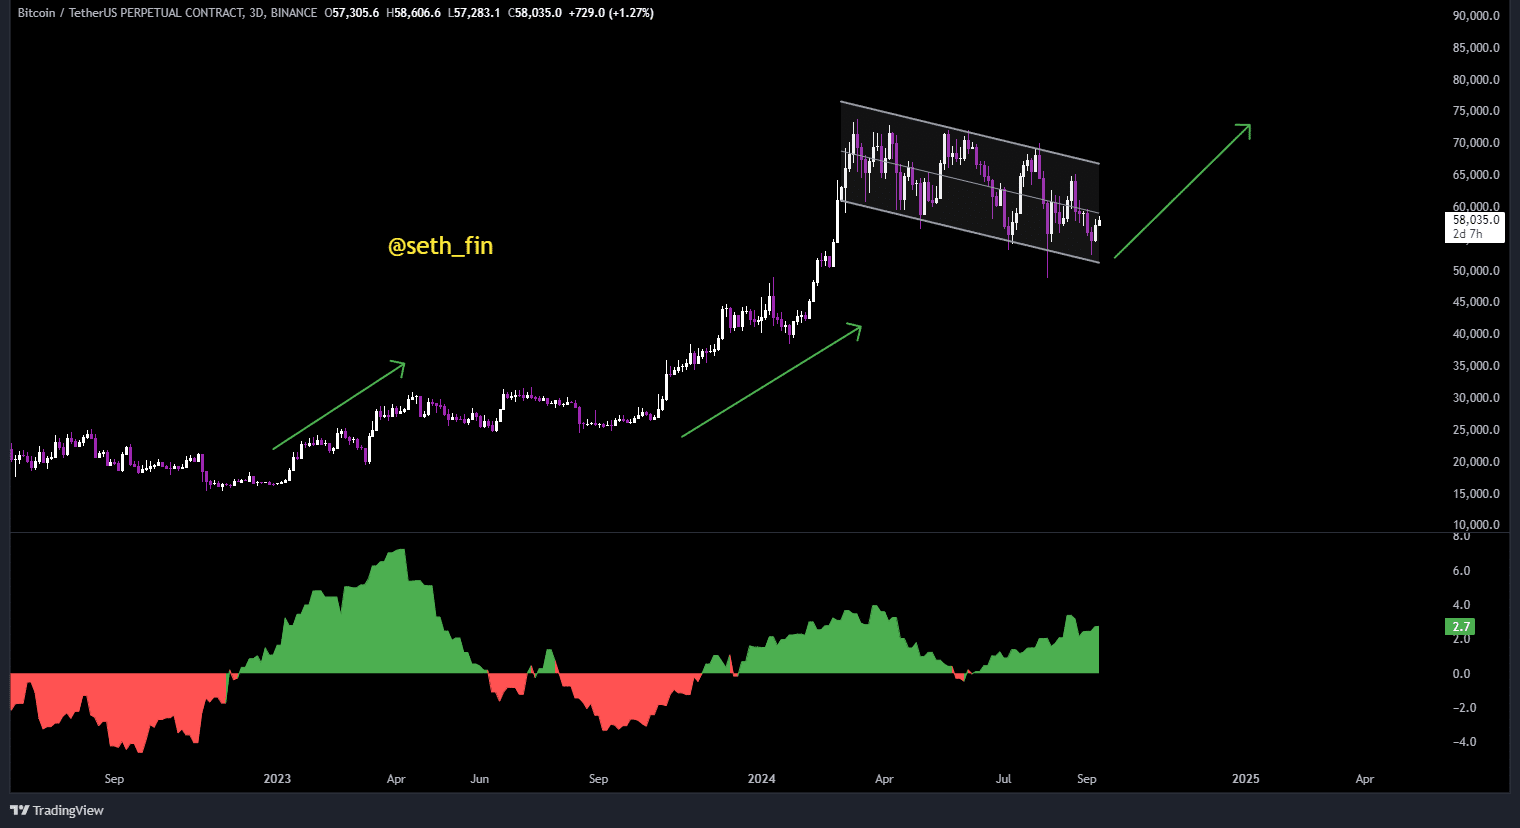
Historically, Bitcoin has surged whenever the global M2 money supply has increased. Now, with the global M2 turning positive, traders are anticipating a potential bull run. One similar to those seen in late October 2023 and early January 2024, following which BTC hit new all-time highs.
At the time of writing, BTC/USDT seemed to be correcting in a bullish flag pattern. Another BTC surge could be on the horizon, with the anticipated Federal Reserve rate cut being key.
A 25 basis point cut seems likely. However, in financial markets, large moves need to settle before becoming apparent.
Bitcoin trading back at mid range
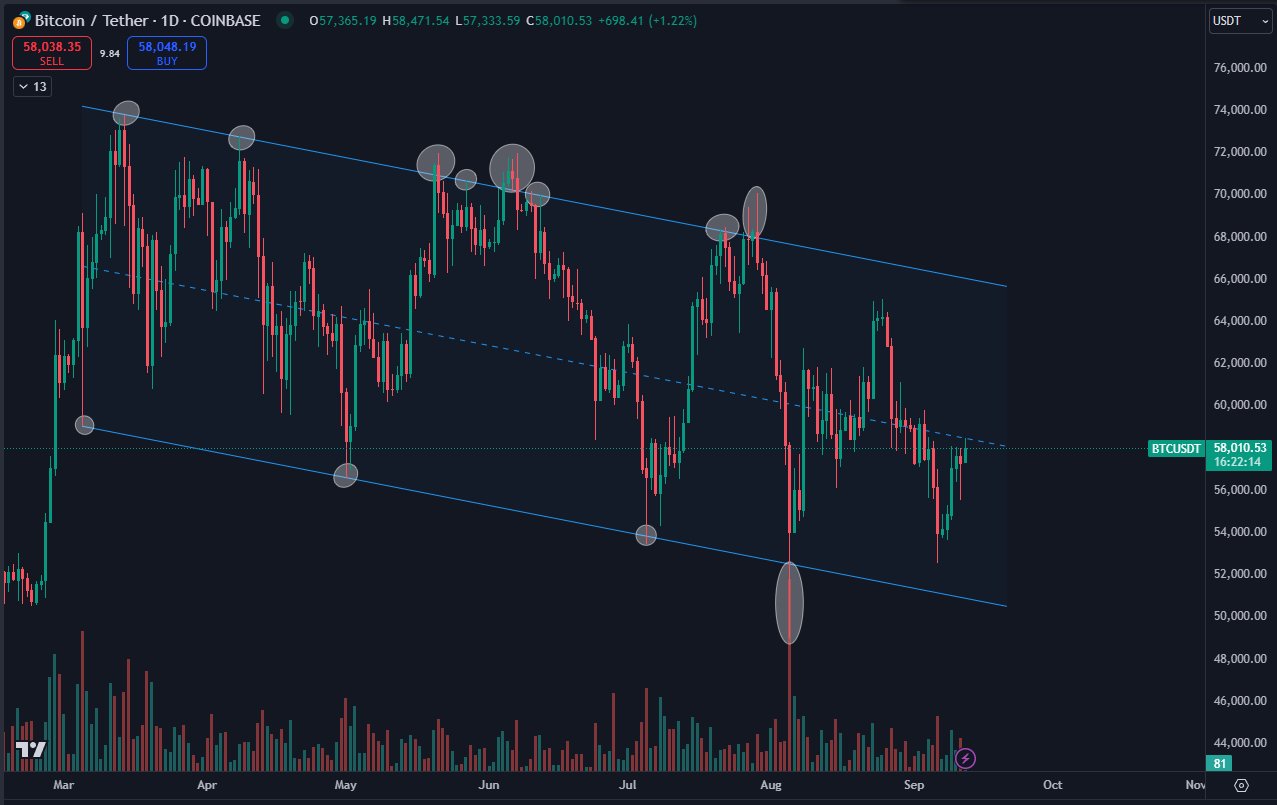
At press time, BTC was trading near the middle of its price range within a descending trend channel.
A breakout to the upside could lead to a push towards the top of the channel and a potential breakout. The lower boundary sat at $51k, while the upper resistance was at $66k.
Now, although BTC seemed to be consolidating, its strength remains evident. Especially since bears have been unable to break the lower trendline.
If Bitcoin breaks the upper trendline and stays above it, BTC’s price could see a significant rally, potentially pushing it new highs. This can be supported by the global M2 versus Bitcoin price chart.
MVRV z-score highlights low unrealized profits
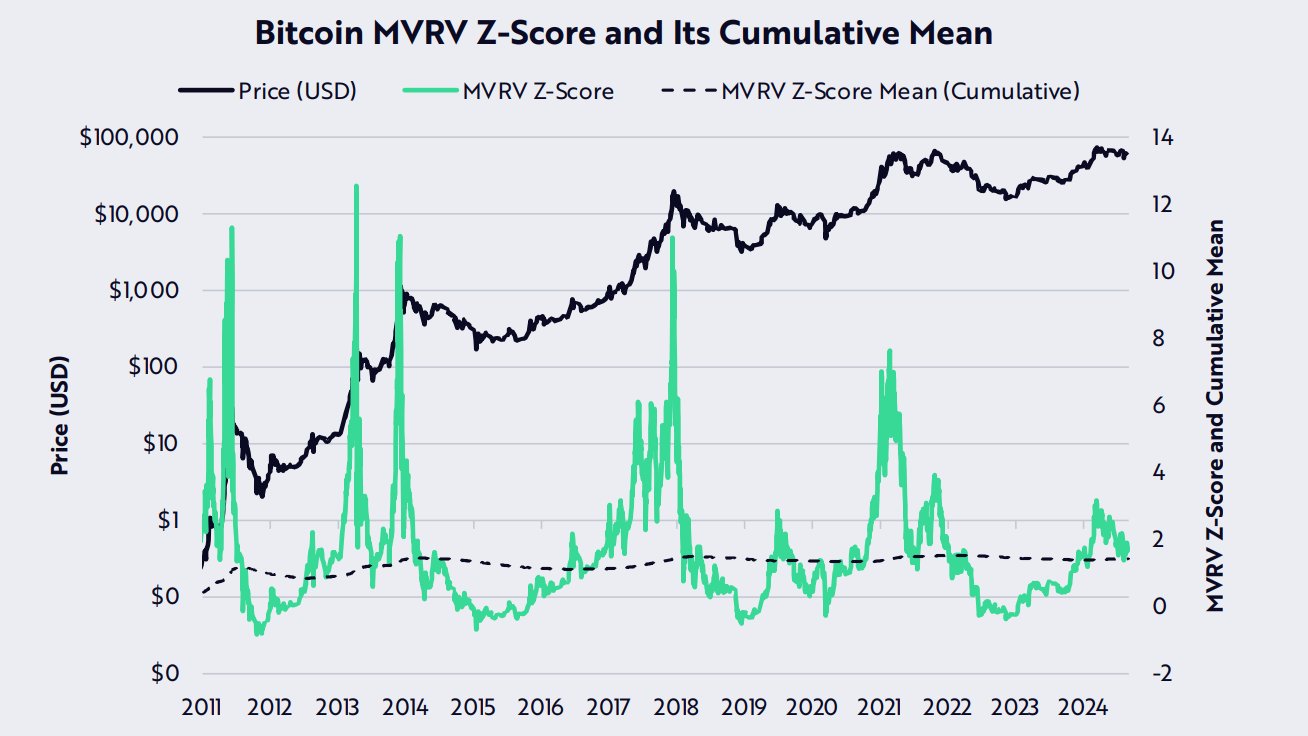
The MVRV z-score, a key indicator of market sentiment, had a reading of around 1.9 at press time. This suggested that BTC has been gradually declining while the network’s average on-chain cost basis has risen.
By extension, this means there are low unrealized profits in the market, leaving more room for upward movement.
Historically, whenever the MVRV z-score has been at these levels, Bitcoin has noted significant uptrends. The case studies of 2012, 2020, and 2023 are good examples.
Addresses with more than 0.1 Bitcoin near ATH
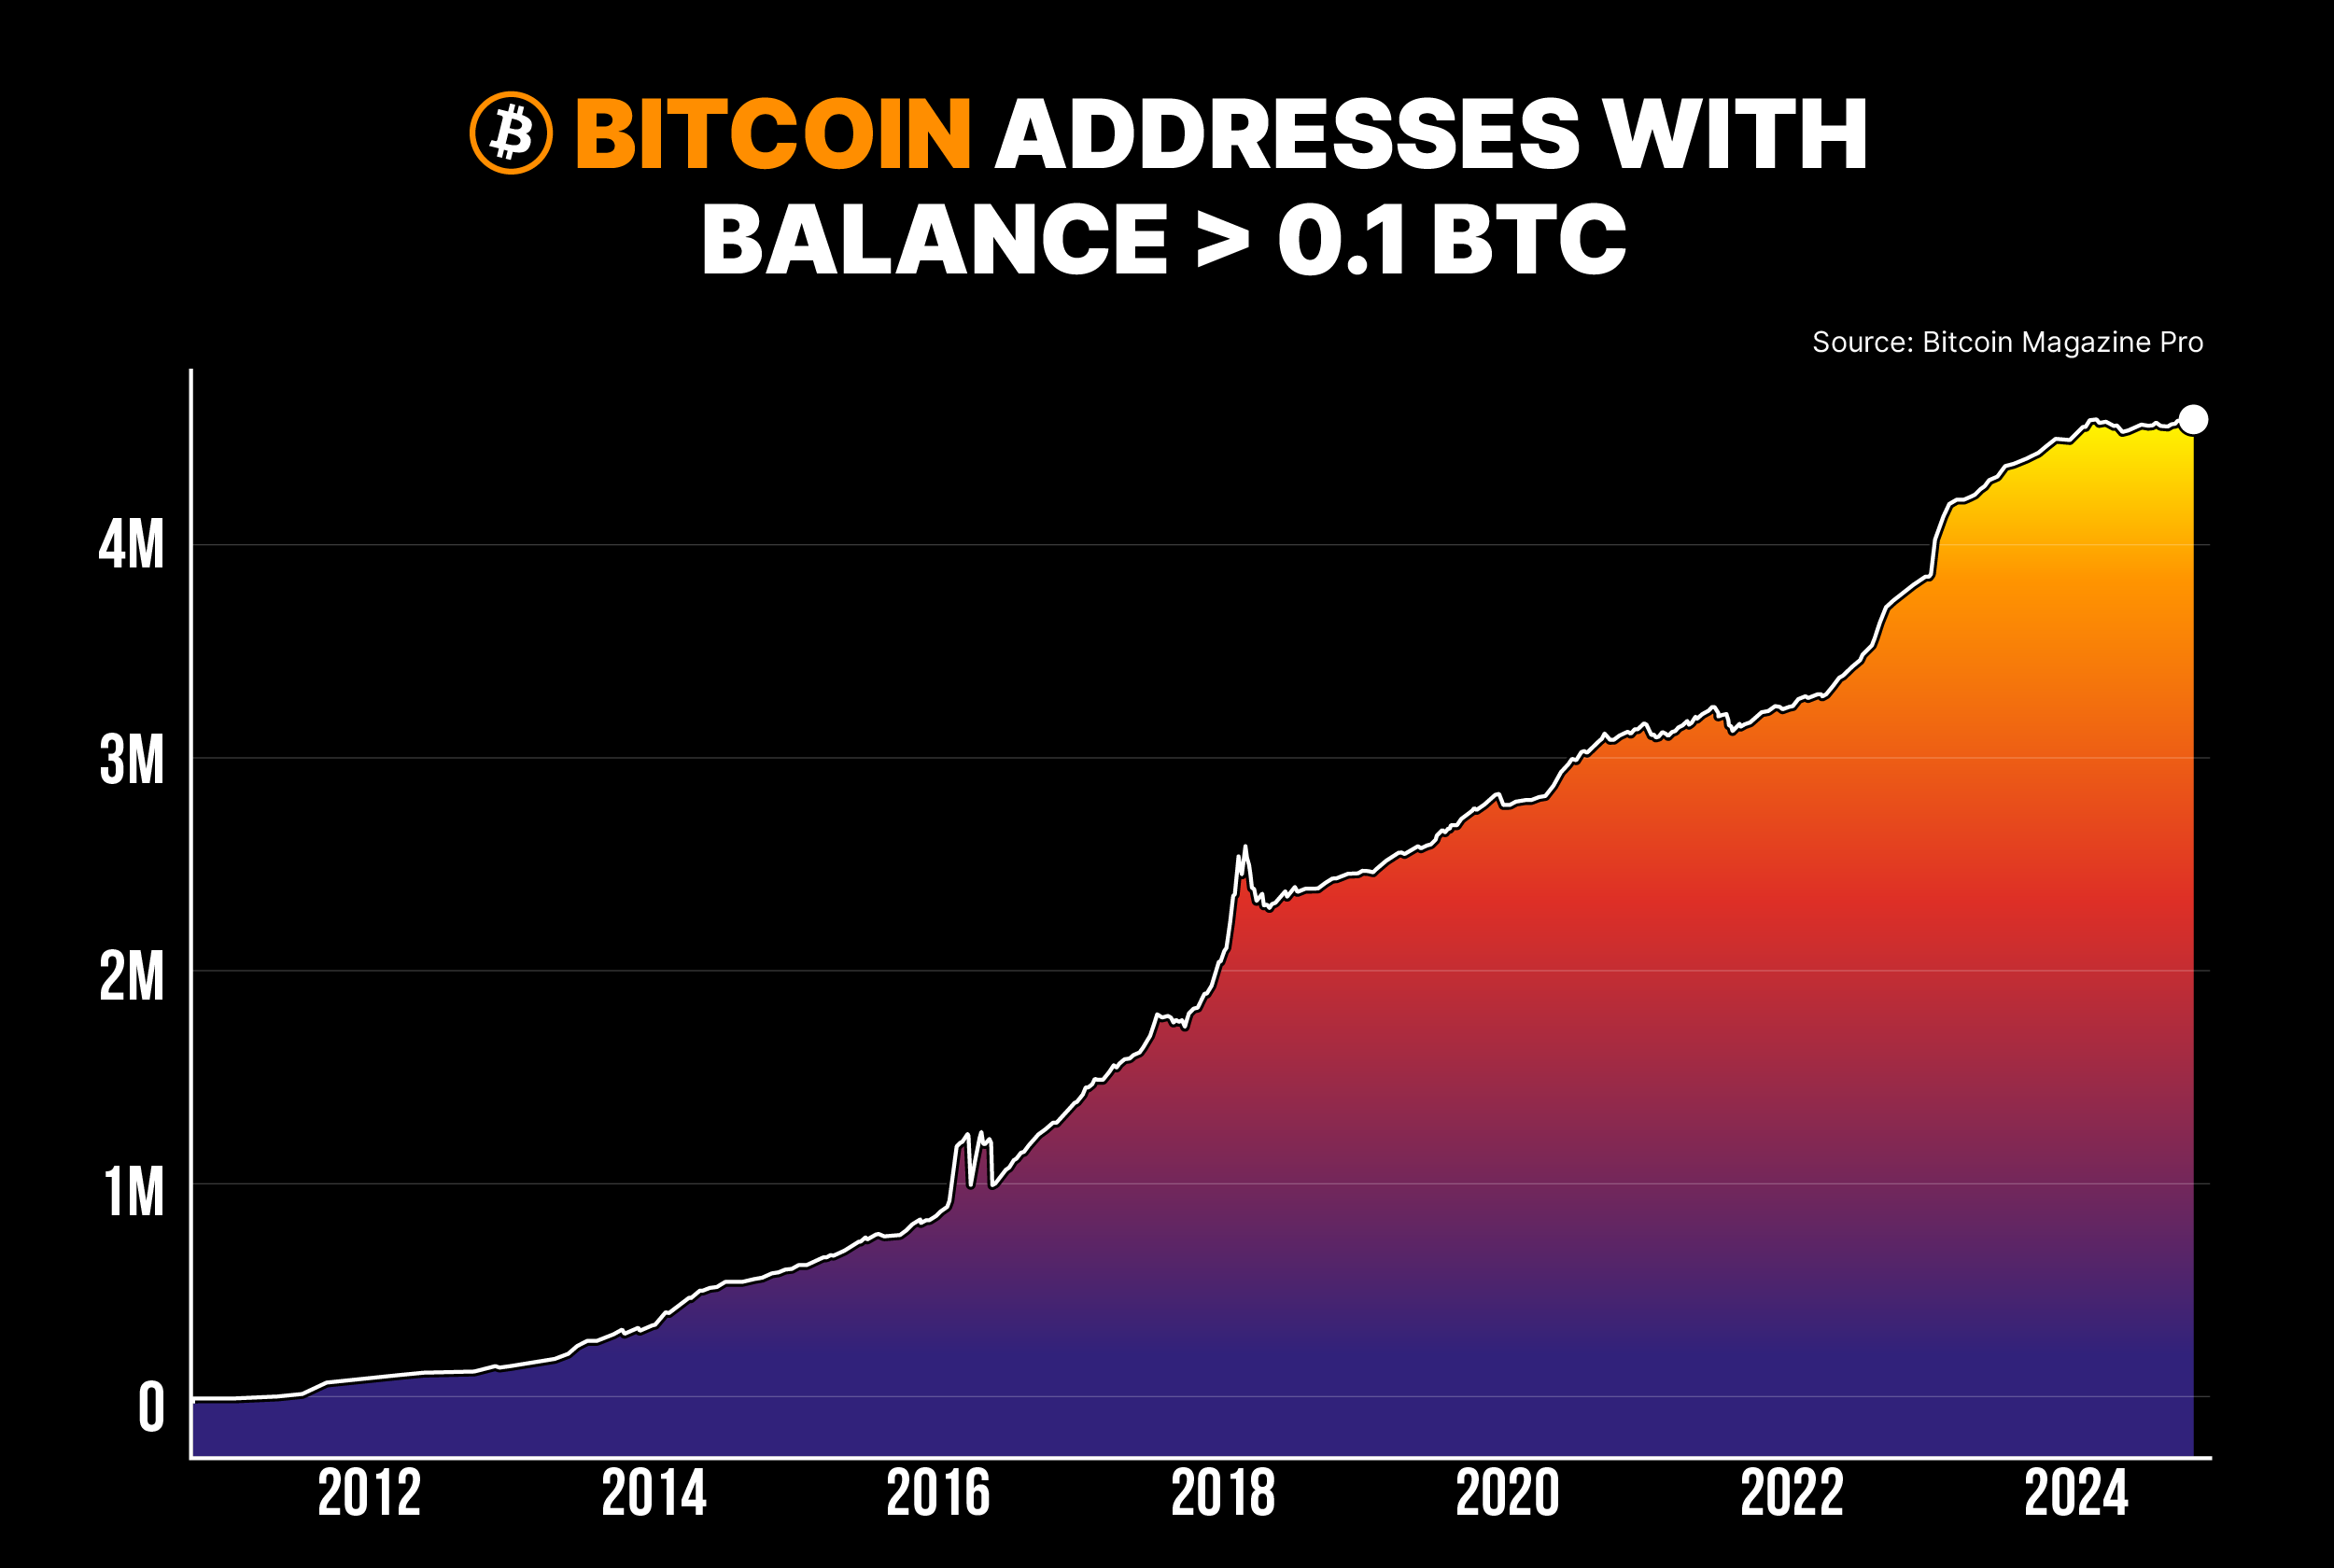
Additionally, the number of Bitcoin addresses holding at least 0.1 BTC is nearing a new all-time high.
This means that long-term holders, often referred to as “strong hands,” are accumulating Bitcoin, supporting the case for higher BTC prices.
As more strong hands buy BTC, it strengthens the market. This increases the likelihood of an upward trend on the charts.
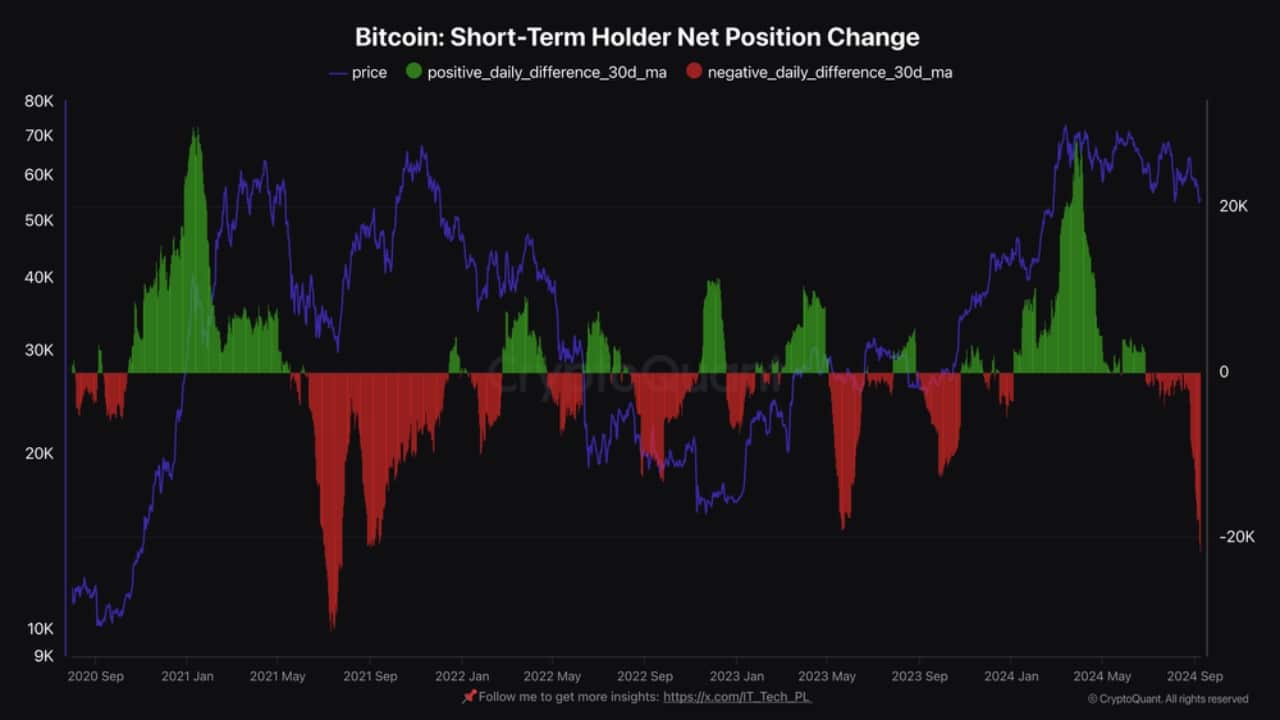
Bitcoin’s short-term holder net position change
Finally, Bitcoin’s short-term holder net position change revealed that many recent buyers, who entered during the last “fear of missing out” (FOMO) spike, are now leaving.
This is often a sign of market capitulation, signaling a potential bottom. When short-term holders capitulate, it often precedes a BTC price surge.
In conclusion, Bitcoin’s price is poised for potential growth. With strong on-chain metrics and historical trends favoring an uptrend, BTC could see a significant rally if global market conditions improve and the Federal Reserve implements a rate cut.

