Bitcoin: What stablecoin flows tell you about BTC’s next move
With Bitcoin back above the $43k mark, confidence in the market has begun to increase.

- The resumption of BTC and ETH flow out of exchanges signaled accumulation
- The USDT Dominance chart showed investors could be gearing up to assume more risk
Bitcoin [BTC] fell below the $40k bullish bastion the past week but has been quick to bounce back higher. A 30th January post from Santiment on X (formerly Twitter) sheds light on what happened.
📊 As #Bitcoin's & #Ethereum's respective supplies have continued moving off exchanges after the #ETF approvals, an interesting development has been #Tether seeing nearly 4% of its available supply come back to exchanges in 5 weeks. The increase in buying power implies
(Cont) 👇 pic.twitter.com/hQrBhZchEu
— Santiment (@santimentfeed) January 30, 2024
Ethereum [ETH] and the rest of the crypto market are projected to have another run higher, provided certain conditions are met.
Understanding the stablecoin movement into exchanges and on the dominance charts could shed more light on where the market is headed next.
Examining the exchange reserve trend
Bitcoin and Ethereum flowing out of centralized exchanges is a sign of accumulation. As the Santiment post outlines, this is indicative of self-custody and reduced risk of sell-offs. Yet, the BTC flow out of exchanges is not a new trend.
This outflow has been ongoing since March 2023. The trend stalled in early December as Bitcoin prices climbed to the $44k mark.
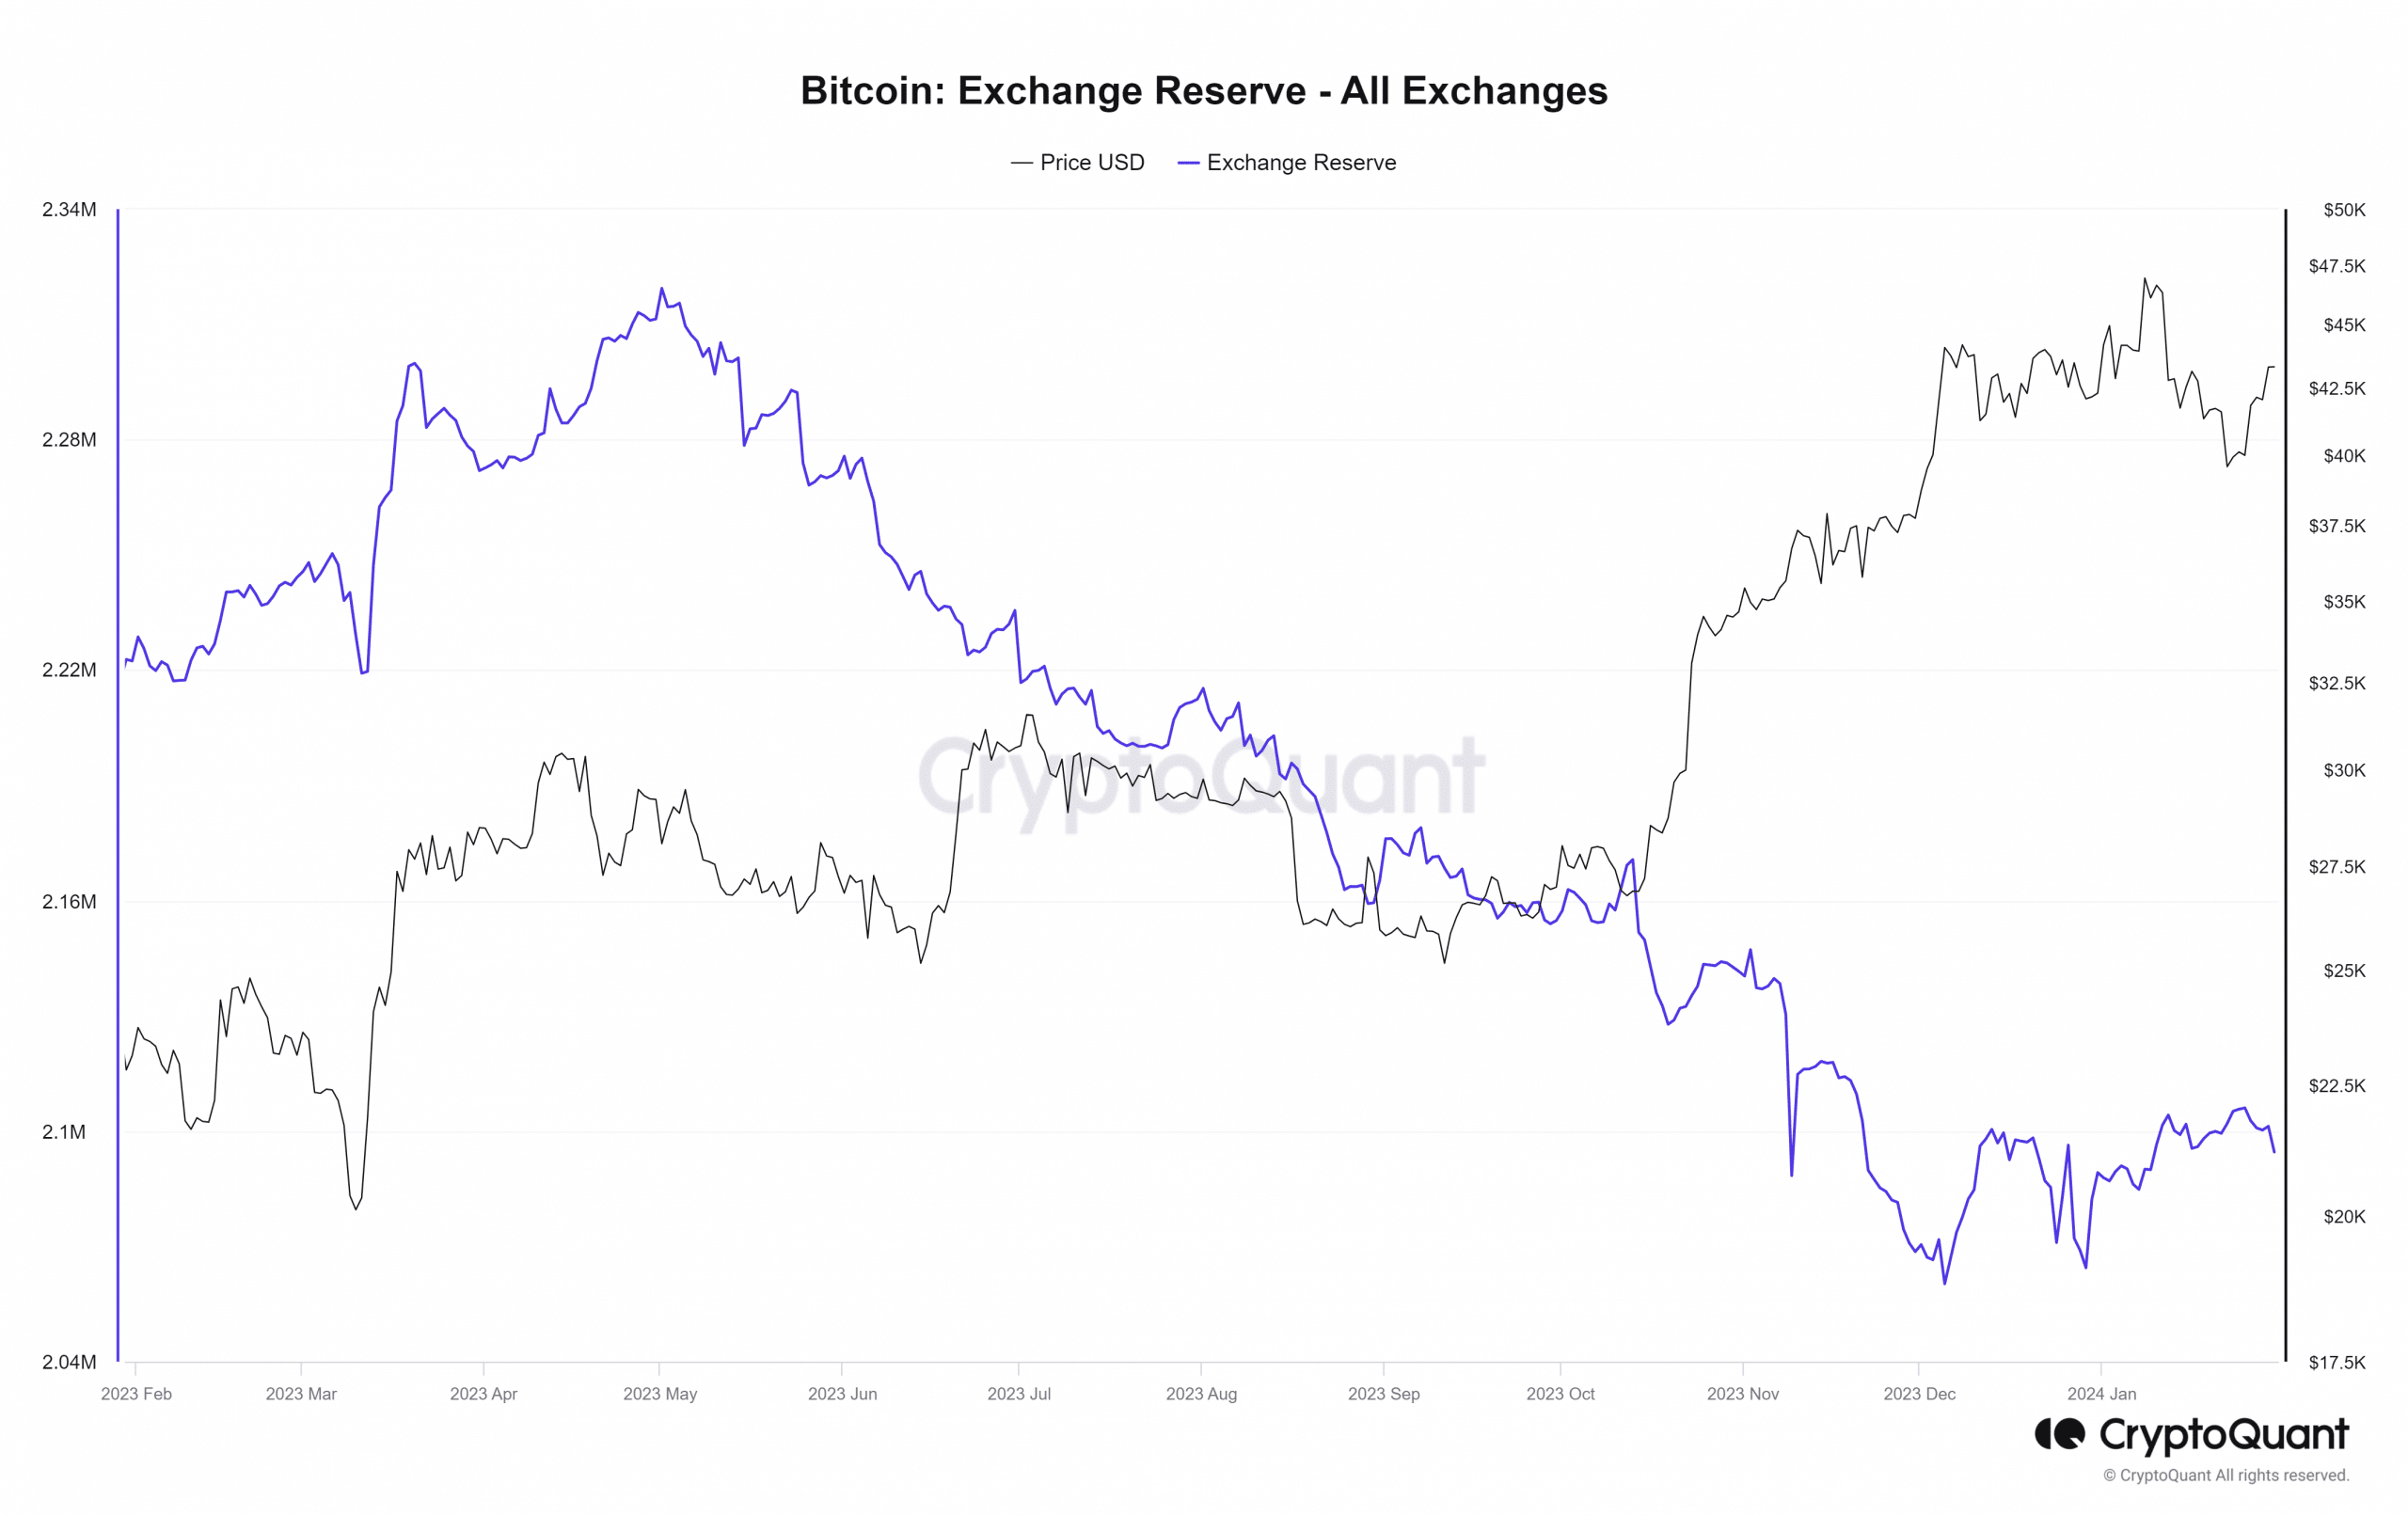
From then till a week ago, the exchange reserves slowly rose higher as holders booked profit on the explosive BTC rally to $45k. The Bitcoin spot ETF approval saw prices slump below $40k, and the market sentiment went from Greed to Neutral.
The past week saw the exchange reserves fall once again. Meanwhile, the Tether [USDT] reserves on exchanges have risen.
The USDT dominance chart could prove useful
The rise in Tether reserves on exchanges is a sign of confidence from investors. They show their willingness to risk their stablecoin capital on altcoins and could push the prices of assets across the market higher.
A downtrend in the USDT Dominance chart would come alongside a rally across the market. The USDT Dominance is a measure of the market cap of USDT as a percentage of the crypto market cap.
Hence it is denoted as “dominance”, similar to Bitcoin dominance.
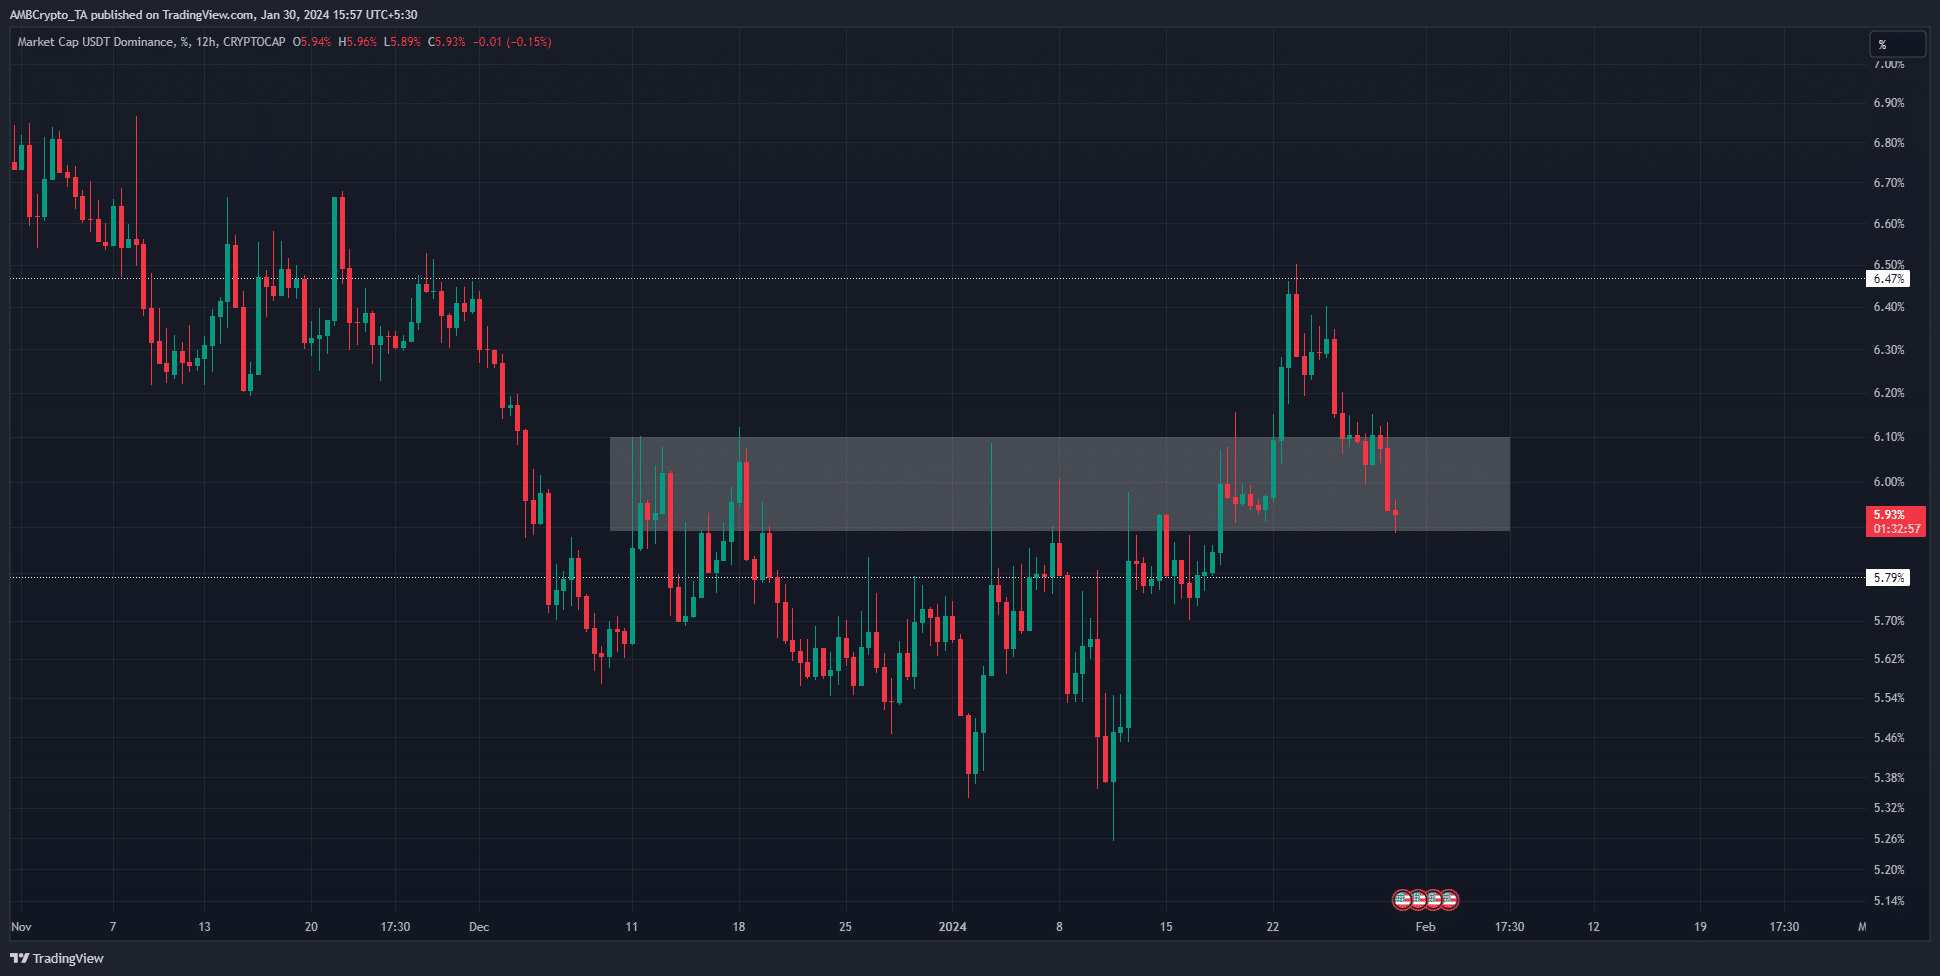
The latter half of January saw the USDT Dominance soar higher as prices crashed. This was indicative of investors fleeing to the stablecoin amidst market uncertainty. But the trend might have begun to reverse.
The white box represented a zone of resistance from December that has since become support. However, the recent drop in dominance could continue.
If it does fall below the 5.88% mark, then the highlighted zone would be flipped to resistance once more.
Read Bitcoin’s [BTC] Price Prediction 2024-25
With Bitcoin back above the $43k mark, confidence in the market has begun to increase. This could see Bitcoin, and then various sectors in the altcoin market, alongside Ethereum, rally higher.
A dramatic meme coin pump might mark the end of this run, like it did in the first week of December.


