Bitcoin: What you should know about these market players’ latest move

With Bitcoin dropping by 7.25% over the past week, a persistent bearish sentiment has clouded the crypto-space. However, it was not all bad news for investors as many partook in profit-taking activities to capitalize on BTC’s downward momentum.
On-chain metrics for the past week indicated an elevation in profit-taking and the return of activity from long-term holders who seemed to believe in “selling the dip.” While signs of recovery are difficult to isolate through on-chain activity, some of these metrics did indicate upcoming price volatility when looked at from a historical perspective.
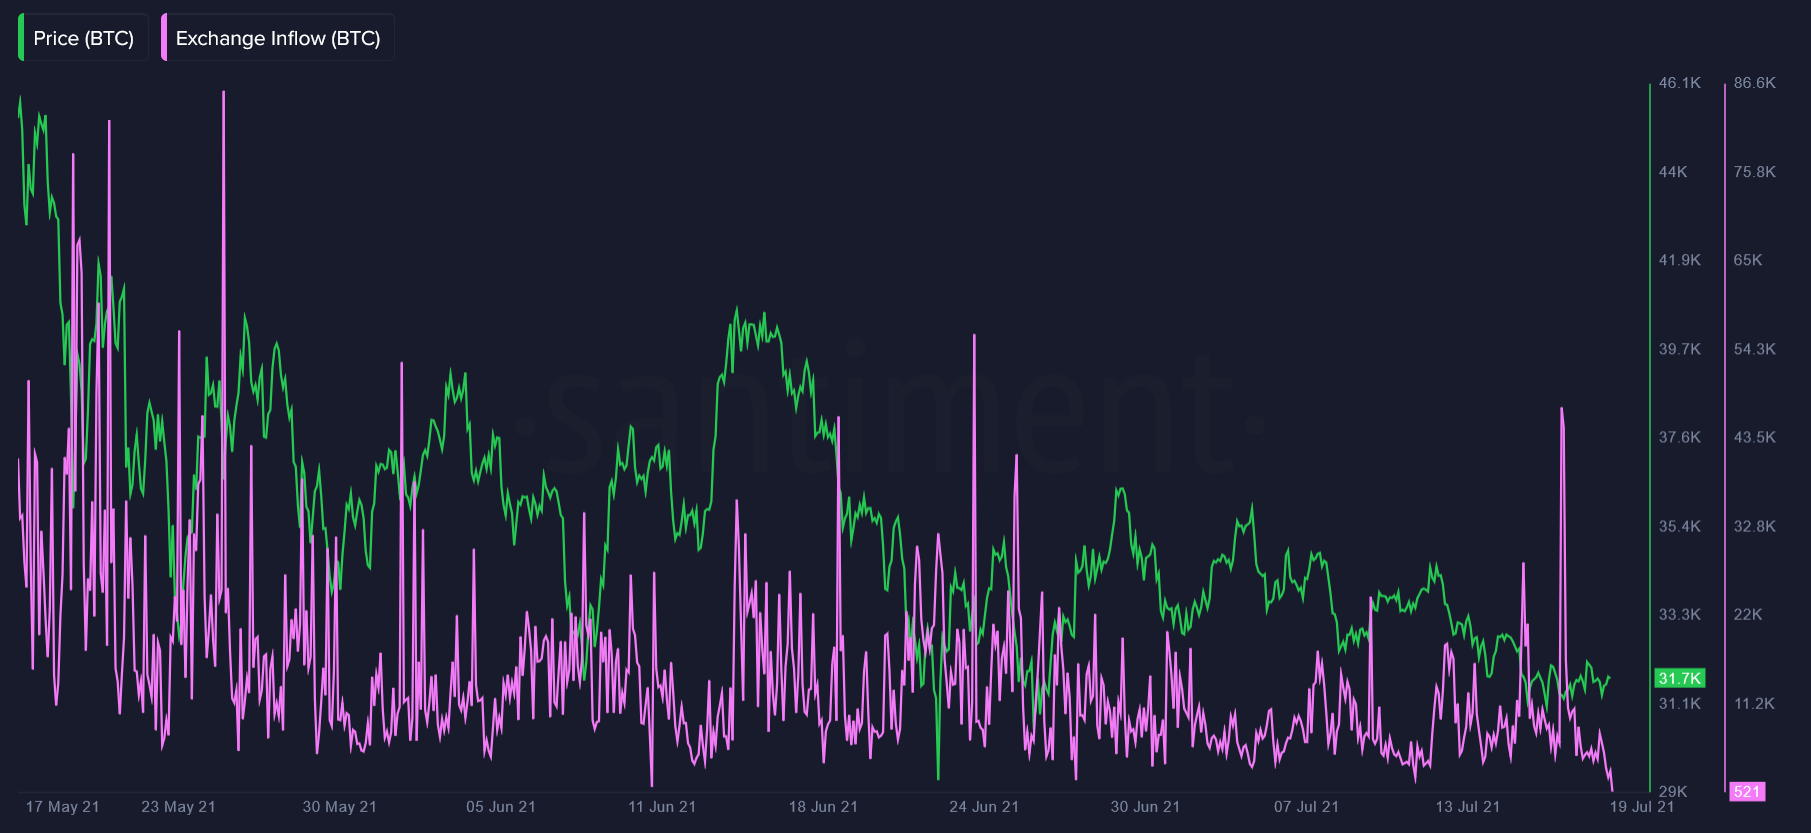
First of all, according to the attached chart, an uptick in the volume of BTC moving to known exchange wallets was seen over the weekend. This could be a sign of holder sentiment getting weaker, resulting in an increase in sell-side pressure. This also led to an increase in the total supply of BTC available on exchanges which rose by 0.14% on 17 July. It’s worth noting here that at press time, BTC had fallen below the $30k level on the charts.
More significantly, it left an impact on Bitcoin’s Network Realized Profit/Loss (NPL), which is the difference between the cost of BTC during acquisition and its sell price. The metric touched a four-month high during the weekend, before which it had been largely on the negative side since BTC entered the correction phase in May.
This was a sign that the coins that moved on the network during this time were sold at a significant profit.
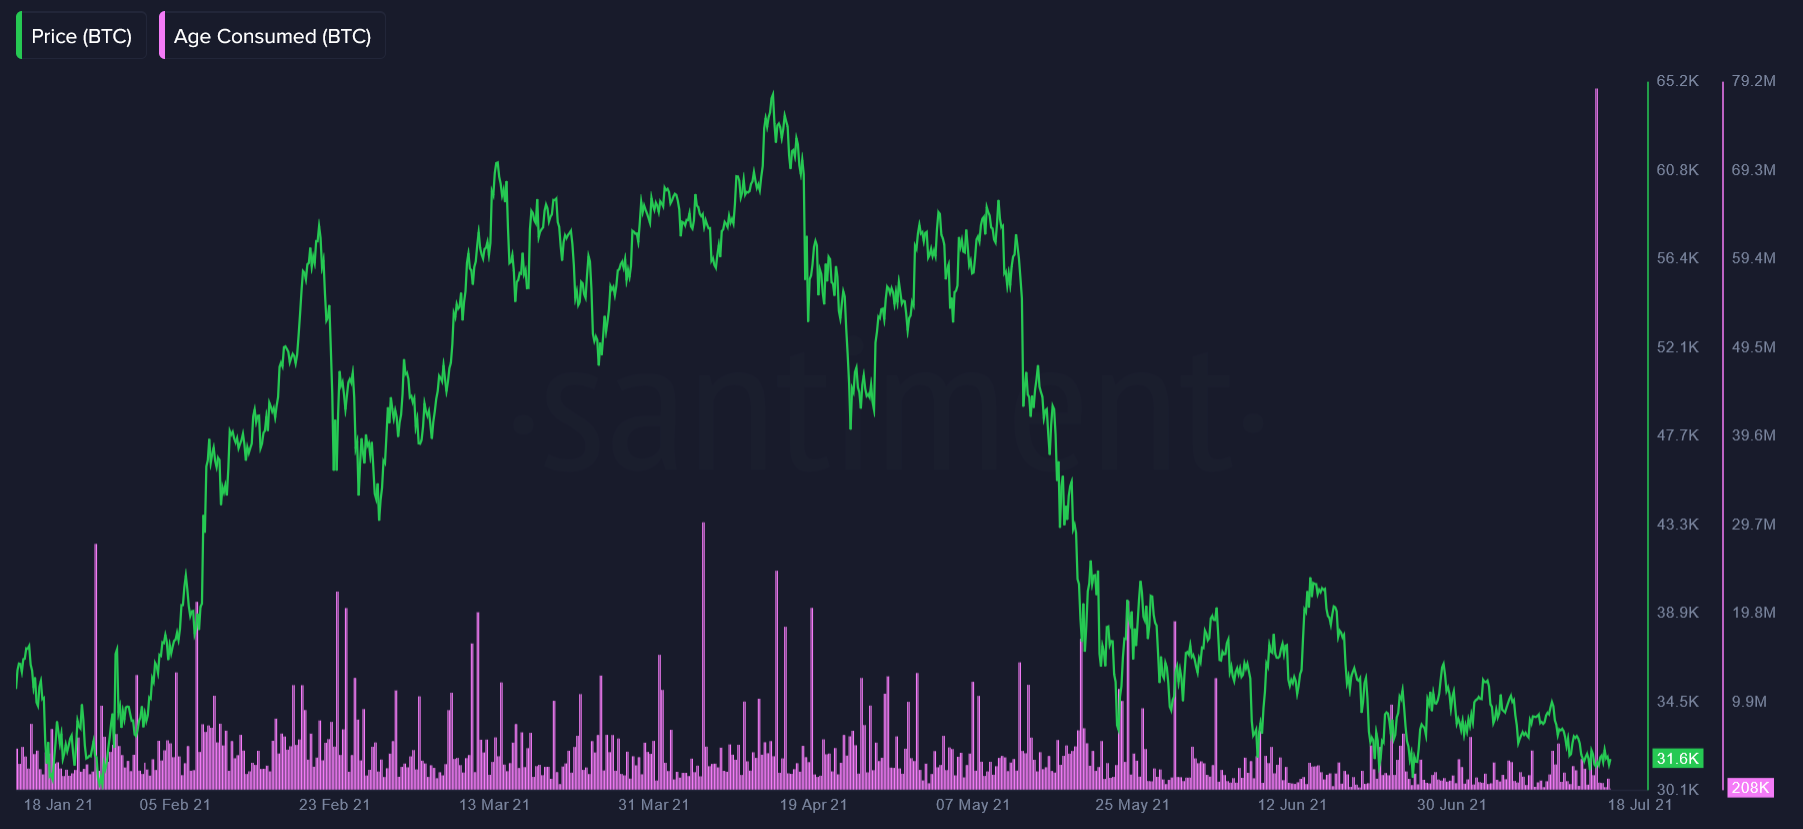
Finally, as pictured in the attached chart, a massive 6-month spike was also seen on BTC’s Age Consumed. This implied that the coins that were moved on Saturday had been dormant for an extended period of time, arguably for over 3 to 5 years.
While these metrics might not have a significant impact on the king coin’s price action, it might be a sign of the growing unease that investors are feeling due to this extended phase of ranging along with fears of further correction among holders.
It should also be noted that social metrics might have been consequential for this sell-off or might just be indicative of larger sentiments prevailing in the market. According to Santiment, for instance, BTC’s Relative Social Dominance (RSD) which compares BTC mentions on social media to alts also declined during this time. It went from 80.5% in June to 55.5% last week, signaling that top alts like ETH and ADA were gaining ground while investors became apathetic of BTC.
This was also highlighted in the average mood of thousands of BTC-related messages that were found on crypto-media, showcasing a progressively bearish stance thought the past month. Even mentions of ‘bear’ and ‘bearish’ started to gain steam, further indicating a highly fearful environment.
However, this does not necessarily point to negative price movement going forward, despite recent corrections, as high social volumes in the past have not been directly correlated with price surges either. On the contrary, increased mentions have frequently coincided with price corrections as investors tend to get over-enthusiastic near market tops, as mentioned in this report.
Similarly, an overtly bearish atmosphere has been more conducive to price growth in the past. In fact, over the past two years, many of BTC’s bouncebacks emerged from largely bearish atmospheres where investor sentiment was really down.


