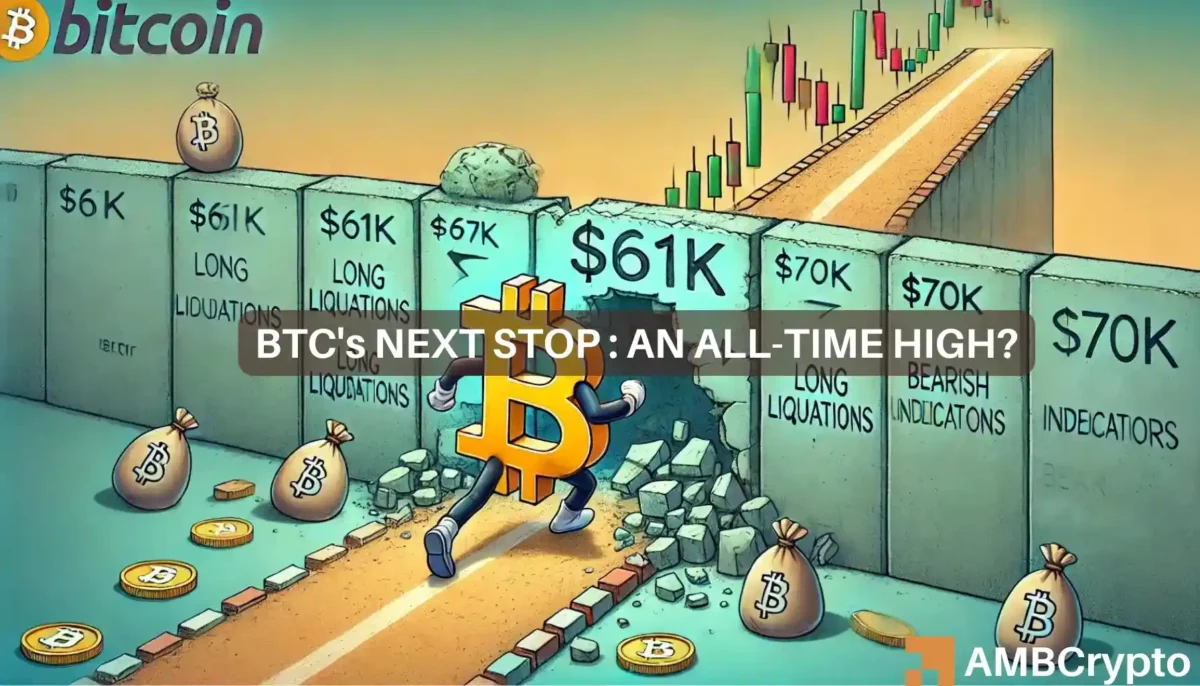
- Bitcoin tested the $61K level twice in two weeks but failed to sustain a bullish trend.
- Analyst hints at a possible Bitcoin reversal.
Bitcoin [BTC] has tested the $61K support level twice in two weeks, but each time the bulls faltered, sending the price back into the consolidation phase.
The latest attempt was made on the 21st of August, when BTC experienced a 3.36% upward swing, closing at $61,156.
Following this, AMBCrypto investigated whether this marked the start of a bullish rebound or if the bears would once again reassert their dominance.
BTC volume indicators support the Fibonacci prediction
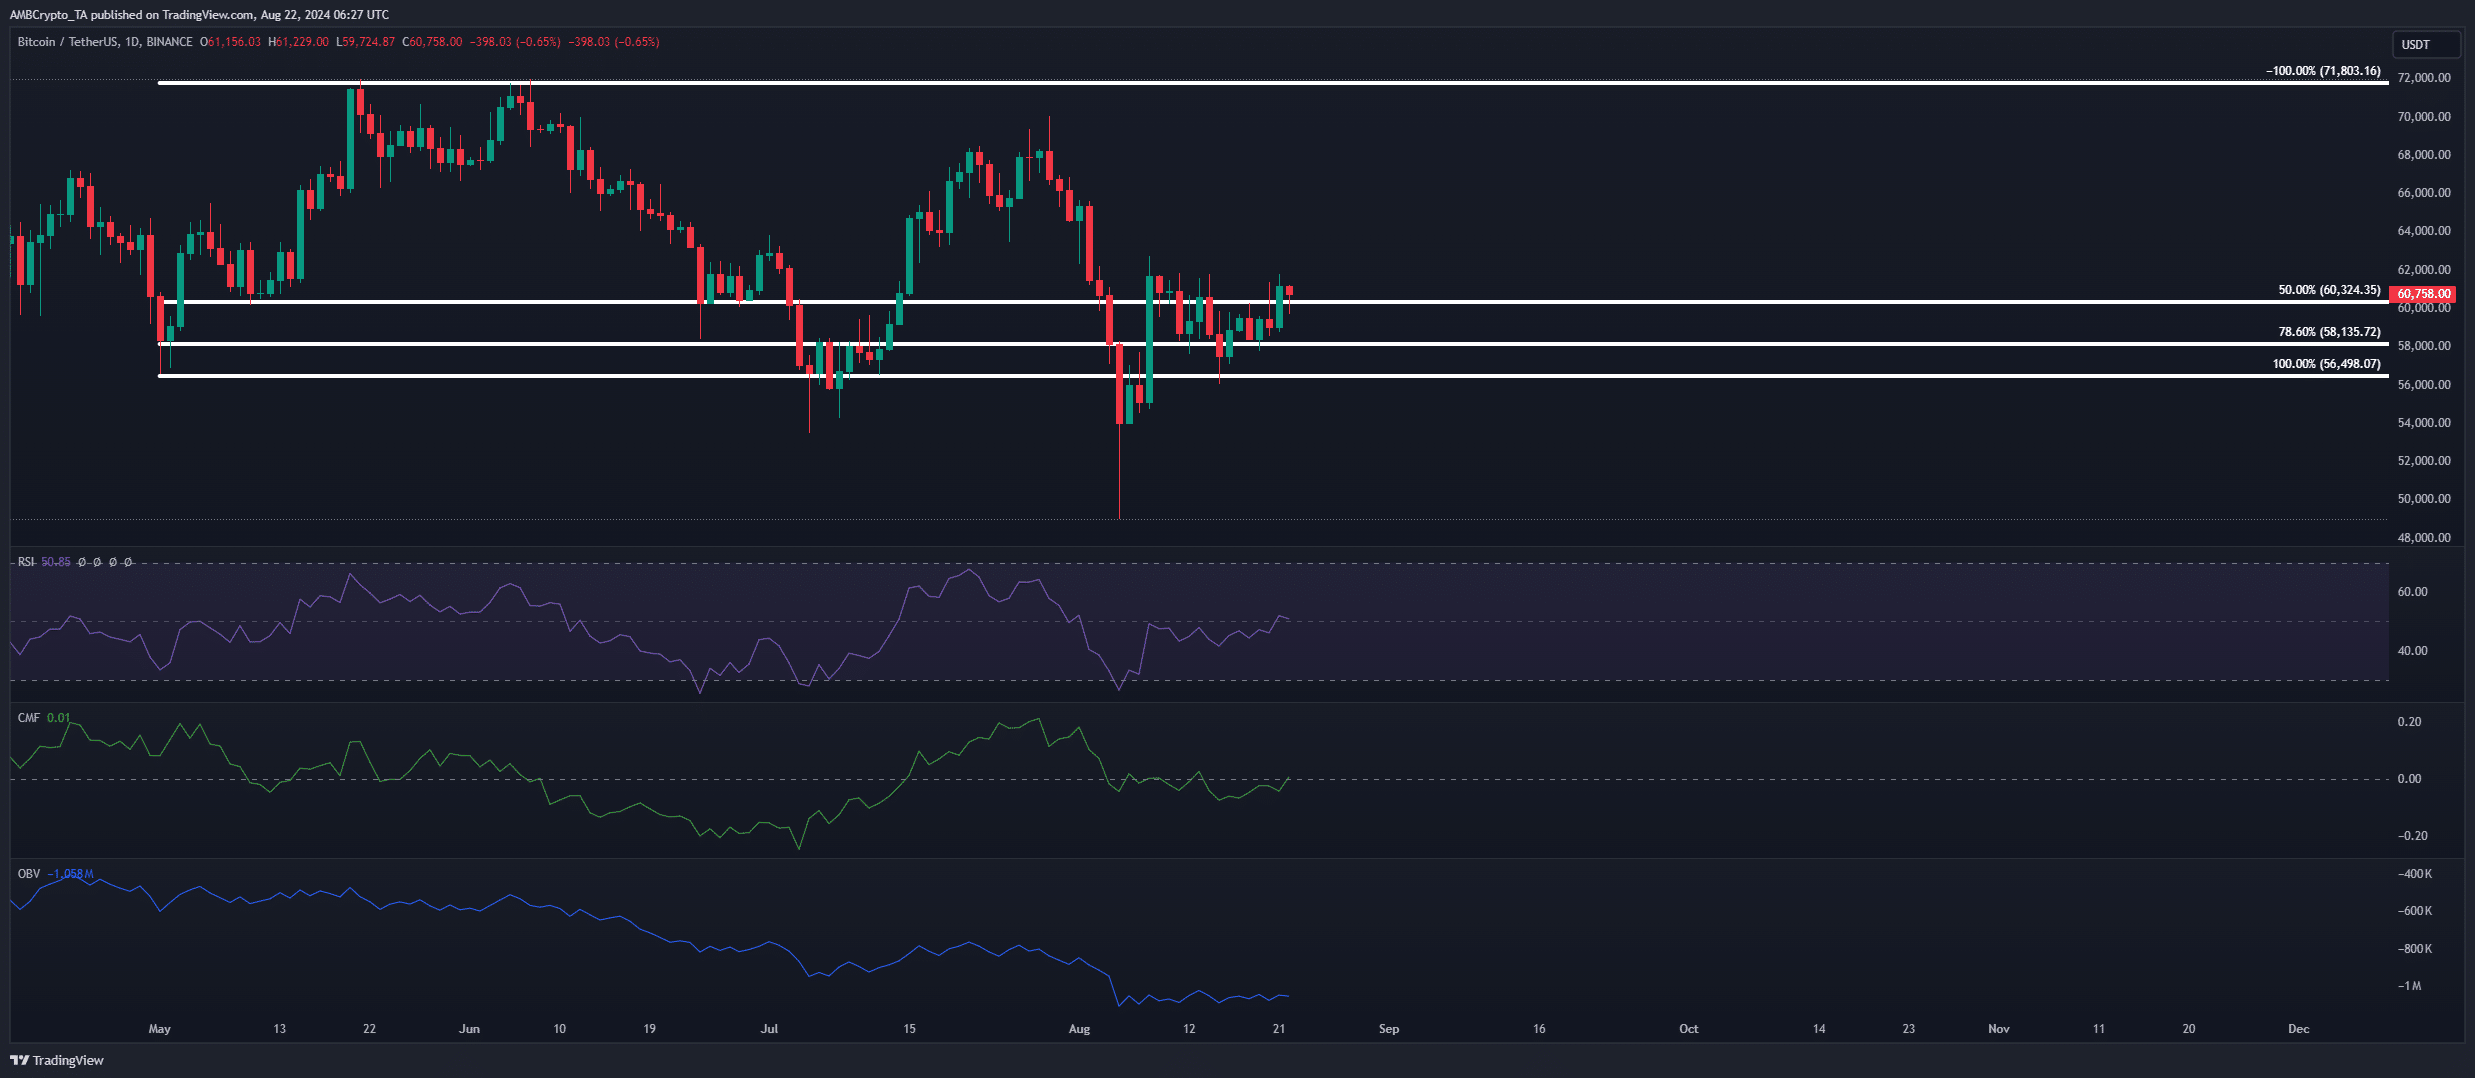
Source : BTC/USDT on Trading View
On the daily timeframe, the 100% Fibonacci retracement level at $56,500 has been tested four times since May.
The first time it was tested, the market reacted bullishly. In fact, during that episode, just within 20-days, Bitcoin breached the $70K resistance level.
Since then, bulls have been trying to repeat that momentum. However, the last formed wick on the price chart tested the 50% Fib level at $60,300, showing that bears have managed to weaken bullish hopes.
Historically, this moment has been crucial for Bitcoin’s future. It is at this range that market dynamics determine whether BTC will favor the bulls or the bears.
Looking at volume indicators certainly helps. Since the 5th of August, RSI and CMF on the daily timeframe projected a slower positive trend, indicating a growing momentum. While the OBV indicated consolidation.
Put simply, if bulls aim to replicate Bitcoin’s early May trend, strong volume is crucial. However, it is not enough on its own.
Long liquidations could sabotage BTC’s latest surge
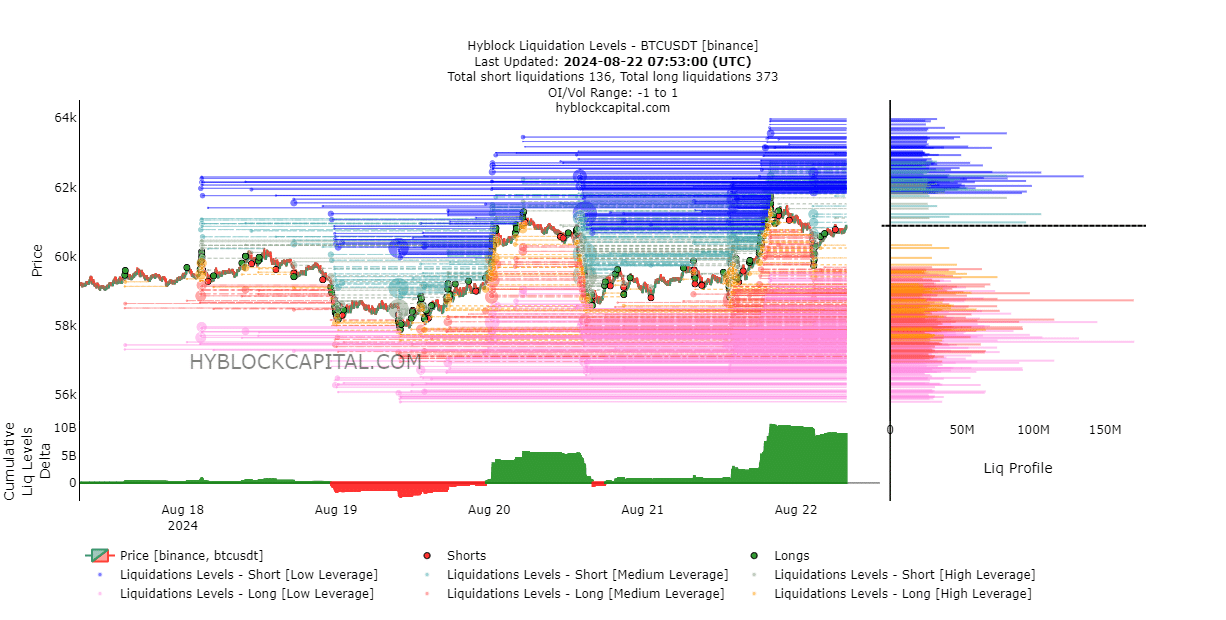
Source : Hyblockcapital
AMBCrypto’s analysis of the liquidation chart found that BTC has surged past the $61K mark, driven by a significant buildup of long liquidity, as highlighted by the cumulative delta.
In a recent X post, renowned crypto analyst Axel Adler Jr. hinted at a possible Bitcoin reversal, suggesting that short liquidations could be the trigger, creating a perfect setup for a short squeeze.
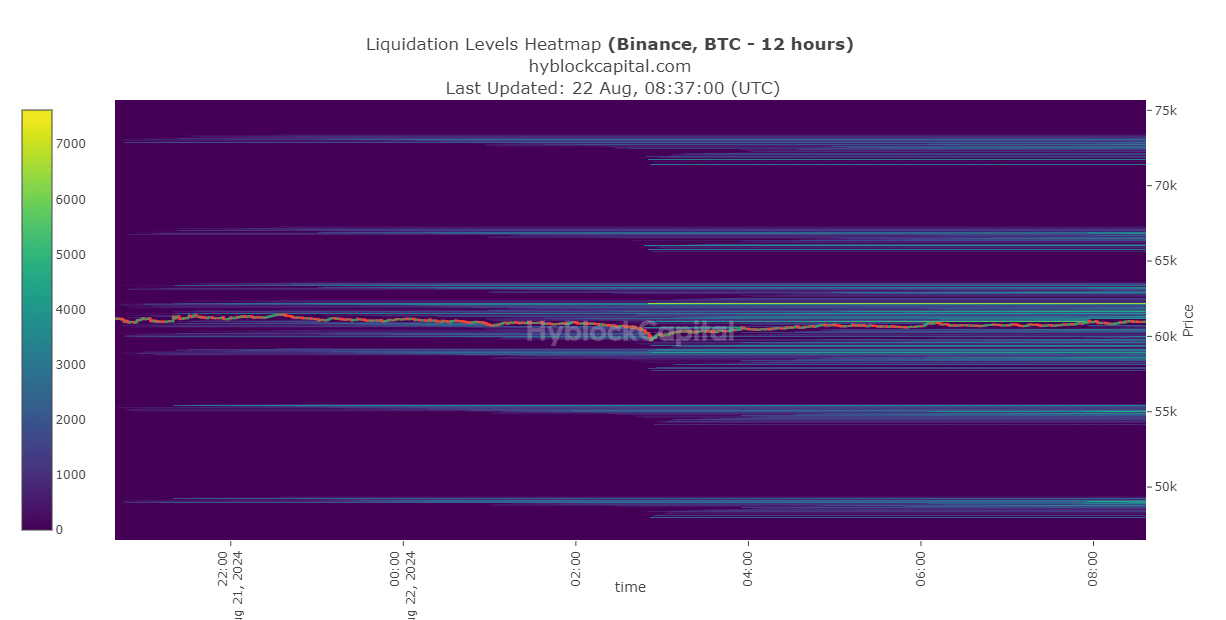
Source : Hyblockcapital
On the 12-hour lookback chart, a significant liquidity pool has formed around the $62,000 mark.
Read Bitcoin’s [BTC] Price Prediction 2024-25
If short liquidity draws Bitcoin to this level, it could drive its price all the way to a new ATH.
However, this outcome seems unlikely. AMBCrypto notes that if short position holders regain control, Bitcoin could decline and move towards the lower liquidity pool somewhere around $55K.