Bitcoin: Why skyrocketing realized profits impact you
BTC's realized profits are at a 14-month high, raising concerns. A price correction might follow if this trend continues.

- BTC’s realized profit has climbed to a 14-month high.
- A continued jump in average trader returns may lead to a price correction.
For the first time since May 2022, Bitcoin’s [BTC] price breached the psychological $30,000 price point to exchange hands at $31,200 during the intraday trading session on 3 July.
Read Bitcoin’s [BTC] Price Prediction 2023-2024
This price rally pushed the leading coin’s realized profit to a 14-month high, according to data from Santiment.
On-chain assessment of BTC’s performance revealed that although the coin struggled with the $30,000 resistance level in the past few weeks, its deposits on cryptocurrency exchanges continued to decline. This indicated investors’ lack of interest in selling off their BTC holdings.
Instead, many of them took to further coin accumulation.
Hold on to your profits before…
The surge in BTC accumulation in the last few weeks pushed the average trader’s returns to its highest level since May 2022. An unabated increase in trader’s profits will cascade into an event of price reversal.
According to data from Santiment, BTC’s MVRV ratio (Z Score) was a positive 0.776 at press time, suggesting that the leading coin was overvalued.

Typically, when an asset’s MVRV ratio (Z-Score value) is overvalued, market participants have bid up the price of such an asset beyond what is justified by its historical average realized value.
This may be due to speculative buying, investor exuberance, or other factors driving the price higher in the short term. In such situations, a price correction or a period of consolidation often follows.
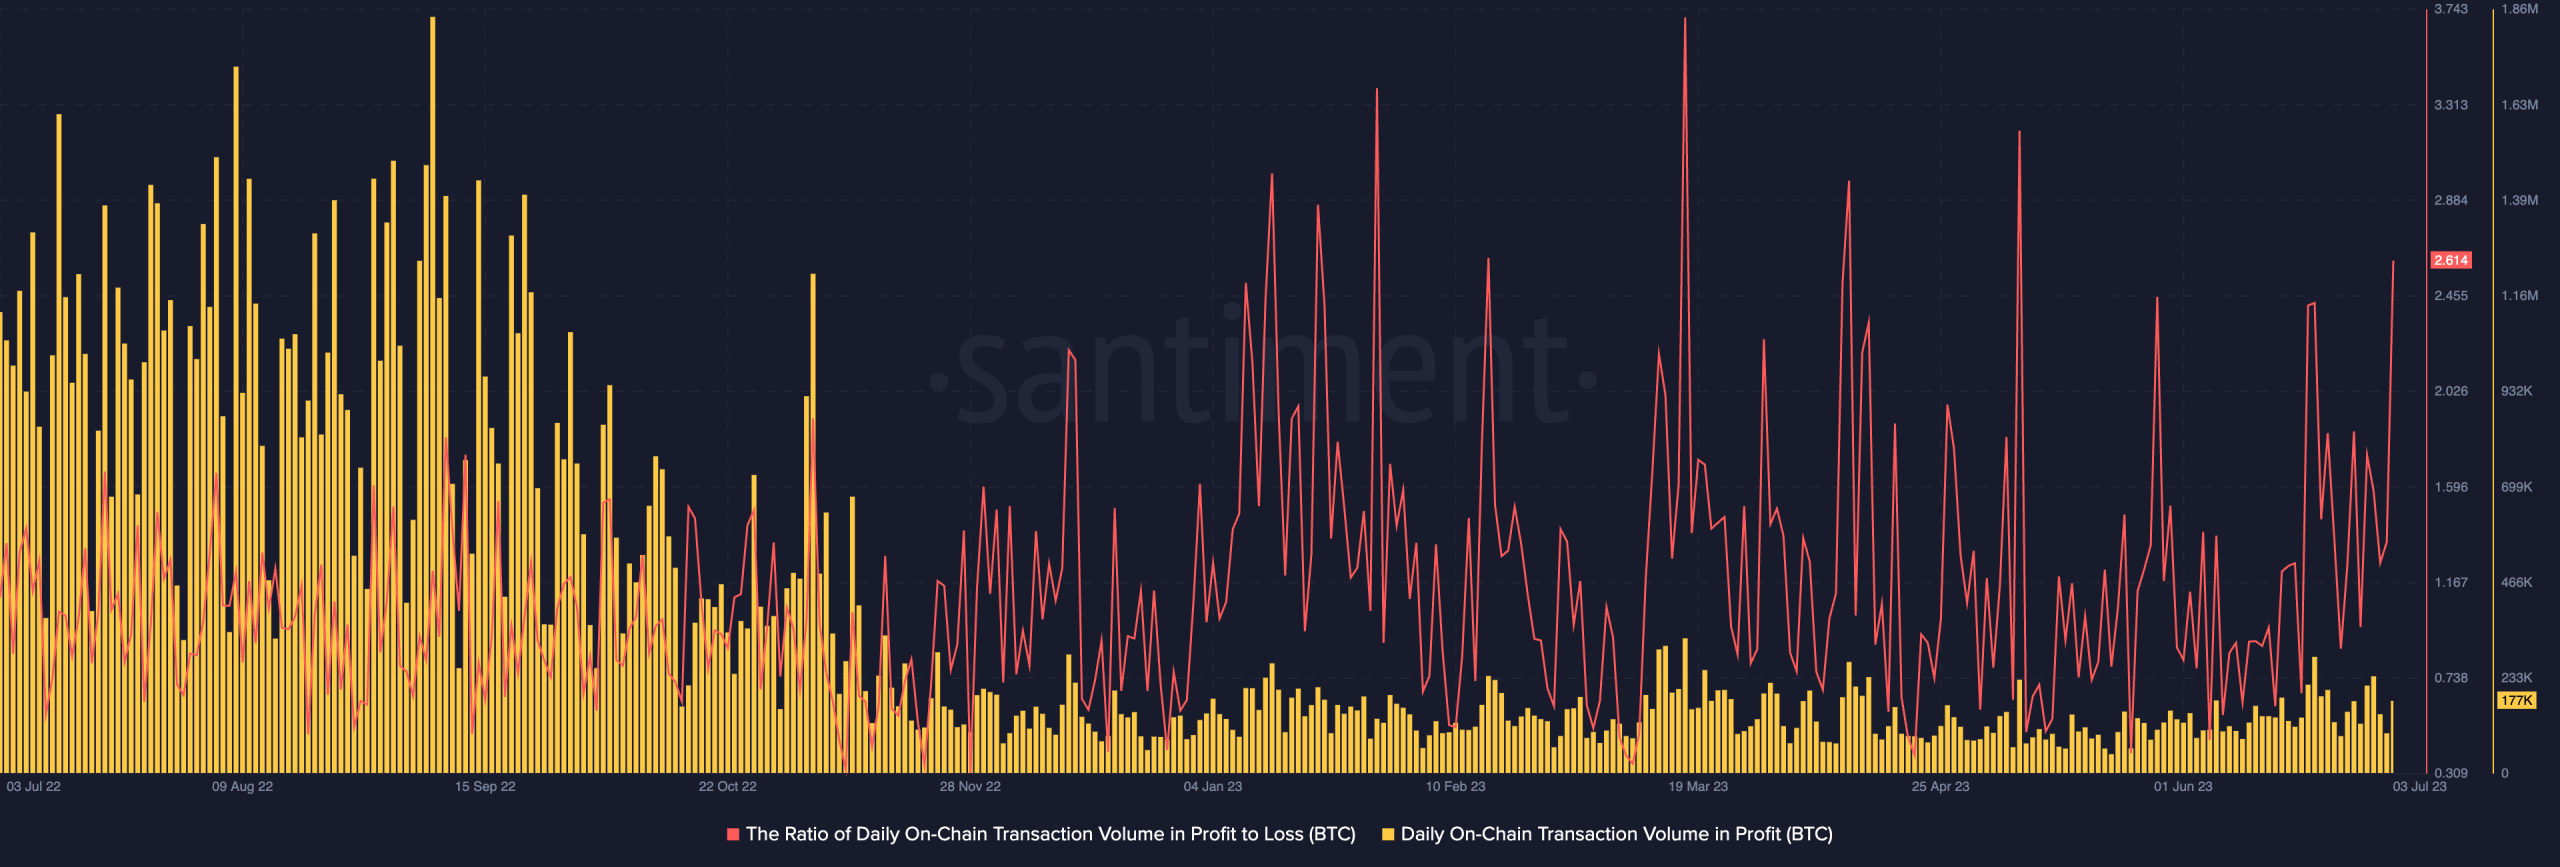
Further, a look at the ratio of BTC’s on-chain transaction volume in profit to loss spike showed that BTC profit-taking transactions have been happening twice as fast as loss-taking transactions for several weeks.
Thus, a price cool-off might follow if profit-taking activity continues at this pace.
On the price chart, BTC’s price rested close to the upper band of its Bollinger Bands indicator. This suggested that the coin’s price was nearing the upper limit of its recent price range. It is often taken as an indication of a potential price pullback.
Is your portfolio green? Check out the Bitcoin Profit Calculator
Key momentum indicators such as the Relative Strength Index (RSI), Money Flow Index (MFI), and Chaikin Money Flow (CMF) were positioned above their respective center lines (suggesting ongoing coin accumulation). However, BTC’s Aroon Up Line (orange) was in a downtrend at 21.43%.
When an asset’s Aroon Up line is close to zero, the uptrend is considered weak.