Bitcoin
Bitcoin will see a price correction before crossing $70K – Here’s why
A key indicator flashes a sell signal on Bitcoin’s chart, hinting at a price correction soon.


- Bitcoin’s price increased by over 5% in the last seven days.
- Most metrics and indicators suggest a price correction.
Bitcoin [BTC] investors were sitting tightly as the king of cryptos was inching towards $70k once again.
However, it might take a bit long for BTC to reclaim that mark as a key metric hinted at a price decline in the coming days.
Bitcoin has trouble ahead
CoinMarketCap’s data revealed that the king of cryptos’ price increased by more than 5% in the last seven days.
At the time of writing, the coin was trading at $69,420.39 with a market capitalization of over $1.37 trillion. The upward trajectory gave investors hope that BTC would once again touch $70.
However, Ali, a popular crypto analyst, recently posted a tweet that suggested otherwise. He mentioned the TD sequential indicator as it flagged a sell signal, hinting at a price drop.
Each time the indicator flagged buy/sell signals since February, BTC’s price has witnessed significant movements.
Therefore, AMBCrypto planned to take a closer look at BTC’s state to see whether a price correction was inevitable.
As per our analysis of CryptoQuant’s data, selling pressure on BTC was increasing as its Exchange Reserve rose. Its Exchange Netflow Total was high compared to the last seven-day average, further hinting at a sell-off.
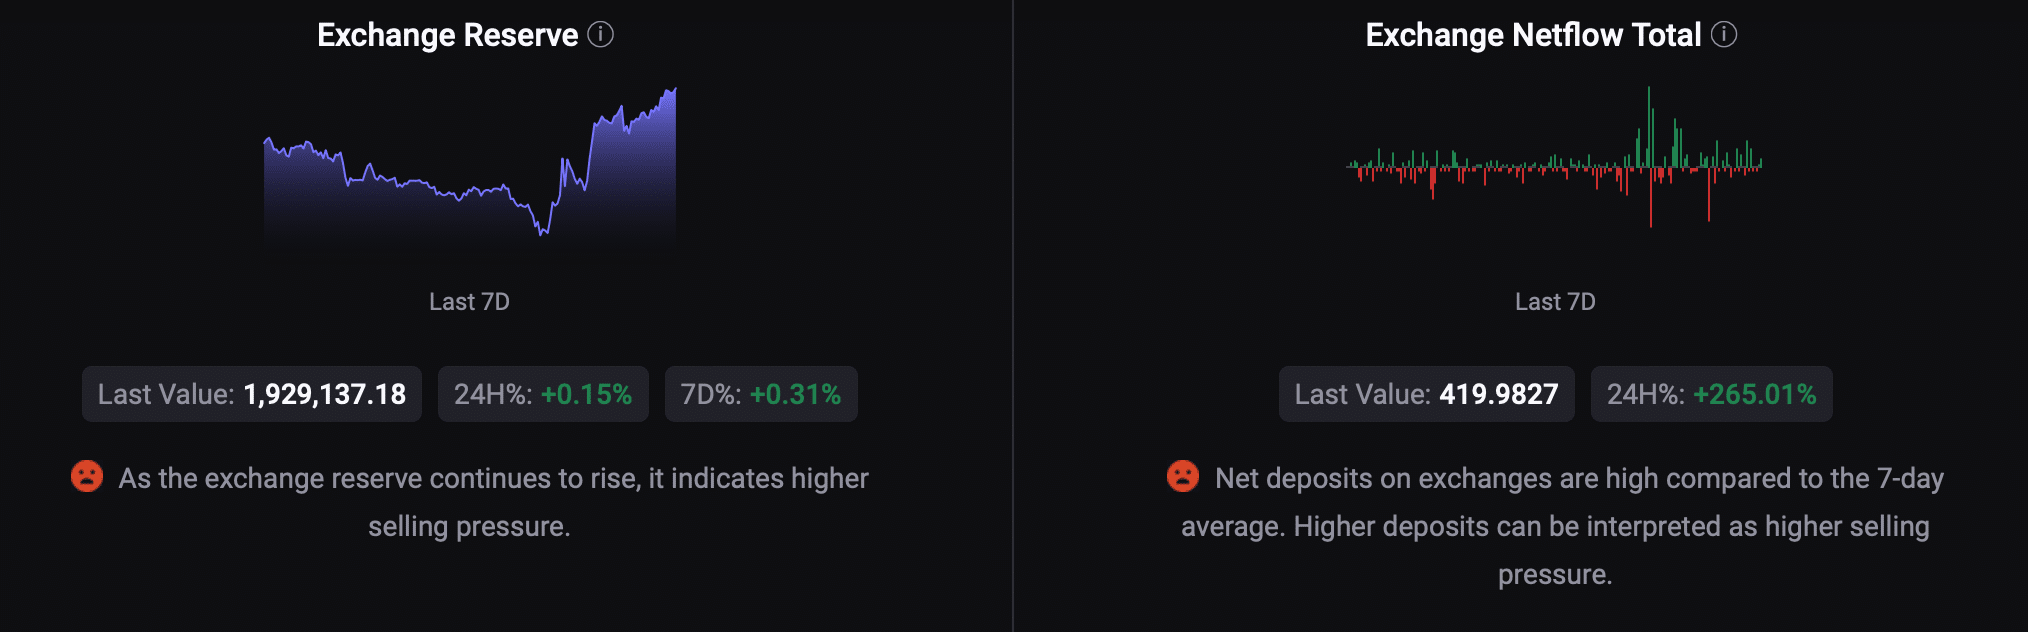
Source: CryptoQuant
Apart from this, BTC’s aSORP was red, meaning that more investors are selling at a profit. In the middle of a bull market, it can indicate a market top.
Its ULP revealed that investors were in a belief phase, where they have unrealized profits. Another bearish metric was the Fear and Greed Index, as it revealed that the market was in an “extreme greed” position.
Whenever the metric hits that level, the chances of a price correction increase.
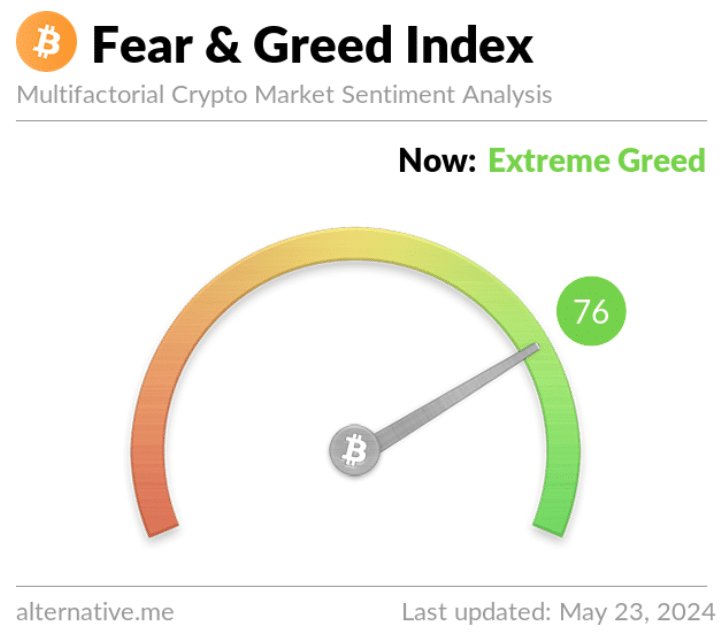
Source: Alternative.me
Bitcoin’s road ahead
AMBCrypto then analyzed Bitcoin’s daily chart to see what technical indicators suggested. As per our analysis, BTC’s Money Flow Index (MFI) registered a sharp downtick.
Its Relative Strength Index (RSI) also moved sideways in the last few days.
On top of that, the Chaikin Money Flow (CMF) moved southward, indicating that BTC might witness a correction before its price touched $70k again.
Nonetheless, the MACD remained in buyers’ favor as it displayed a bullish upperhand in the market.
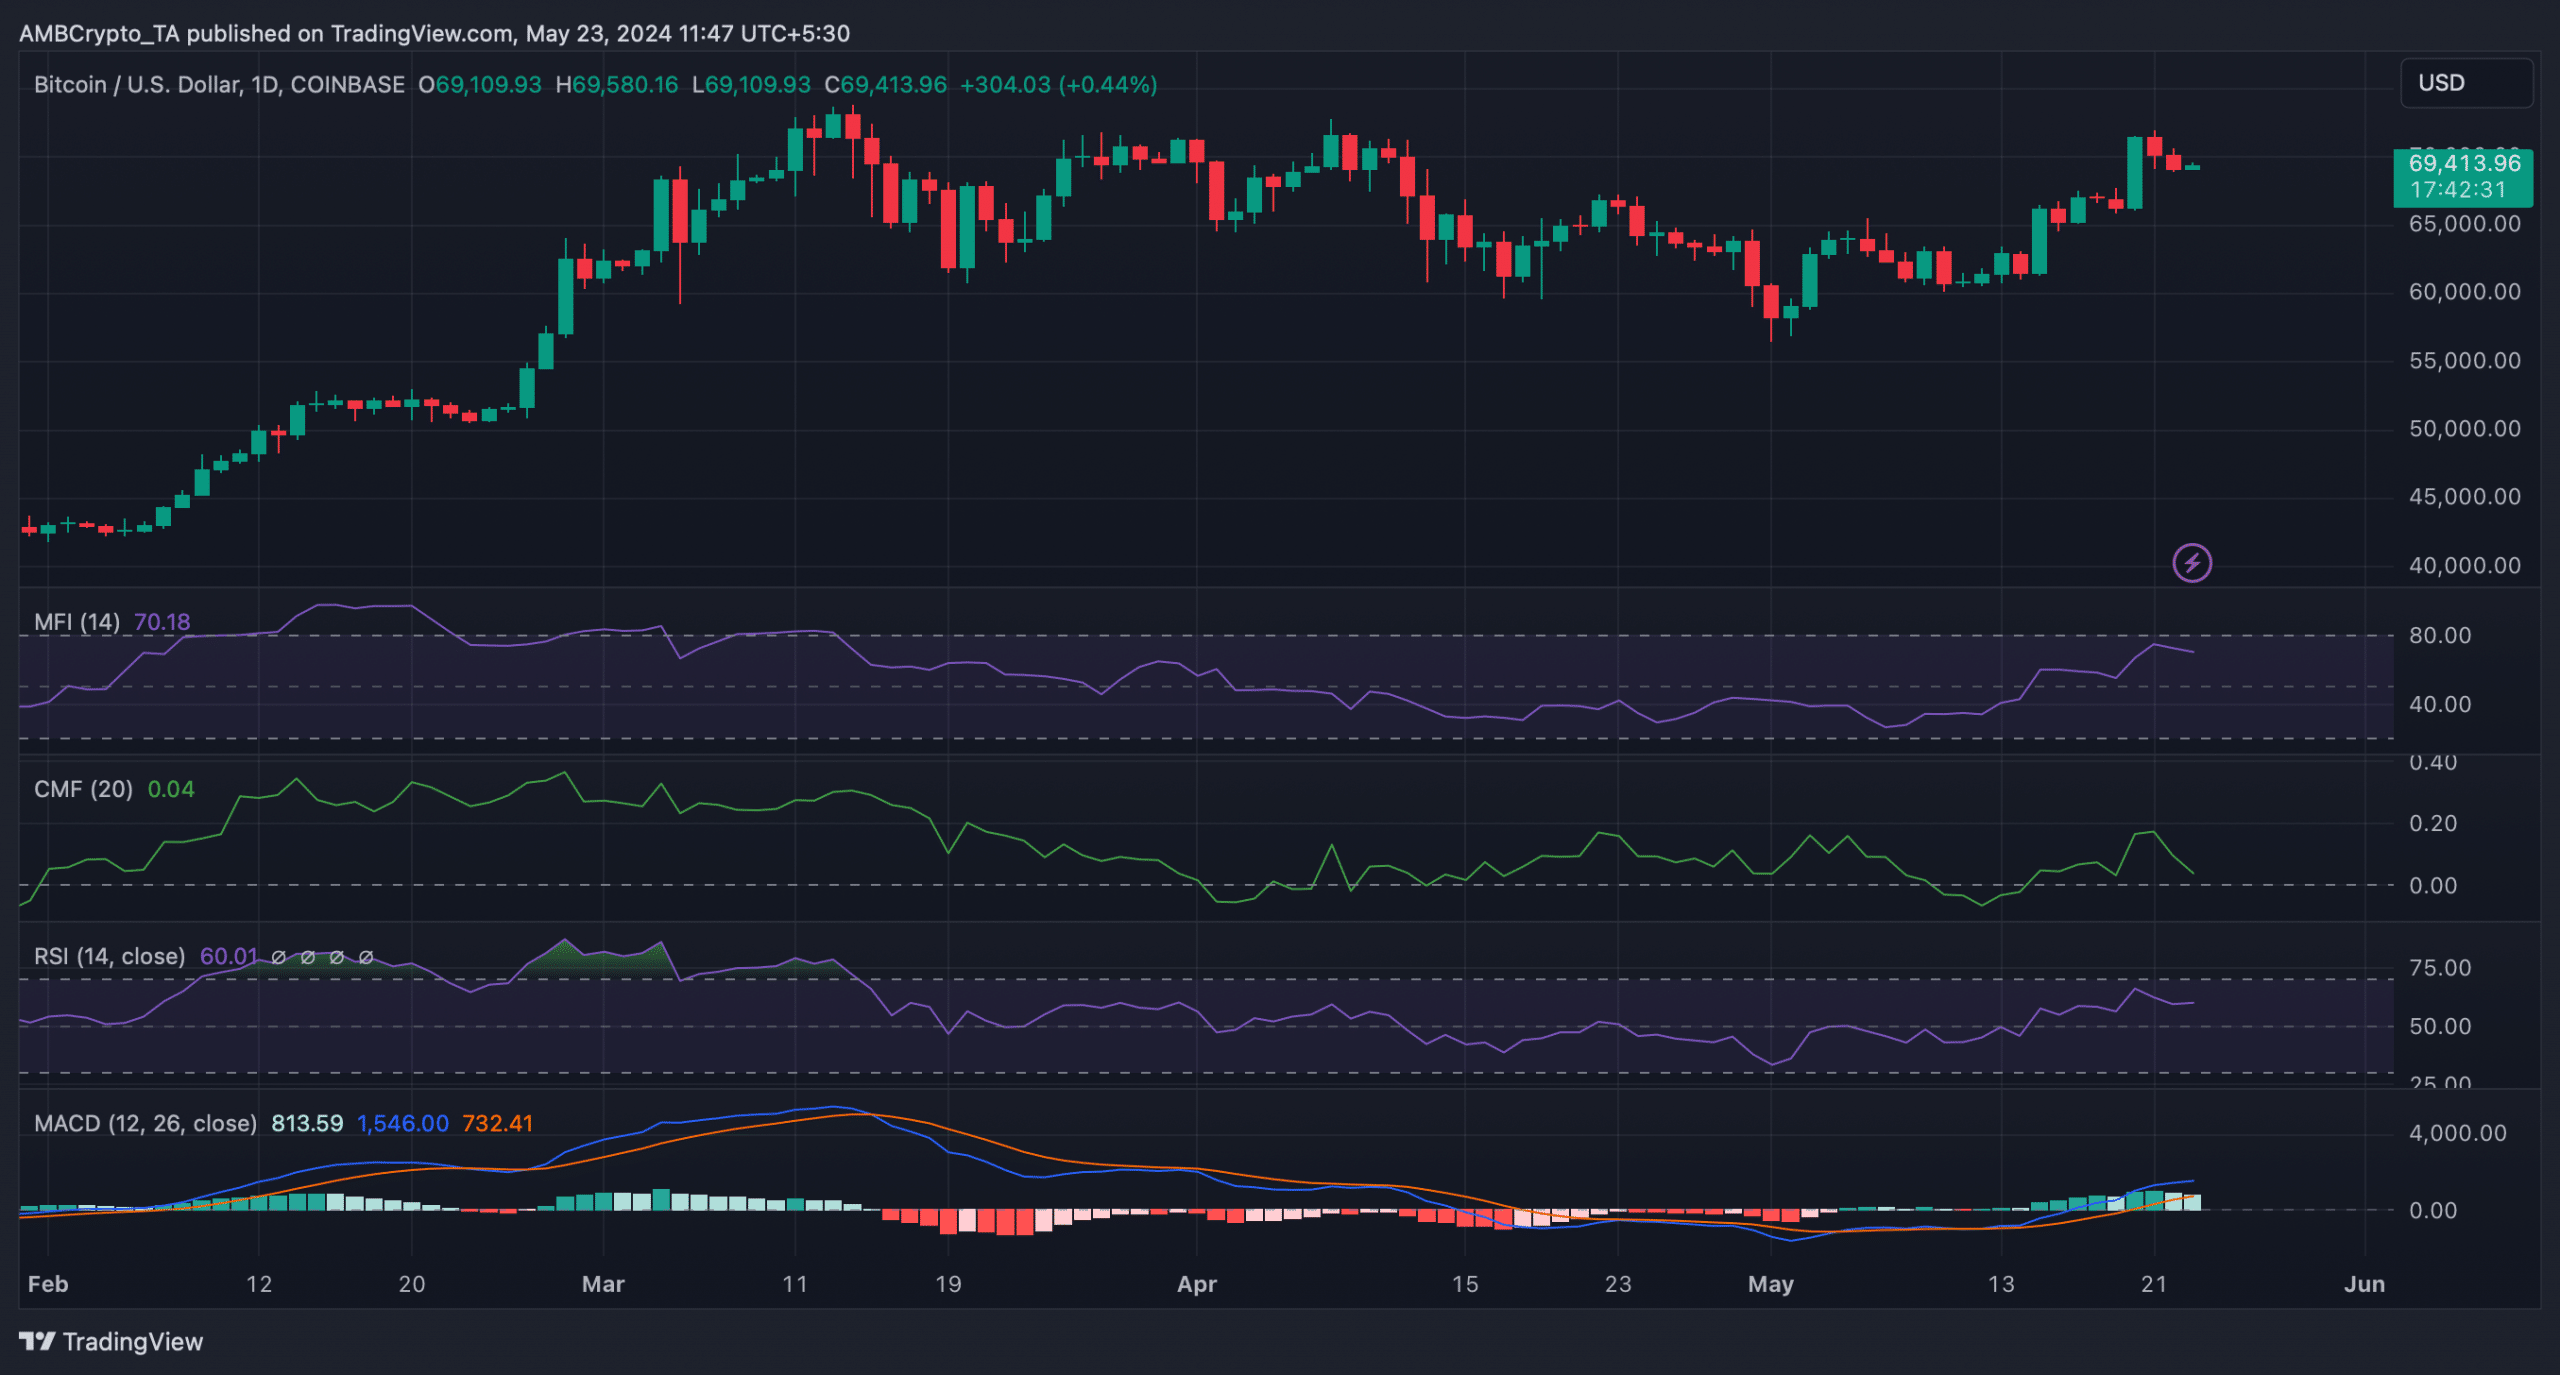
Source: TradingView
Read Bitcoin’s [BTC] Price Prediction 2024-25
We then took a look at Hyblock Capital’s data to determine where BTC’s price might plummet if a price correction actually happens.
We found that BTC has support near the $68.8k mark, as liquidation would rise sharply at that level. If BTC fails to test that support, then its price might as well drop to $64.4k again.
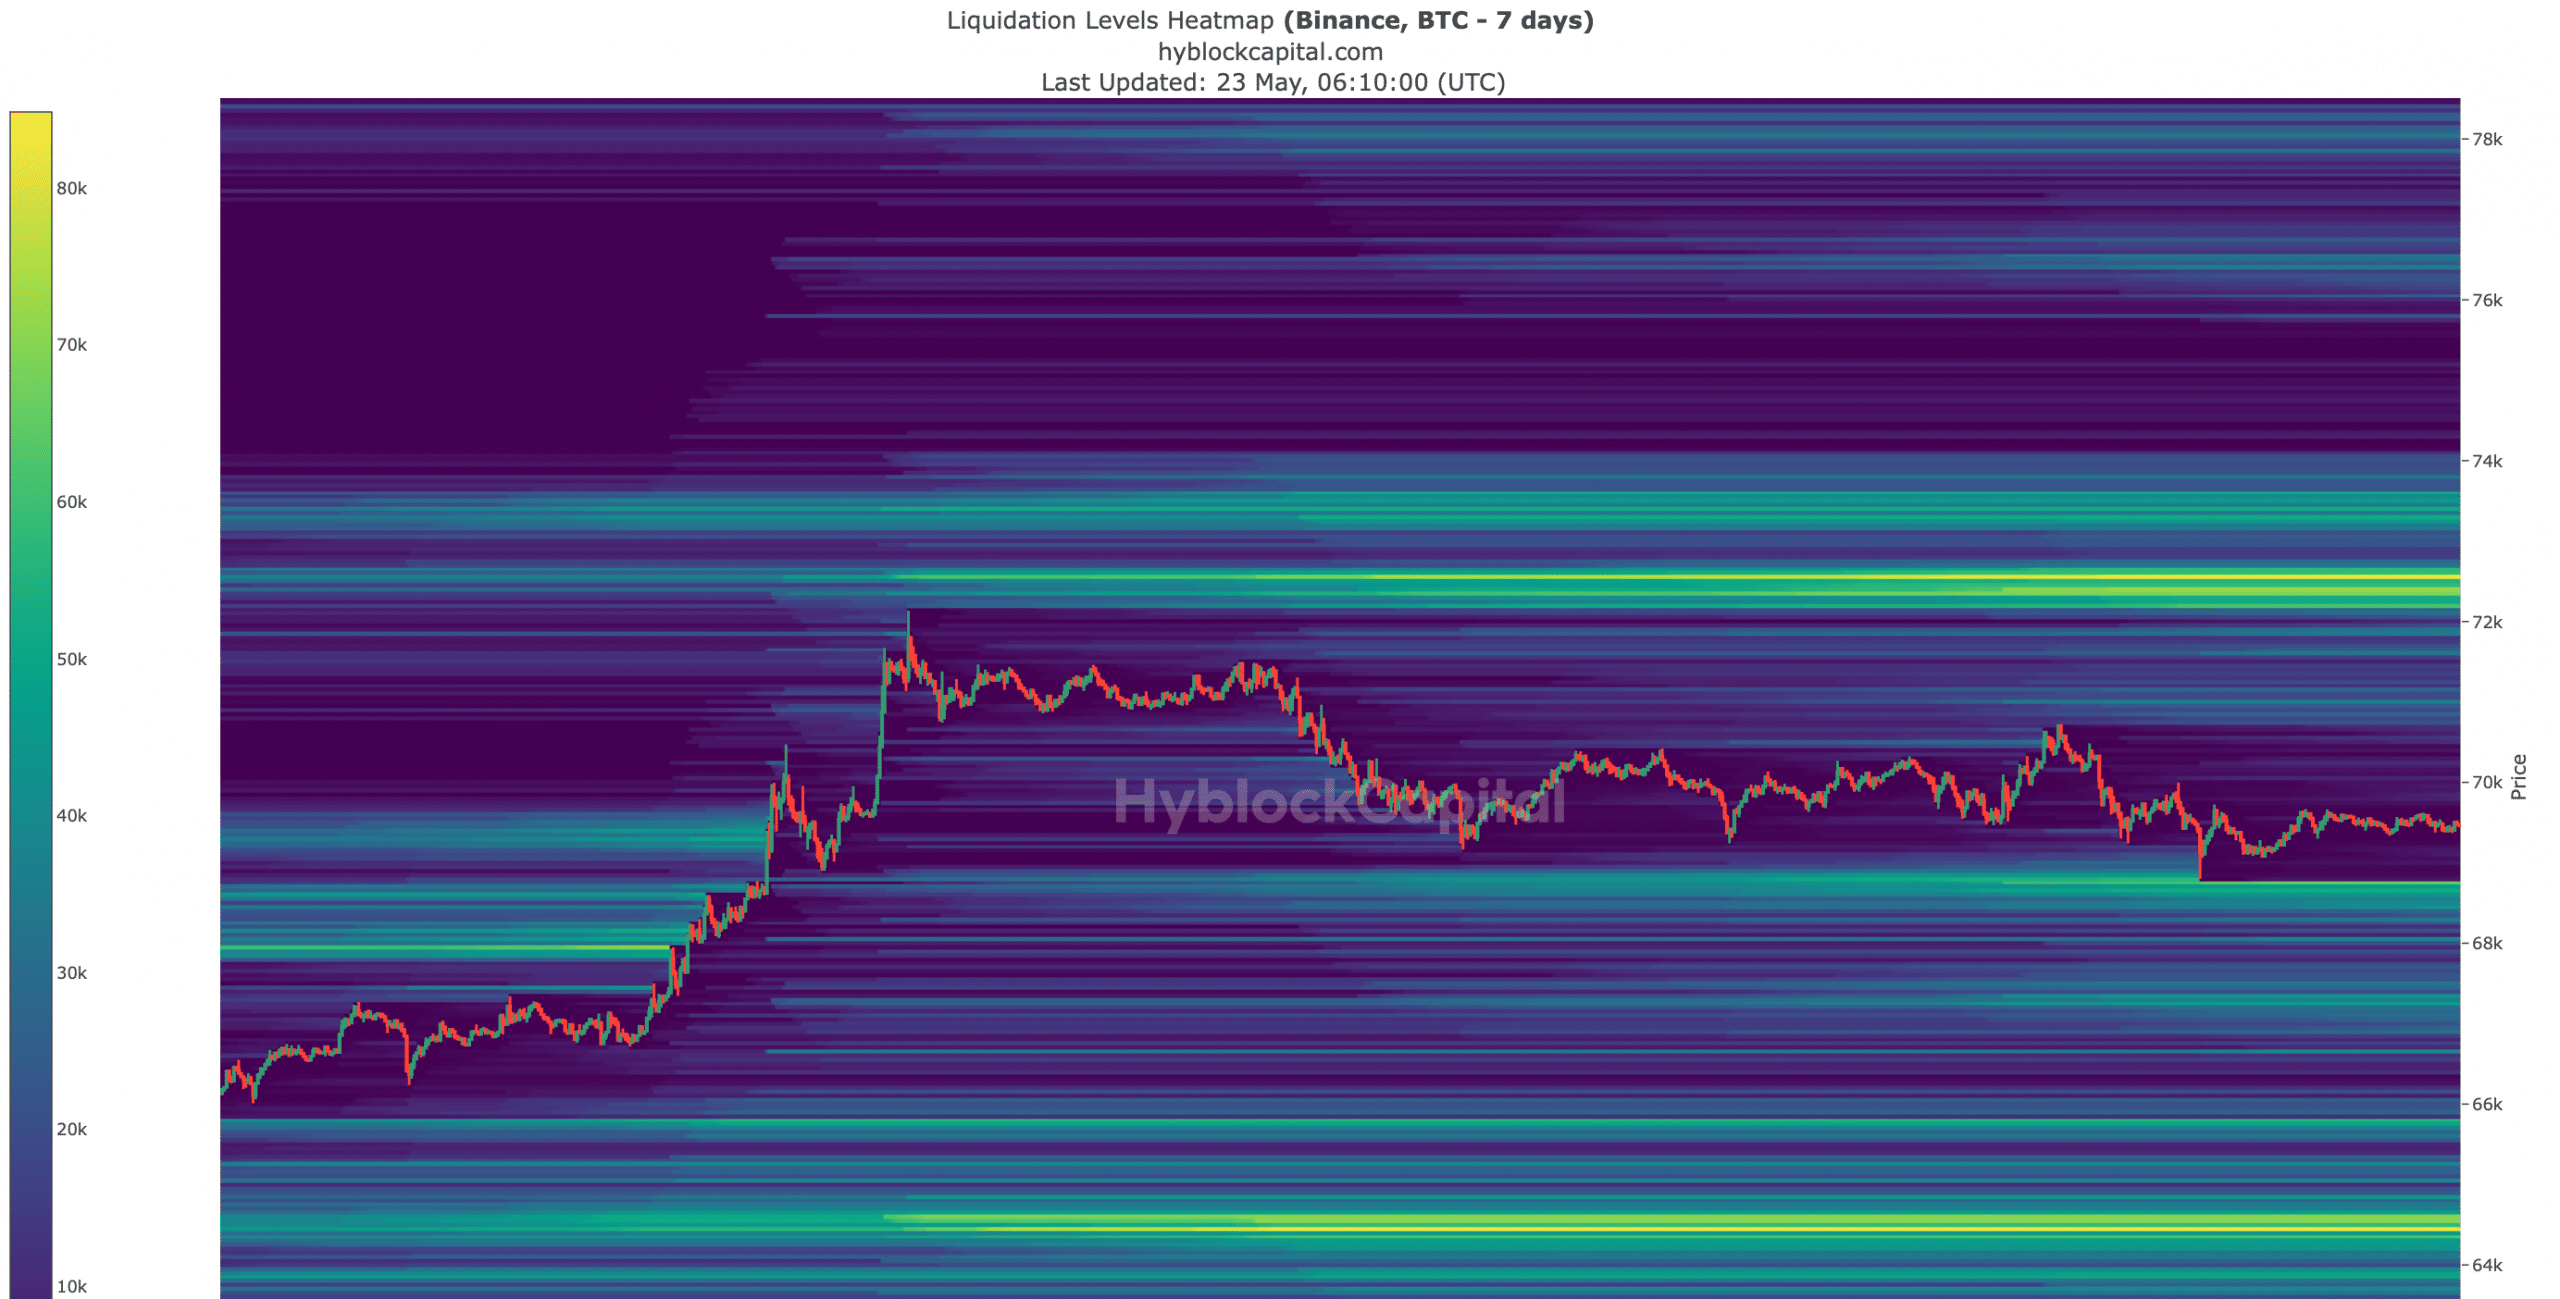
Source: Hyblock Capital