Bitcoin
Bitcoin – Will September 2024 mirror what BTC’s price did in September 2016?
Bitcoin’s ongoing price trend is mirroring a lot of what it saw a few years back.
- Bitcoin trend strength prophesy fulfilled.
- Bitcoin volatility dwindling as percent in profit reduces.
Bitcoin [BTC] has once again demonstrated its cyclical nature, with the Bitcoin Trend Strength Prophecy being fulfilled.
In 2016, Bitcoin’s price dipped into the support zone in September, and the same pattern has emerged in 2024.
Throughout these alternating cycles, the market’s movement has remained consistent. This pattern of three dips into the support zone during the same cycle has historically led to a price move higher.
As in previous years, the current cycle might mean that Bitcoin’s price could be setting up for another surge on the charts.
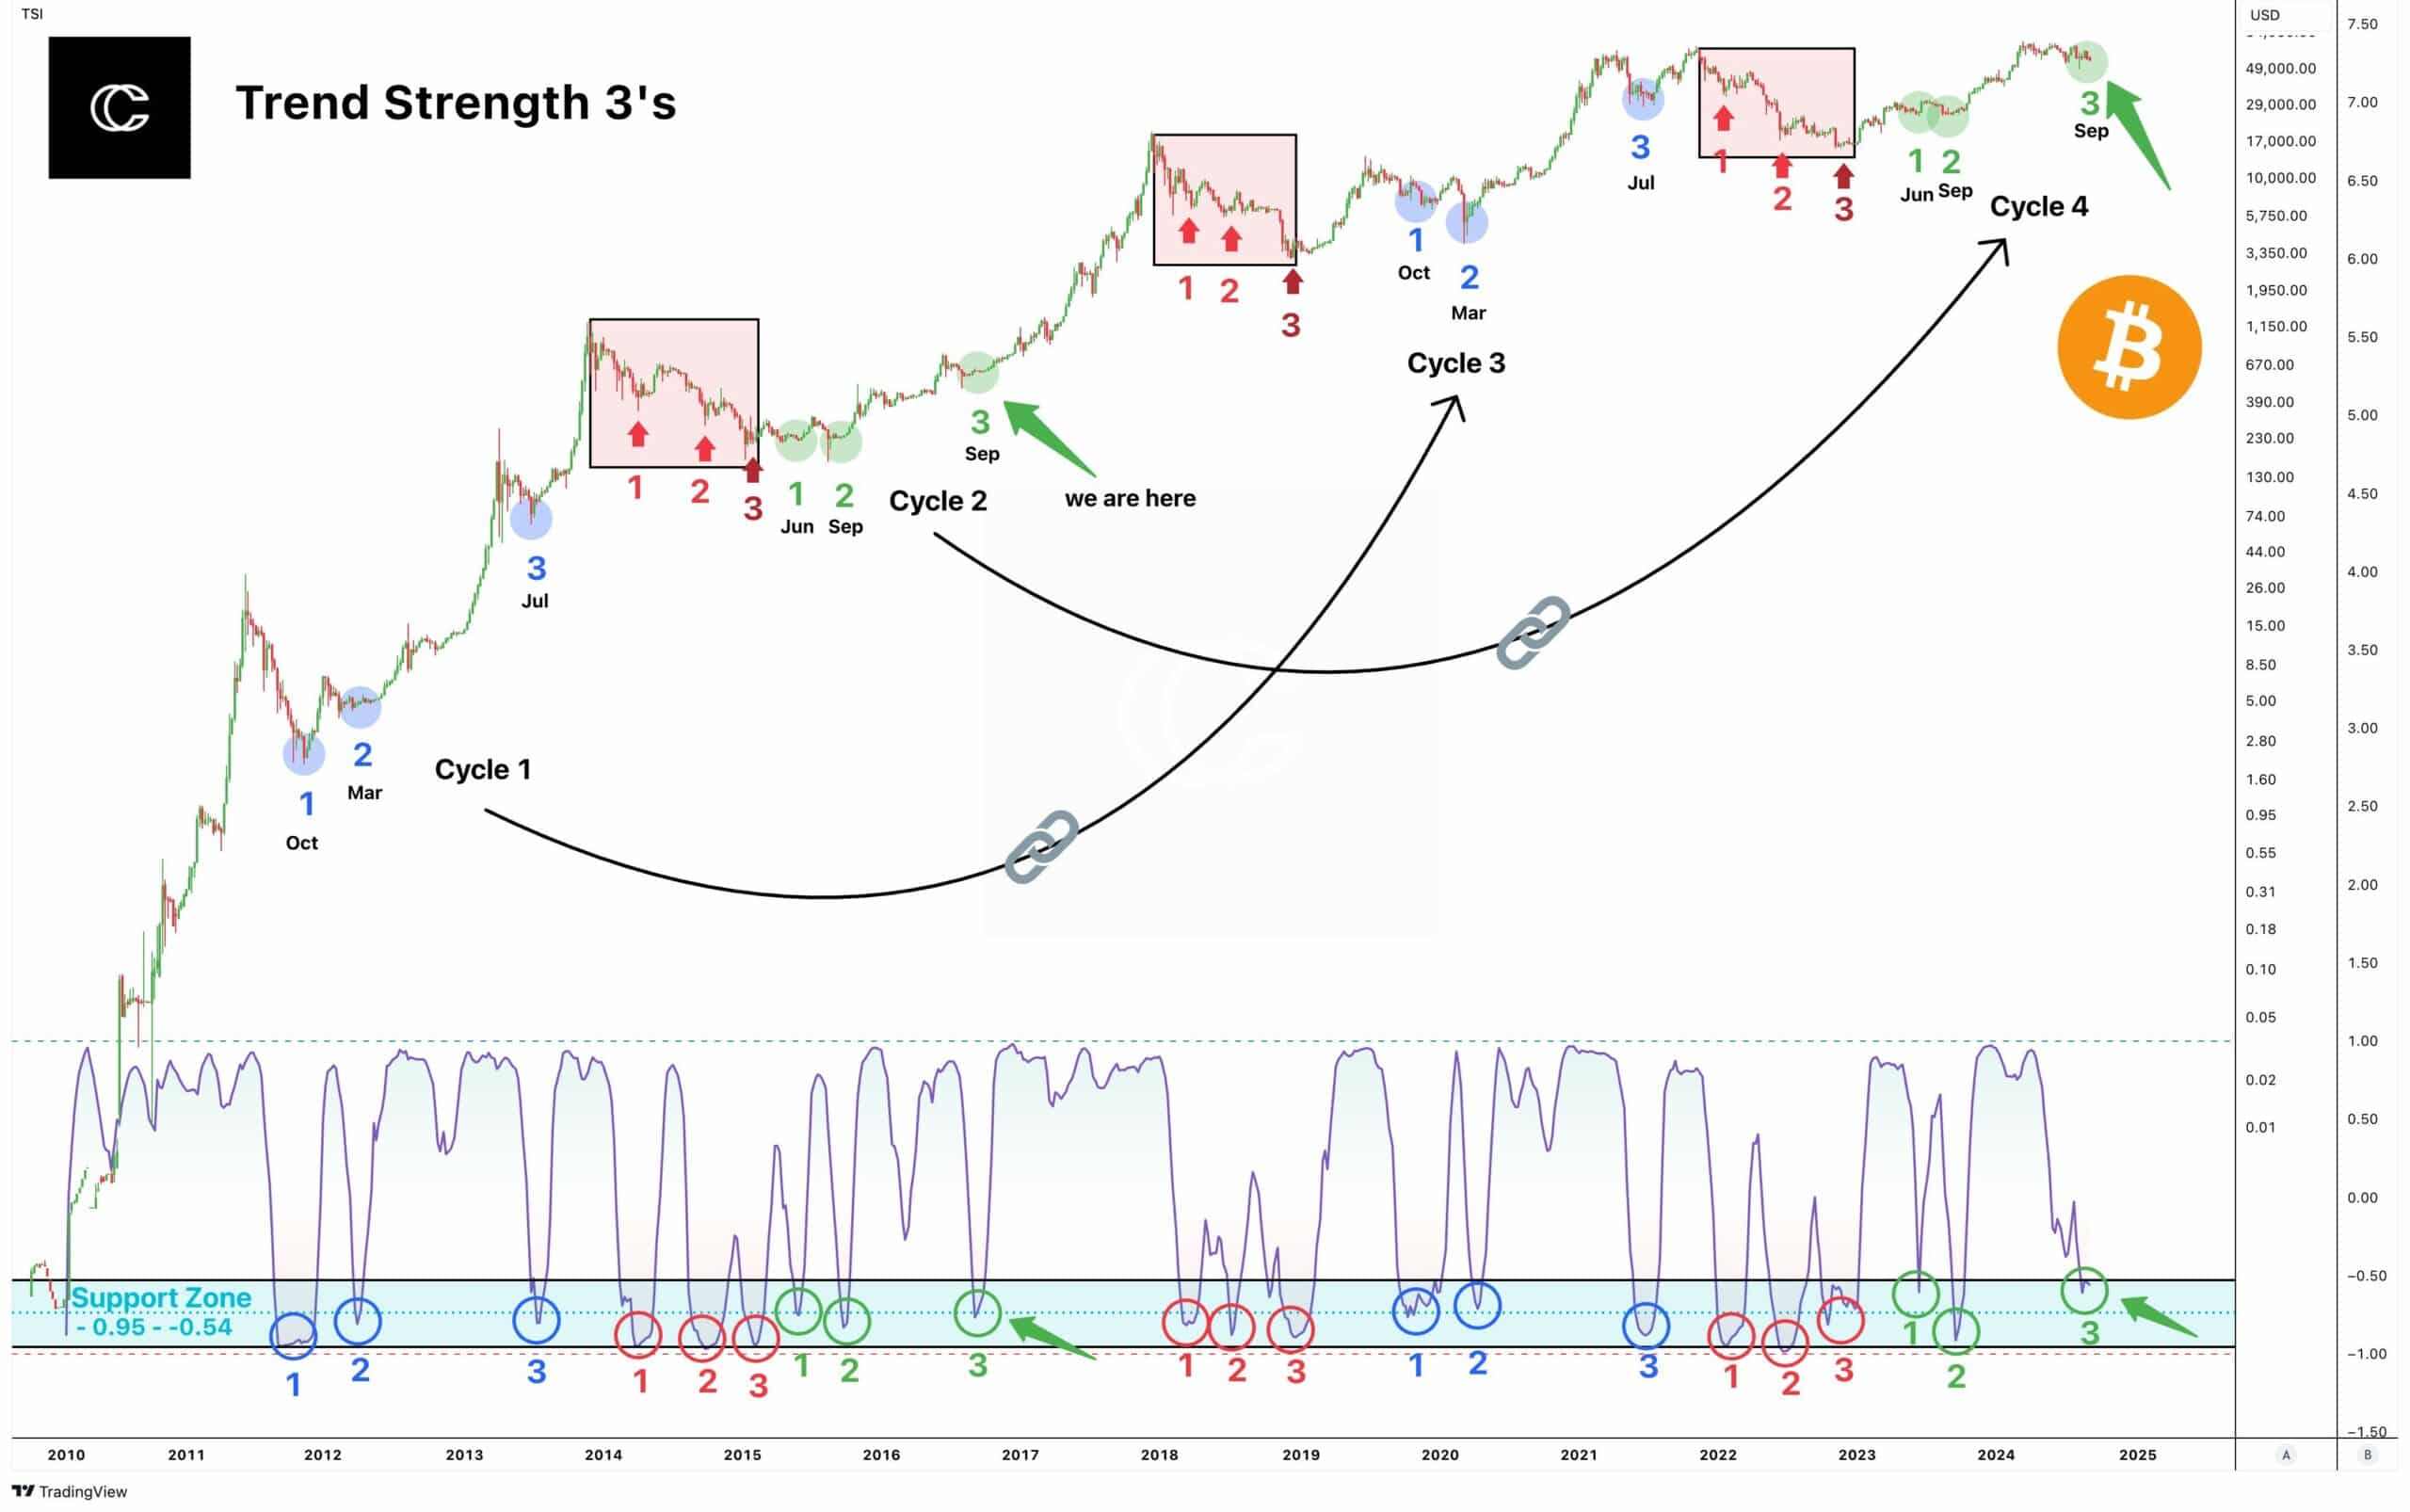
Source: TradingView
At the time of writing, Bitcoin was trading at a key support level around the $56k price range, with a strong resistance level at $65k. This newly-formed support level could either trigger a bounce or result in further decline.
If Bitcoin fails to hold above $56k, it may continue to go south and retest $49k before making any substantial recovery. However, holding this level could signal a move higher for BTC in the coming weeks.
Liquidity levels
In terms of liquidity, sell orders have pushed Bitcoin’s price down, allowing buy orders to be filled. There are numerous bids resting below the $59k-level, and this has been the case for the past six months.
Interestingly, the price has remained flat despite significant whale activity, as large holders pushed prices lower to accumulate more BTC.
Here, it’s worth pointing out that Binance’s order books revealed a strategy of filling bids at these levels before the price rises again.
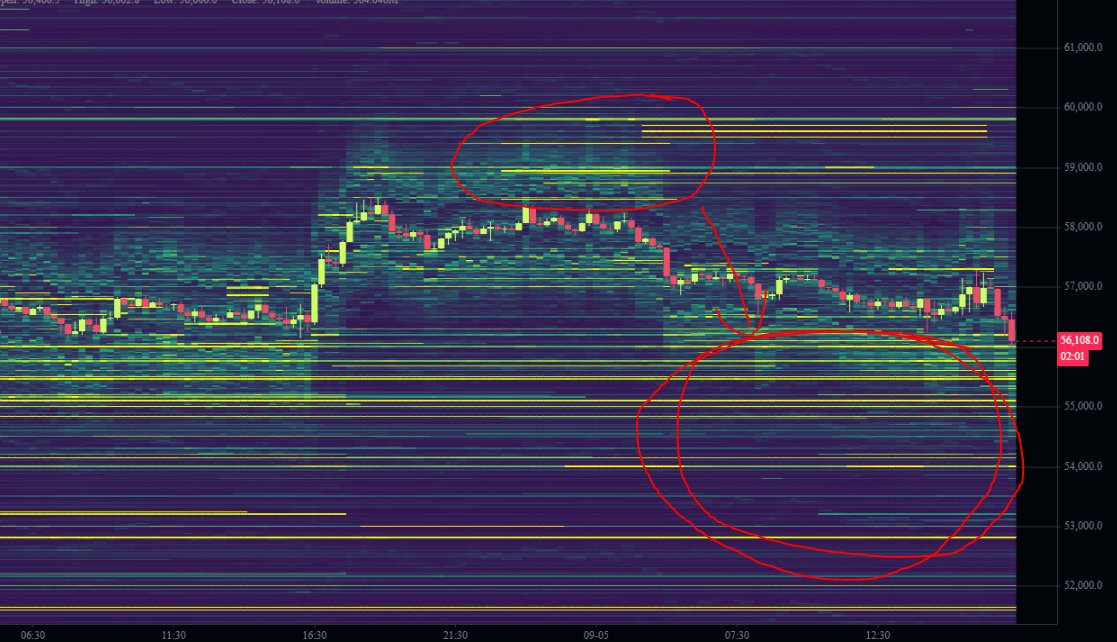
Source: Hyblock Capital
Bitcoin’s volatility is dwindling
Another factor influencing Bitcoin’s trajectory is its volatility. With BTC now trading at around $56k, it is significantly less volatile than in 2021 — Around 4 to 6 times less volatile, in fact.
The $60,000-level, once considered a speculative top, has now become a consolidation zone where long-term holders accumulate Bitcoin.
This means that $60,000 is now the new floor, a crucial price point that Bitcoin might not revisit for some time as new support levels are established.
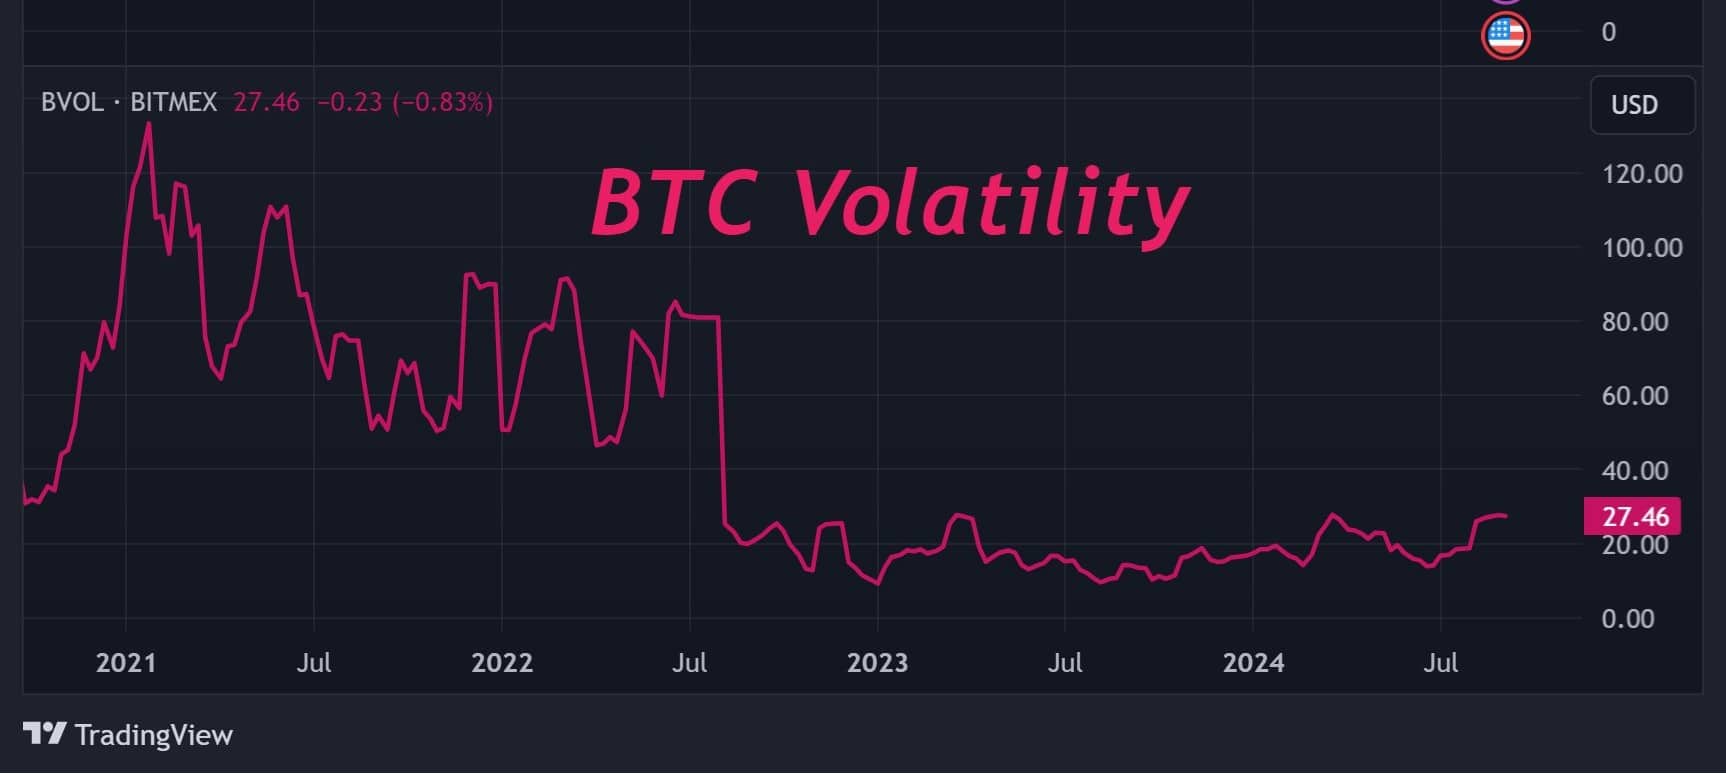
Source: TradingView
Fear and greed index
Market sentiment, at press time, also seemed to mirror the fear seen at the bottom in 2022. The pervasive fear in the market has many investors on the sidelines, but this could signal an opportunity for a reversal.
With institutional adoption increasing and more projects building on Bitcoin’s network, this current downturn might represent a significant buying opportunity.
In fact, history has shown that such fear can often precede major upward moves in price.
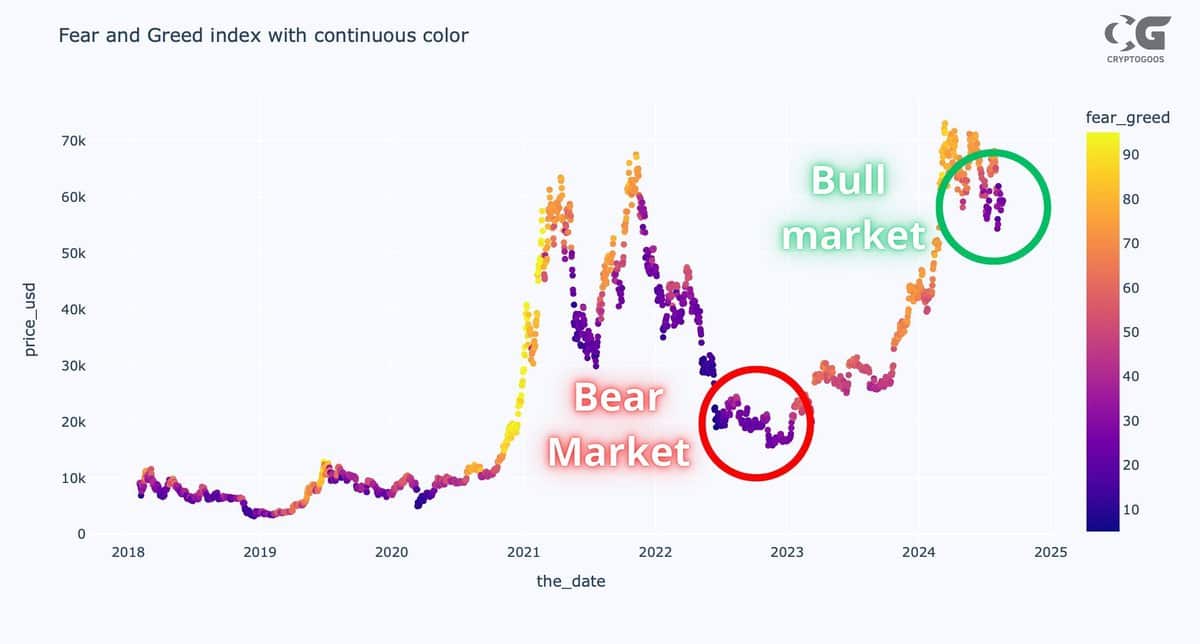
Source: X
Percentage supply in profit
Despite the uncertainty, however, the percentage of Bitcoin supply in profit has dropped by 25%, meaning fewer investors are making gains. Roughly 4,938,183 BTC are currently held at a profit, valued at around $280 billion.
This fall in profitable positions suggests that now might be the time for long-term holders to HODL. Especially as the market could be poised for a recovery and higher BTC prices in the near future.
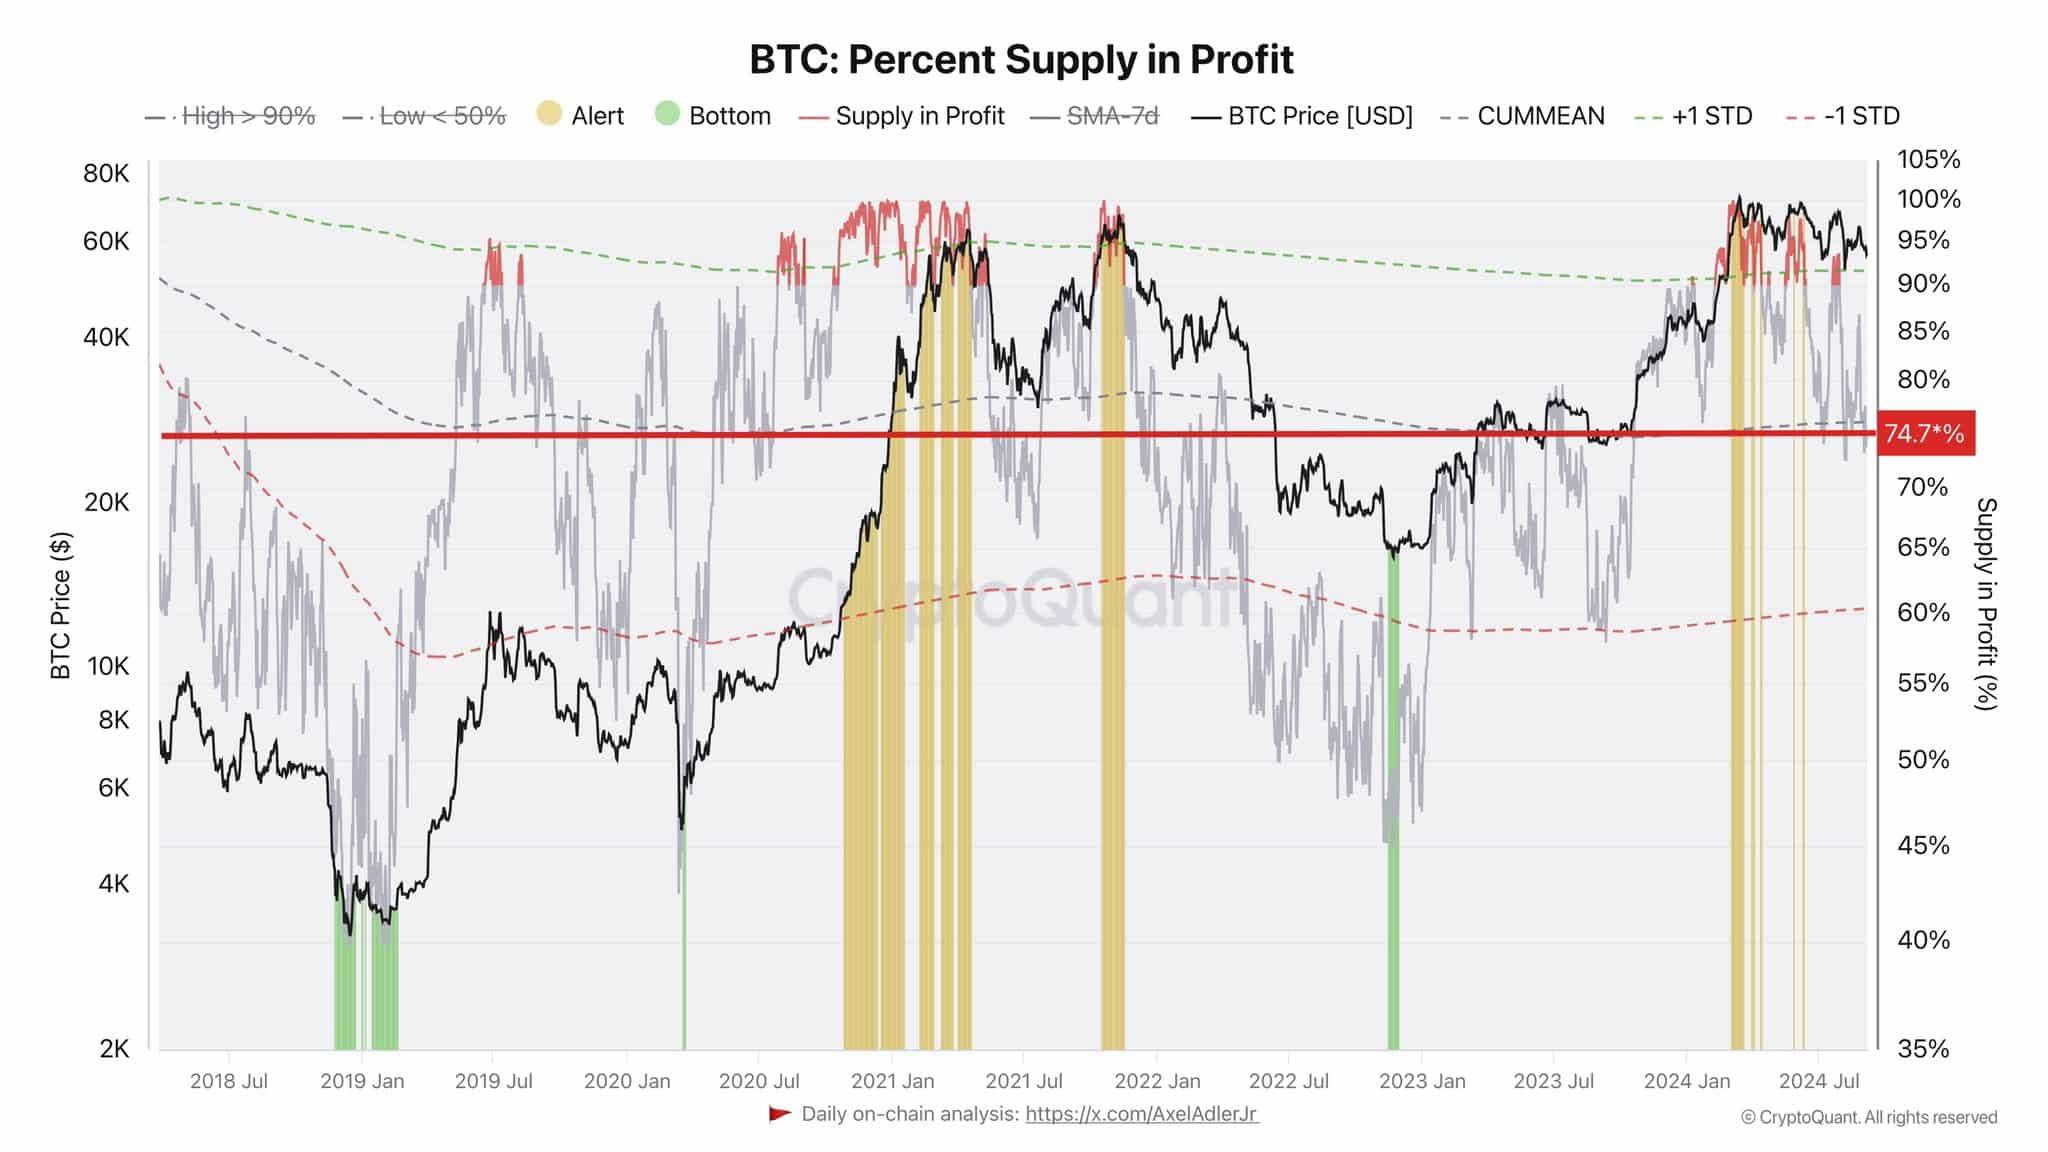
Source: CryptoQuant