Bitcoin: Your guide to how to identify the next ‘bottom’
Even though last week was a consolidation phase no one was fond of, it was a much-needed breather for BTC’s price trajectory. Bitcoin’s price was oscillating around the range of $60k – $62.5k for the most part of the last fortnight. And, just when everyone thought a correction to $55K may be due, Bitcoin surprised the market with a move above $65k as the second week of November began.
Nonetheless, there seemed to be some clear signs of a breakout, even as BTC continued its rangebound movement. At the time of writing, Bitcoin was trading at $66,027.5 noting close to 6.74% daily and 6.07% weekly gains.
Impatience triggering the rally
Over the last week, as traders watched Bitcoin remain in the low $60k range, there appeared to be a shift in optimism. In fact, many became impatient with the stagnancy of the price movement.
However, a shift towards negative sentiment implied a greater chance of BTC’s price rising over the coming days. And, the high daily gains on 8 November were proof of the same.
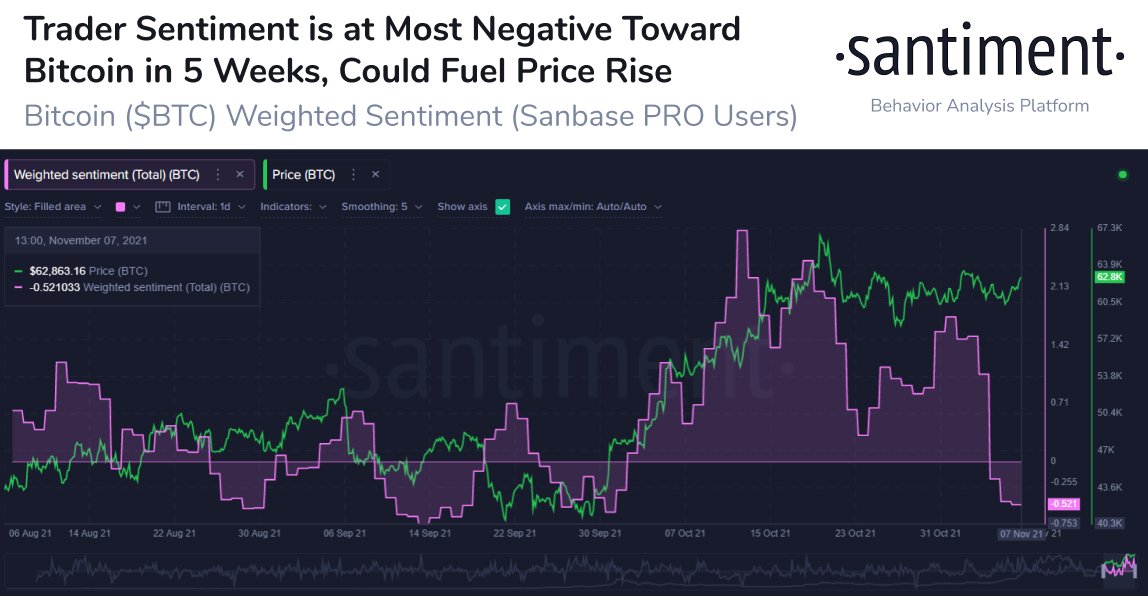
Further, BTC noted the highest weekly close ever as its November first week candle closed above $62k. Looking at the price structure, even during the consolidation, it was clear that the price still favored bulls. So, seems like paying attention to every candle over a shorter timeframe was equivalent to paying heed to noise.
In fact, it was also evident that higher lows led to higher highs. As Bitcoin entered the second week of November with some heightened expectations from the crowd retesting the $65k – $67k resistance, a new ATH seemed within reach.
At this point, many are worried about missing the perfect Bitcoin bottom. Well, as analysts have pointed out, catching the real BTC bottom would now be like winning a lottery. However, there are indicators that might help establish one.
Catching the bottom
The UTXO Count Shock Ratio Oscillator allows you to look out for ideal sell or buy signals. As seen in the image below, the vertical green line is a potential buy signal and the red vertical line is a possible sell signal.
Interestingly, it makes it possible in most cases to buy almost at the very bottom and sell almost at the very top.

Since it flashed a buy signal at the $61,527-mark, BTC is now well above the bottom, with recovery underway. However, a fall to $60k-$61k will still mean another buying opportunity.
That being said, BTC exchange balances are still at the lower low as the funding rate remains the same. In light of the derivative netflows, it could mean that the accumulation foreshadows a much higher all-time high.


