Bitcoin’s $12.2K nosedive: Where are the signs of recovery?
Bitcoin's heatmap shows that the $60.6k level saw huge liquidations during the recent plunge.

- Bitcoin saw a huge number of liquidations triggered during the recent drop.
- The higher timeframe price chart was bullish, but investors need to HODL.
Bitcoin [BTC] endured double-digit losses in the past five days, falling 16.67% from last week’s high at $72.8k to Saturday’s low at $60.6k.
Despite $314 million worth of liquidations in the past 24 hours, the higher timeframe bias was bullish based on technical analysis.
Yet, traders and investors should be prepared for another drop toward the $60k mark. The volatility might not die down soon, especially with the growing risk of a wider regional conflict in the Middle East.
The market structure remained intact
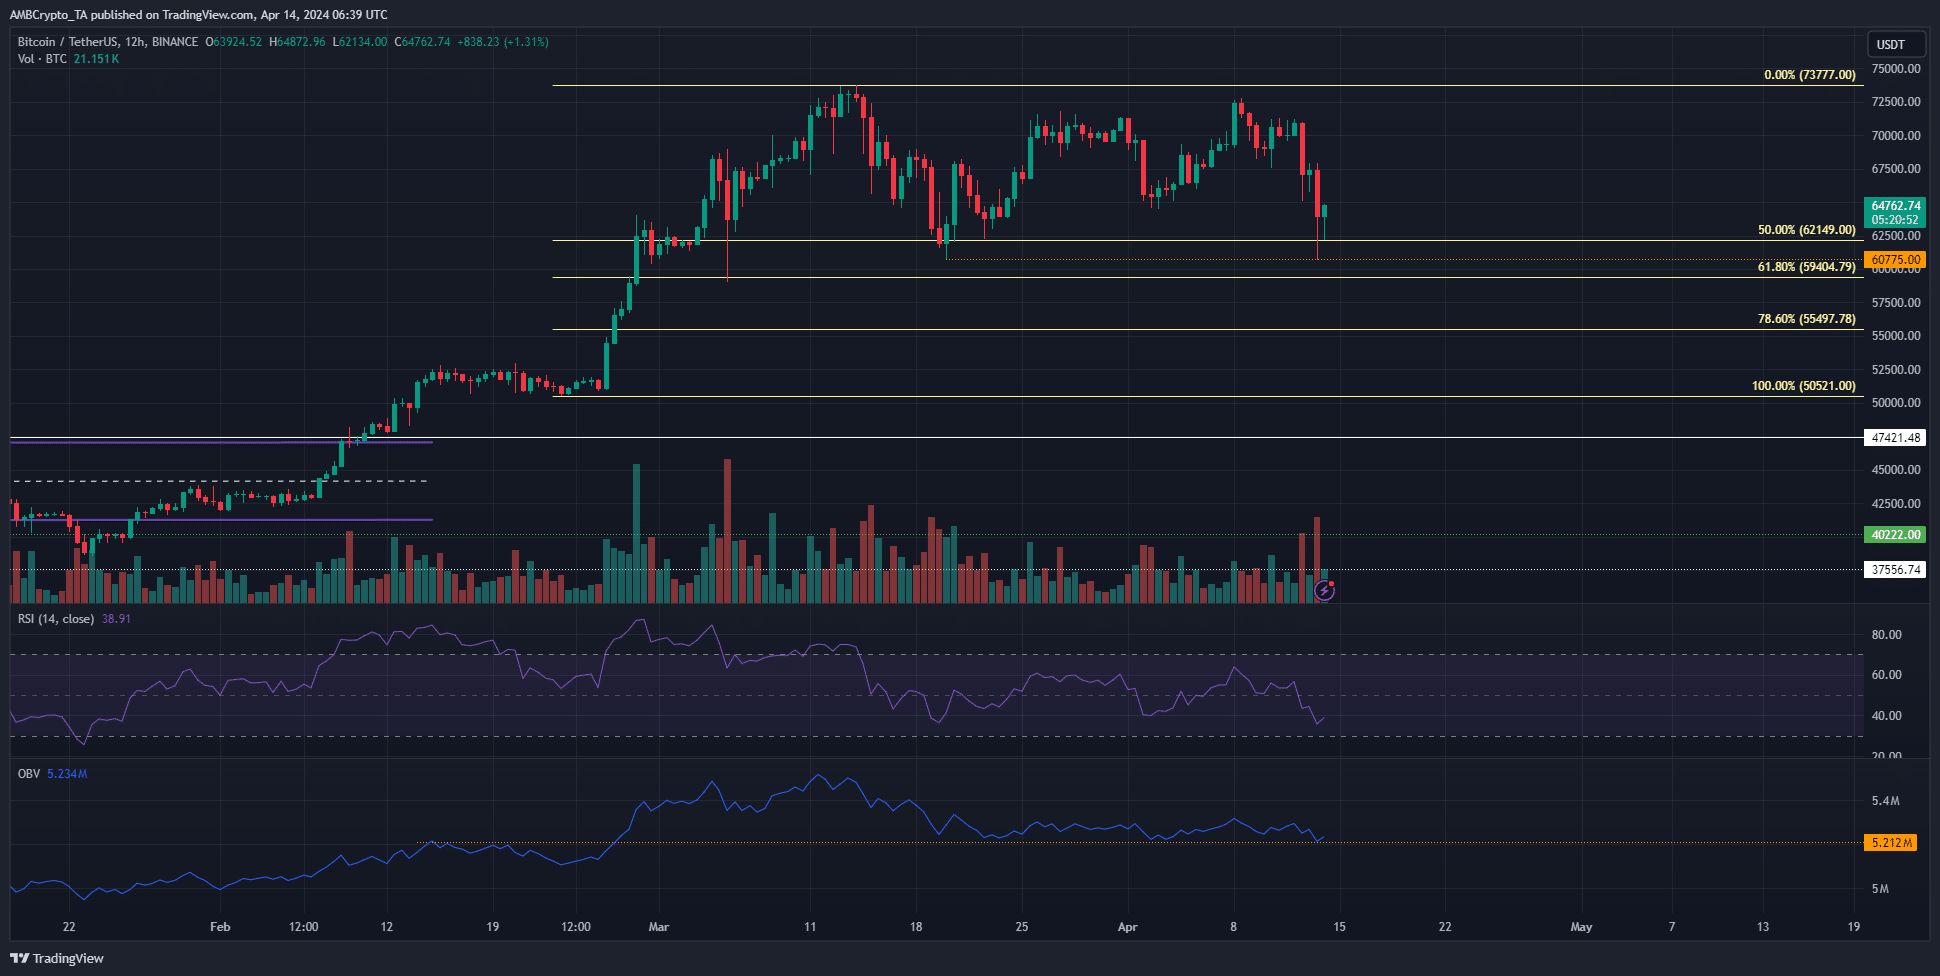
The swing low formed at $60.7k in mid-March did not see a 12-hour trading session close below it during the recent dip. Hence, the structure remained bullish. However, the momentum was in favor of the bears.
The RSI showed a reading of 38.9 at press time. The OBV has tenaciously defended a support level that served as resistance in February. Together, they do not indicate a revival for the bulls has begun.
Bitcoin could see another dip toward the $60k region in April because of the liquidity that could build around the recent low at $60.6k. The heatmap could shed more light on the next price move.
Will we see $55k soon?
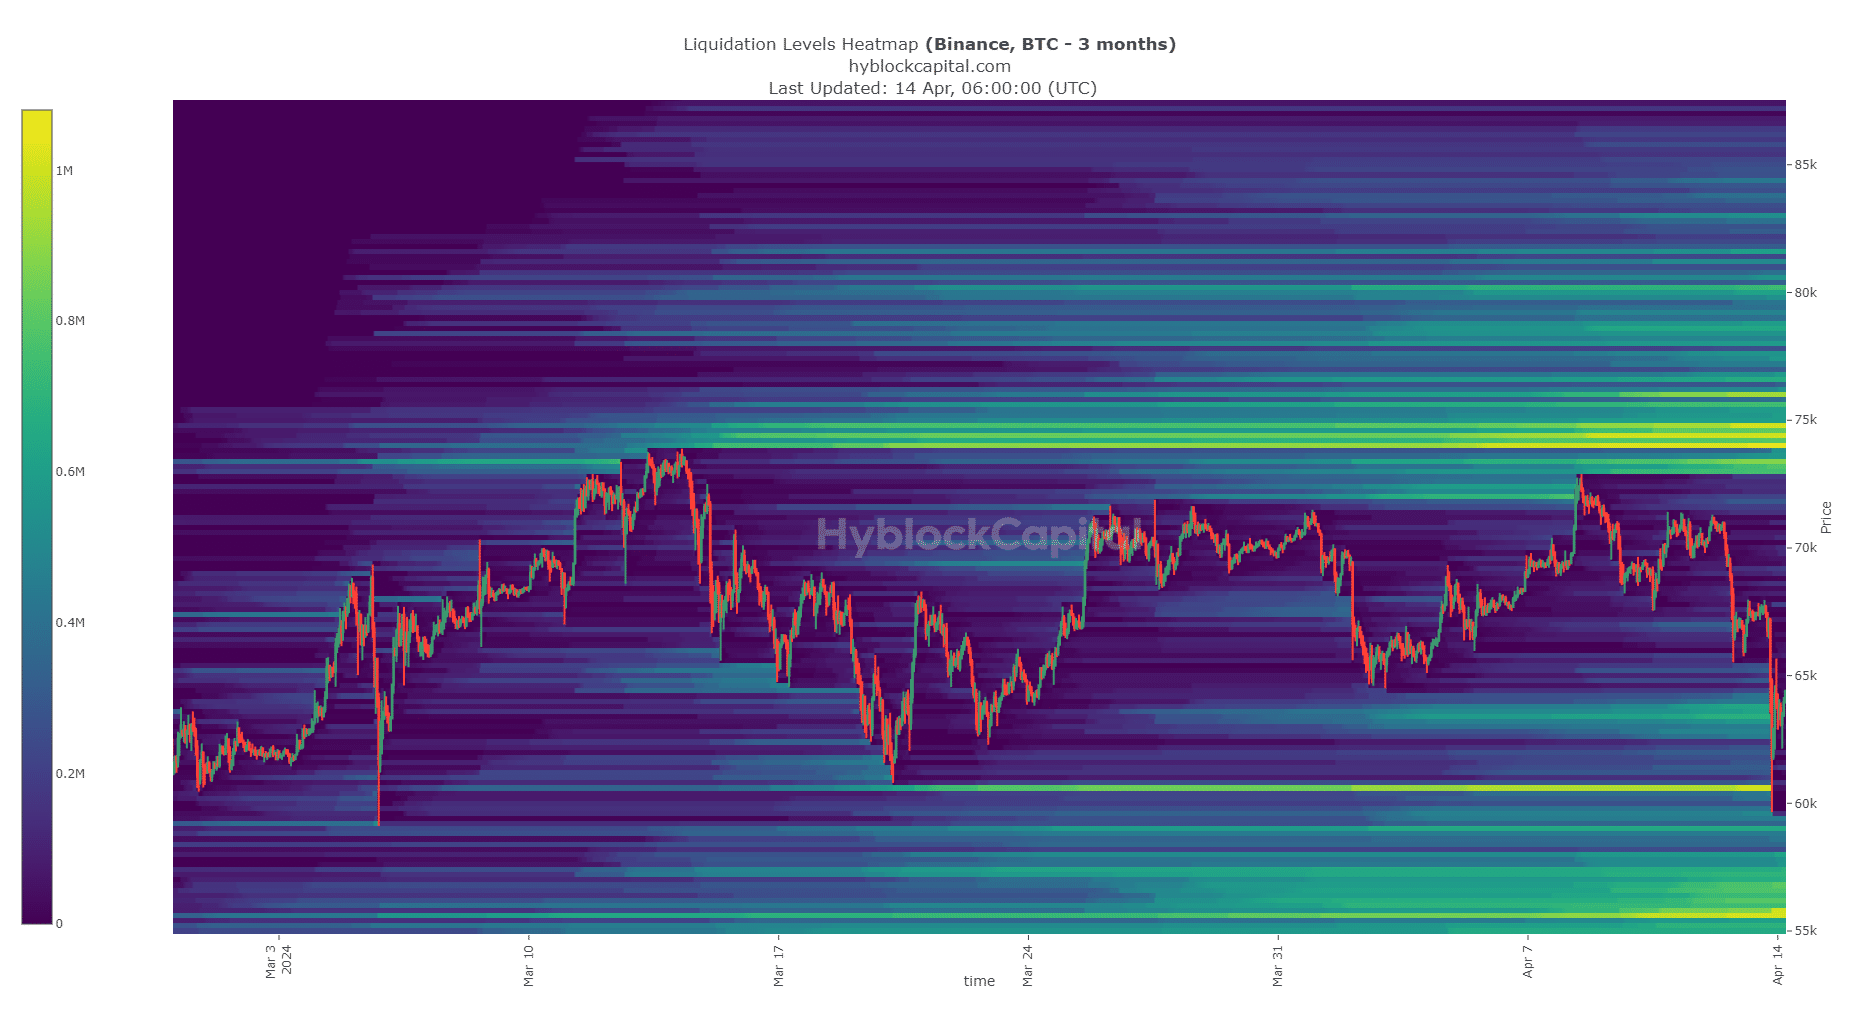
The liquidation heatmap showed that the $60.6k level had a huge concentration of liquidation levels that were taken out during the recent plunge.
In the hours since, BTC has bounced close to 7%. It is unclear if it will be attracted to the liquidity pocket at $75k yet.
There is uncertainty around the halving and fears of selling pressure from traditional markets in the upcoming week.
Is your portfolio green? Check out the BTC Profit Calculator
Hence, AMBCrypto estimated that Bitcoin was more likely to go sideways from $64k-$68.5k for a while.
Another dip to the $60k level to collect liquidity, possibly even as low as the $55k region, was anticipated before a reversal.
Disclaimer: The information presented does not constitute financial, investment, trading, or other types of advice and is solely the writer’s opinion.