Bitcoin’s assessment of the last 365 days reveals this about BTC’s future

Data from blockchain analytics platform, Santiment revealed that Bitcoin [BTC]’s Market-Value-to-Realized-Value (MVRV) stood at -43. This was close to the lowest position the metric has clinched before a rebound. Historically, the king coin’s lowest was a negative value of -53 in December 2018.
According to Santiment, in 2021, a consistent decline in the price and market capitalization led to a similar drop in active traders that traded BTC. As a result, the index for active BTC traders dropped by an average of 43% since last September.
📉 #Bitcoin remains -72% from its November, 2021 #alltimehigh. With such a market cap drop, active traders that have transacted over the past year are down an average of -43%. Historically, MVRV hasn't dropped much further than this before a rebound. https://t.co/KI4PdHYD4U pic.twitter.com/H1SEldHib2
— Santiment (@santimentfeed) September 23, 2022
More on-chain declines
At press time, BTC traded at $19,137.16. According to data from CoinMarketCap, the price position represented a 72% drop from its all-time high of $68,789.63 logged 10 months ago.
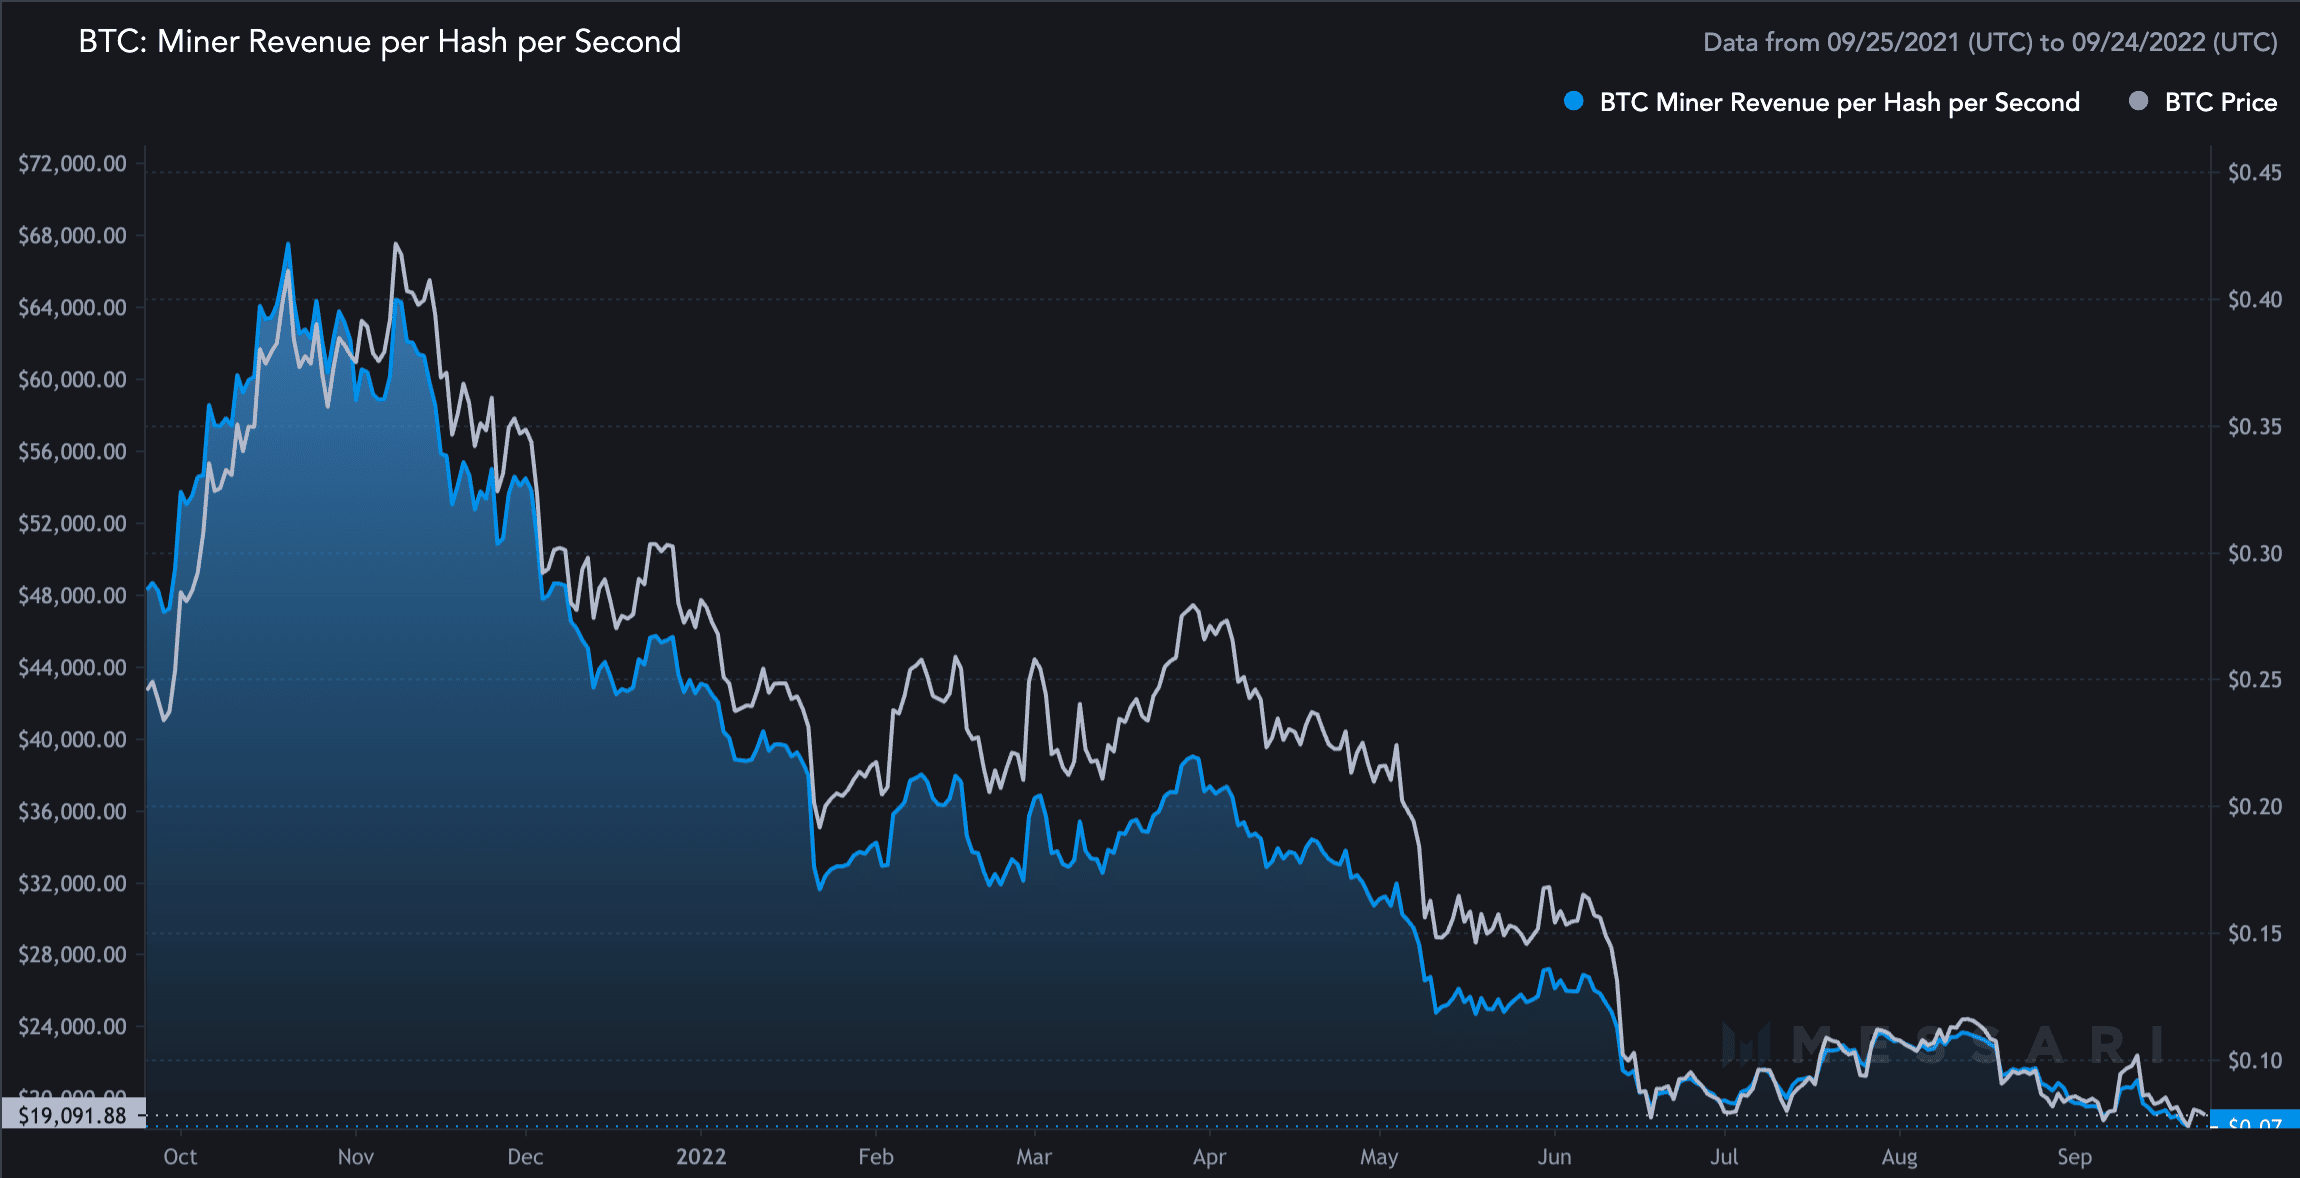
However in 2021, the Bitcoin network hash rate grew steadily. According to data from Messari, this stood at 225 MH/s at press time, having increased by over 60% in the last 365 days. Additionally, data from the same source showed that the average difficulty on the network was at an all-time high of 32.05T.
However, despite these highs, the revenue paid to BTC miners per hash per second on the network declined severely in the last year. According to Messari, the figure dropped by 75%.
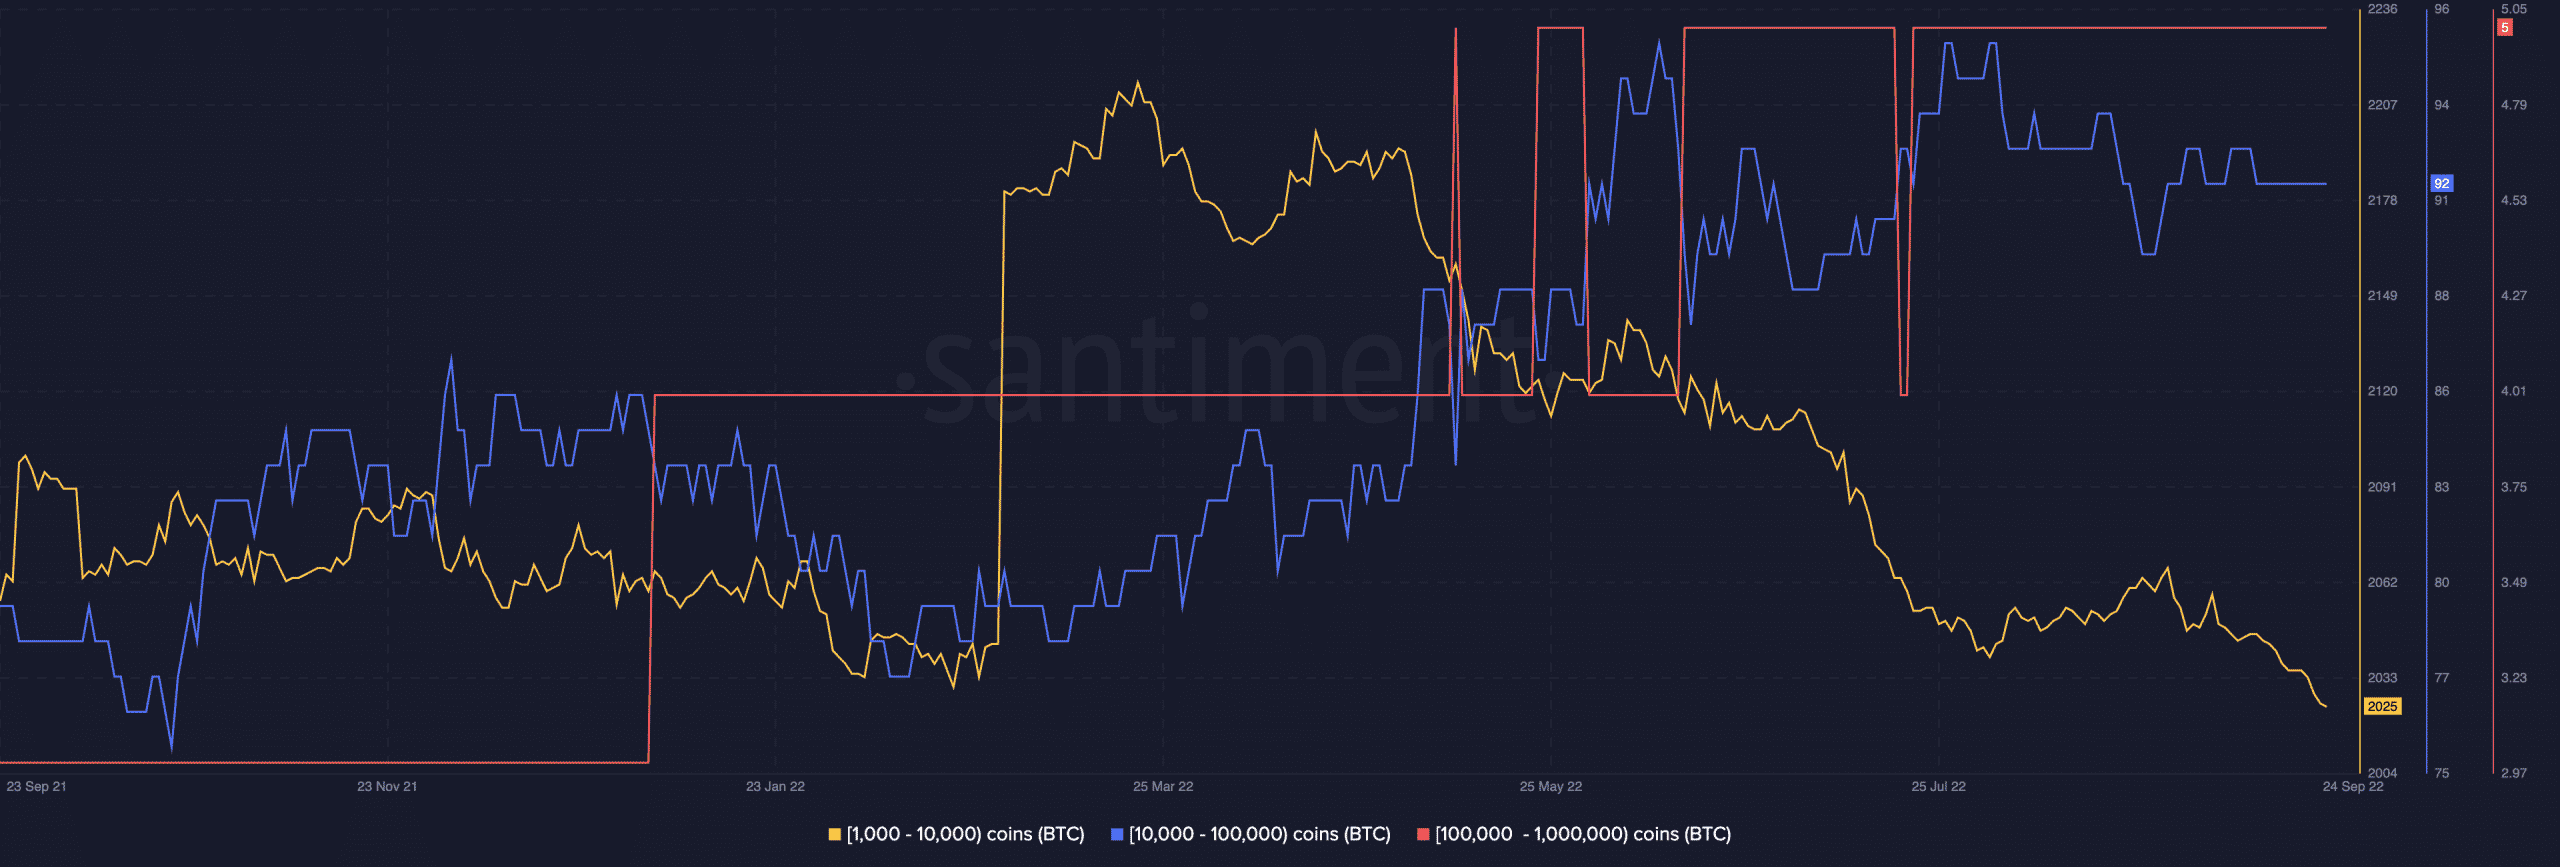
Within the one-year period under review, the king coin registered a disparity in coin holding behavior amongst the biggest stakeholders on the BTC network. According to data from Santiment, holders of 1,000 to 10,000 BTC dropped by 2% in the last year.
The current count for this category of whales stood at 2,025 addresses. This decline can thus be attributed to the steady decline in the price of BTC since its November 2021 ATH. However, holders of 10,000 to 100,000 BTC and 100,000 to 1,000,000 BTC have been more resilient.
Their counts increased by 15% and 66%, respectively, in the last 365 days.
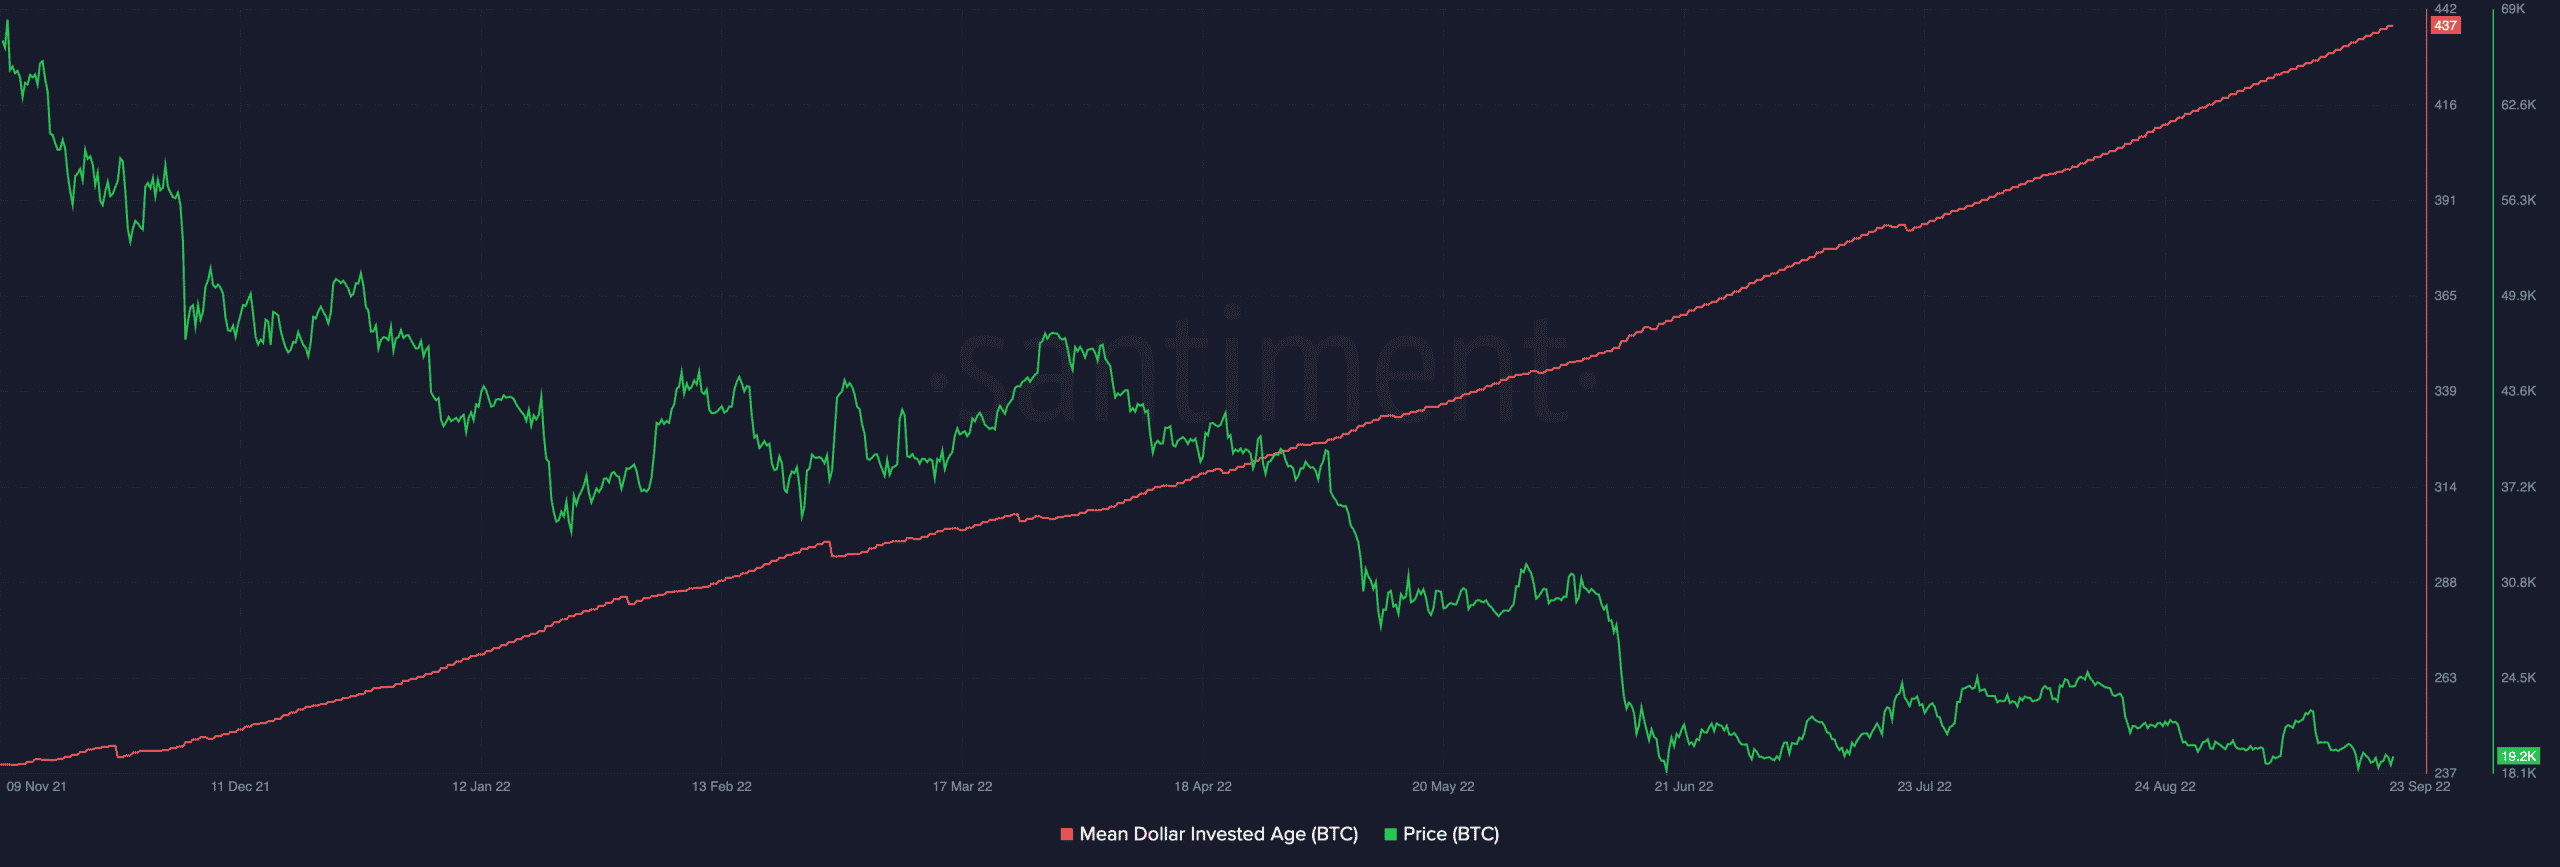
Further, data from Santiment also revealed dormancy on the BTC network since the ATH of 10 November. A look at the asset’s Mean Dollar Invested Age (MDIA) confirmed this. It has consistently risen in the past year, indicating stagnancy on the network. This further resulted in a gradual decline in the price of the king coin.
Through the thick of the current bear market, the price of BTC has gone down by over 55% since January. With the tightening financial situation amid a general downturn in the broader financial markets, BTC holders have taken to selling their assets at a loss to salvage their investments.
As a result, the asset’s Spent Output Profit Ratio (SOPR) spent more than half of the year below the central 1 level, data from Glassnode showed. This was an indication that the year so far has been significantly marked by panic selling of BTC.


