
- Bitcoin was down by more than 6% in the last seven days.
- Market indicators were bearish on the coin.
Bitcoin [BTC] has been on a bull rally for the last seven days as its price has increased considerably. However, this bullish trend might not last long as a key indicator hinted at a possible price correction soon.
Let’s have a look at what’s going on with Bitcoin.
Bitcoin’s liquidation is rising
CoinMArketCap’s data revealed that Bitcoin’s price increased by more than 6% in the last seven days. At the time of writing, BTC was trading at $67,055.86 with a market capitalization of over $1.32 trillion.
In the meantime, Ali, a popular crypto analyst, posted a tweet highlighting an interesting update. As per the tweet, $30.33 million will be liquidated if Bitcoin rebounds to $68,838.
Generally, a rise in liquidation results in price corrections. Therefore, AMBCrypto planned to have a better look at BTC’s state to see whether it’s getting ready for a correction or if the road ahead is clear.
Which way is BTC headed?
AMBCrypto then planned to take a look at the king of crypto’s metrics to see what to expect from them. As per our analysis of Santiment’s chart, BTC’s MVRV ratio registered an uptick last week, which can be inferred as a bullish signal.
Additionally, its weighted sentiment also moved into the positive zone. This clearly meant that bullish sentiment around the coin was increasing in the market.
However, the rest of the metrics looked bearish. For example, its supply on exchanges registered an uptick, suggesting a rise in selling pressure.
On top of that, the king of cryptos’ NVT ratio also registered an uptick. Whenever the metric rises, it means that an asset is overvalued, indicating that the chances of a price correction are high.
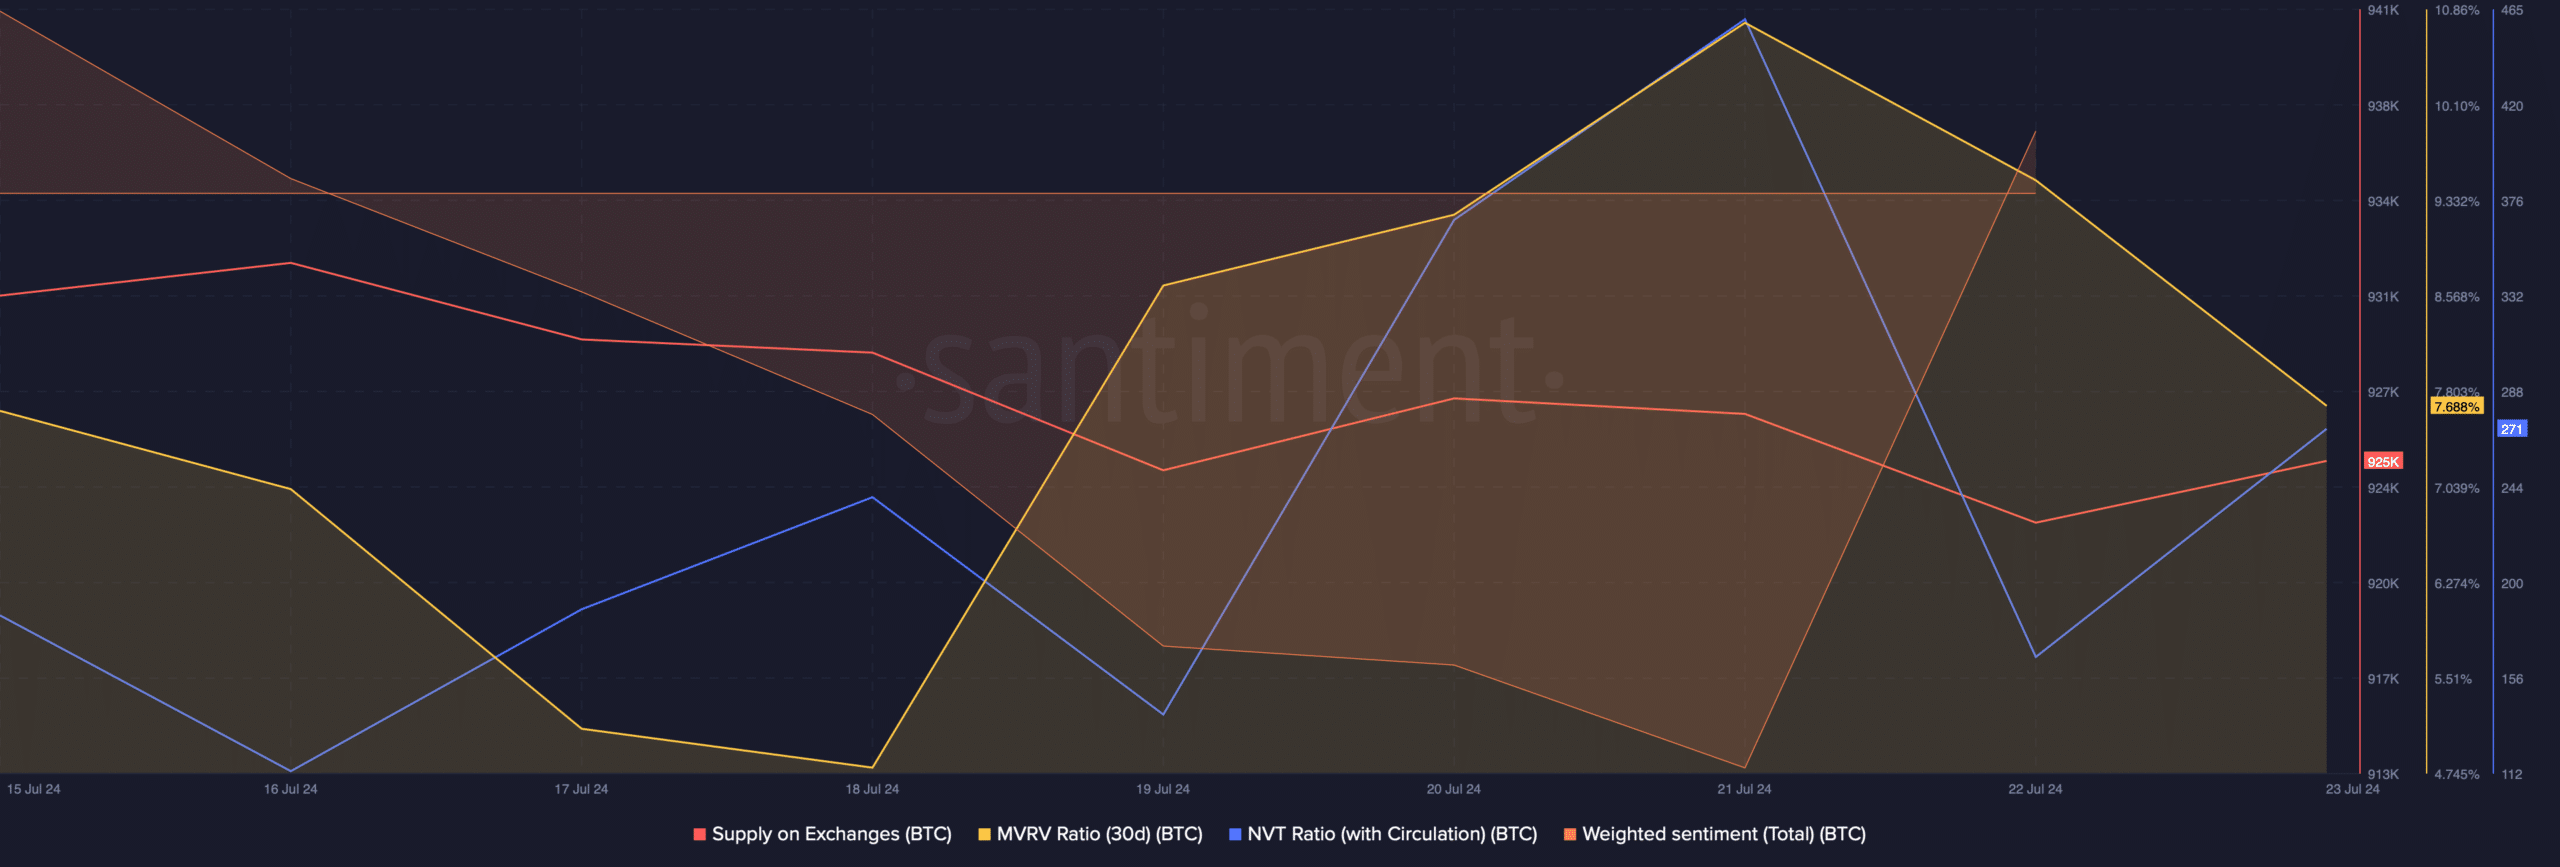
Source: Santiment
Analysis of BTC’s daily chart
AMBCrypto then planned to have a look at the coin’s daily chart to see what market indicators suggest. We found that BTC’s price touched the upper limit of the Bollinger Bands, which often results in price corrections.
Is your portfolio green? Check out the Bitcoin Profit Calculator
Bitcoin’s Relative Strength Index (RSI) also registered a downtick. Both of these indicators suggested that the chances of a price correction were high.
Nonetheless, the technical indicator MACD displayed a bullish advantage in the market, hinting at a continued price rise in the coming days.
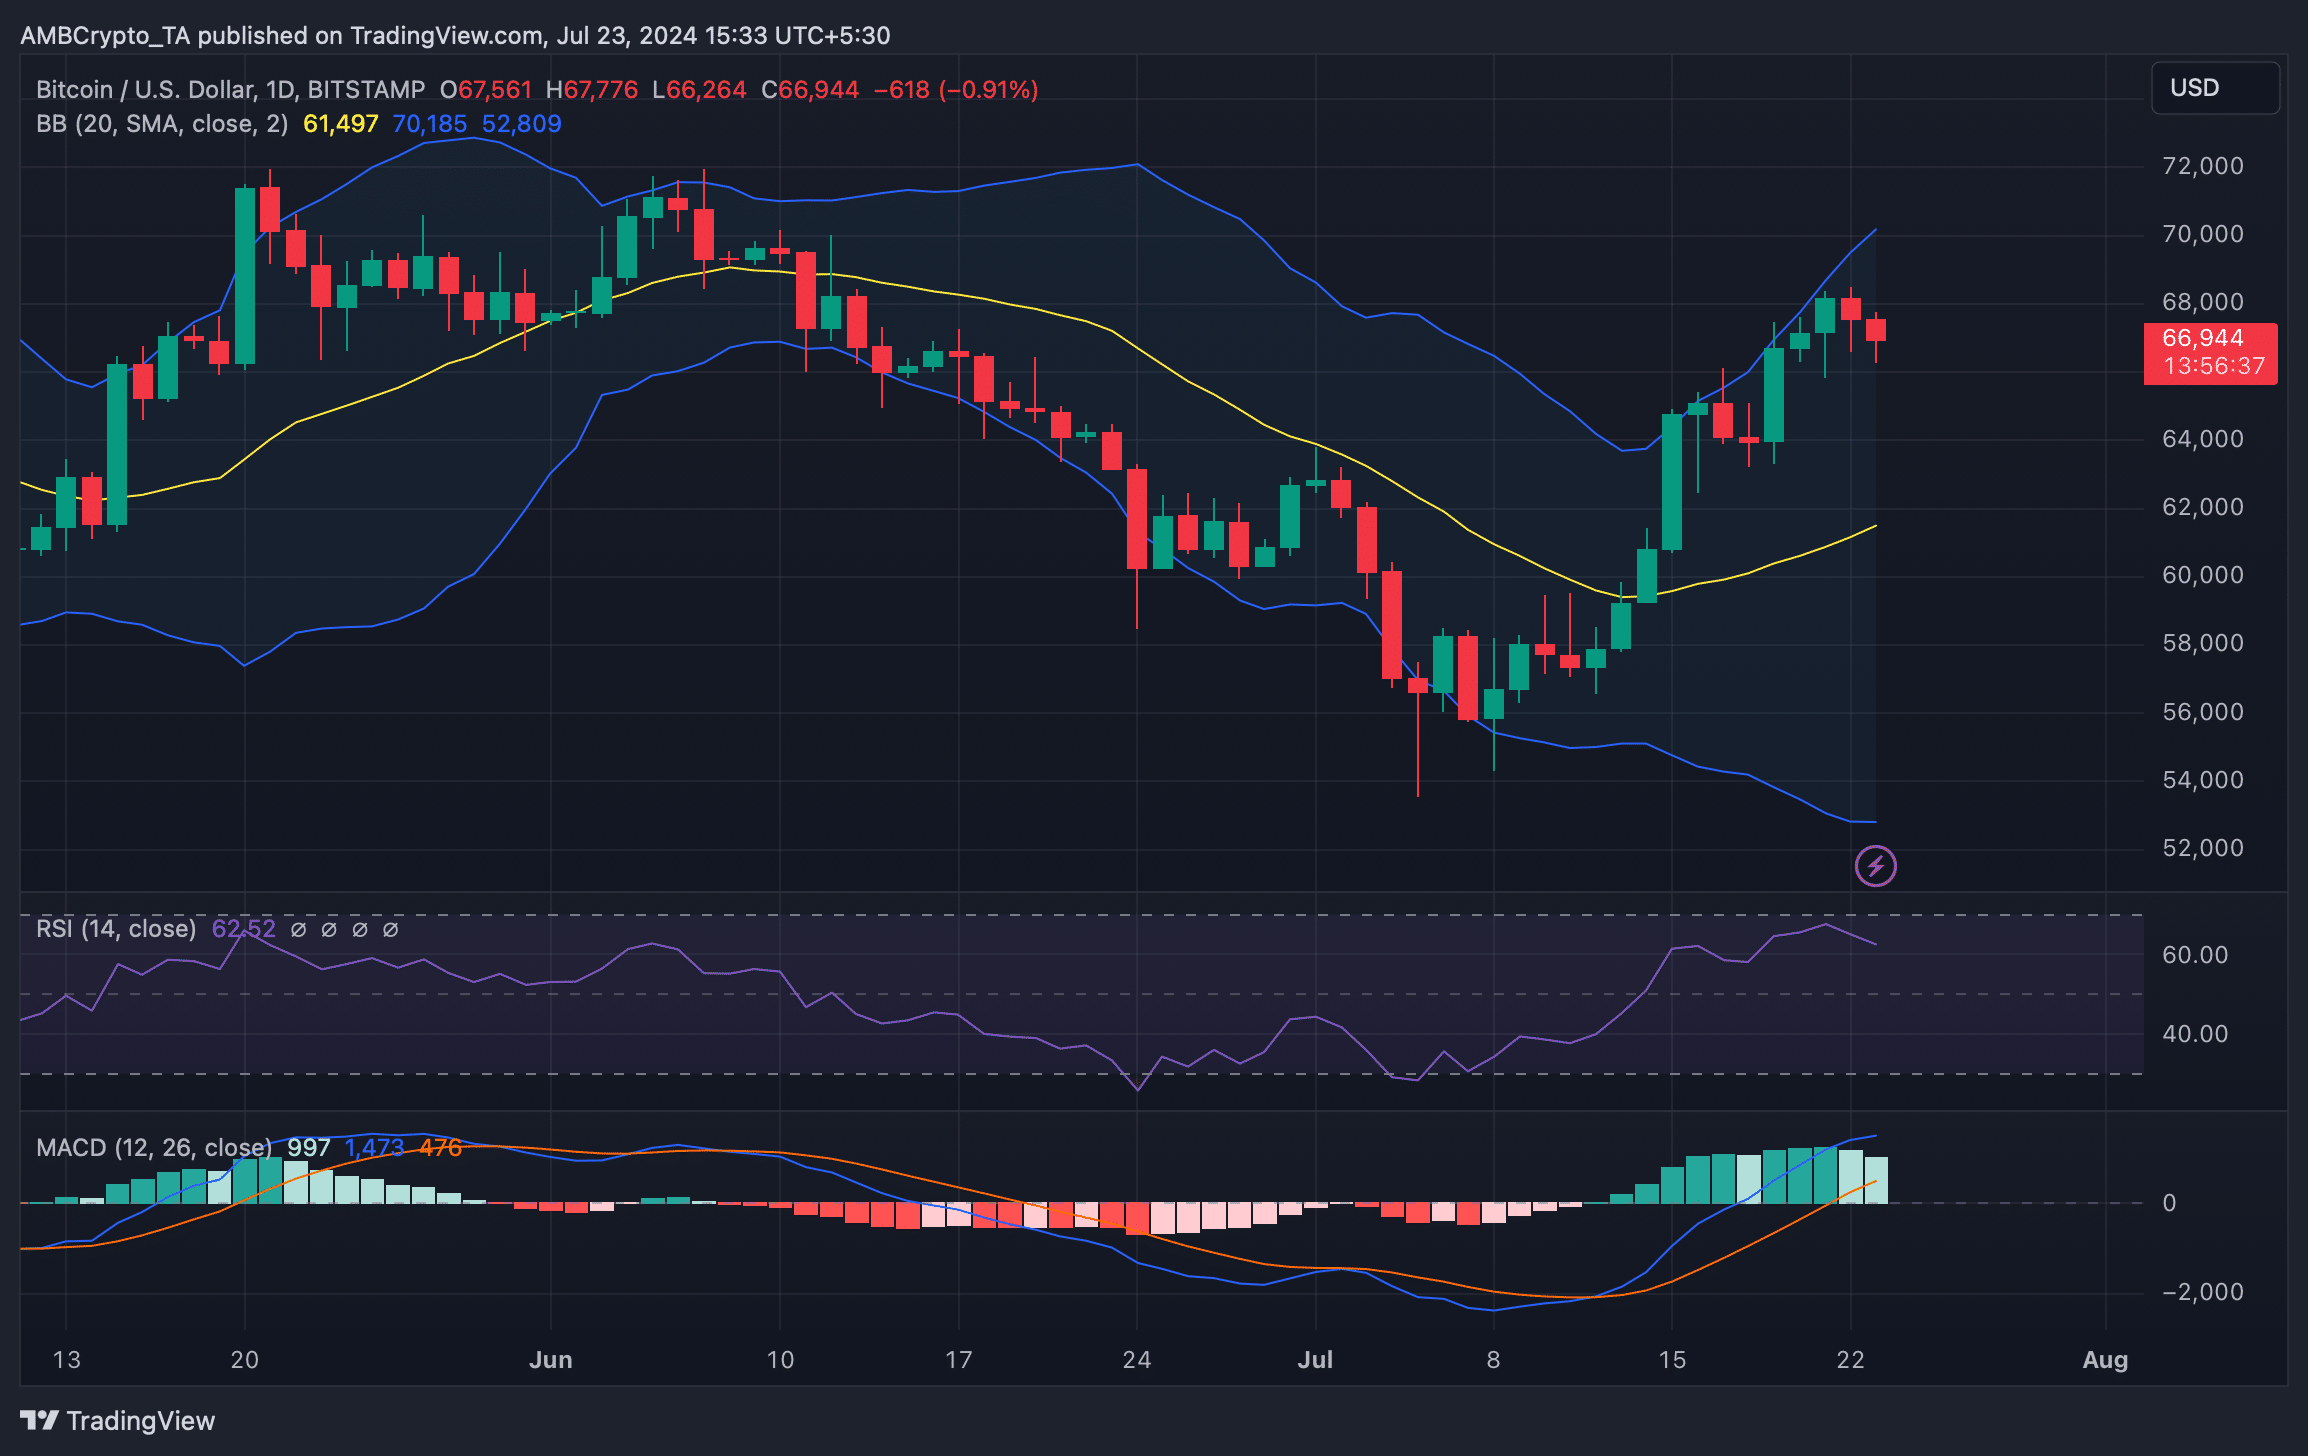
Source: TradingView


