Bitcoin’s bullish surge: Analyzing network fees, price trends and more
Bitcoin's steadfast $30,000 range endures amid price fluctuations, triggering increased fees, surging trade volumes, and inflows.
- BTC continues to trade above $30,000 despite recent declines.
- More BTCs flow into exchanges as positive exchange Netflow dominates.
The recent surge in the price of Bitcoin [BTC] has brought relief to certain investors, particularly those who purchased it at a lower price than its current range. Given Bitcoin’s ongoing upward trend, it’s worth exploring how the exchange flow has reacted to this and what consequences it has had on network fees.
Is your portfolio green? Check out the BTC Profit Calculator
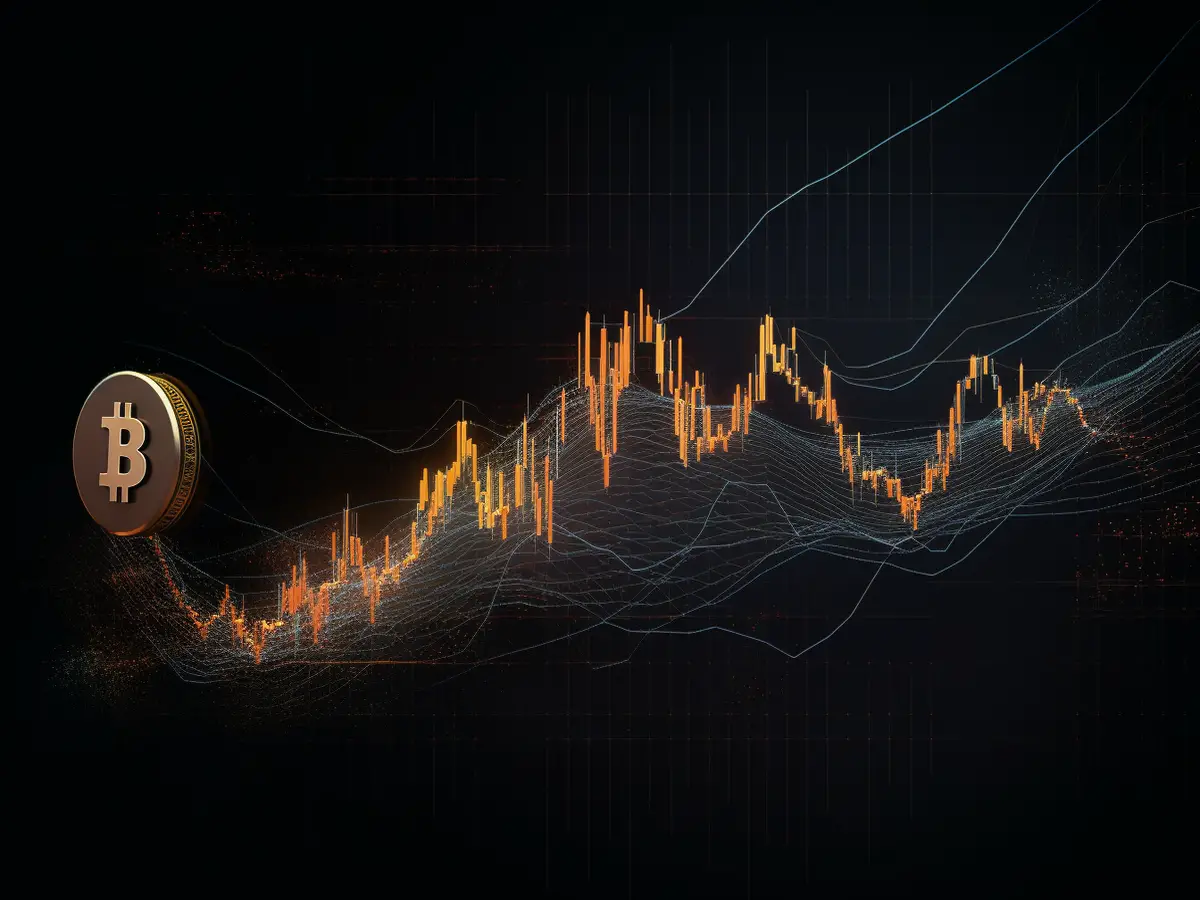
Bitcoin maintains $30,000 price range
In the past two days, the price of Bitcoin has experienced a slight decrease, as shown on its daily timeframe chart. This decline, however, remained under 2% according to the chart.
As of this writing, this downward movement had paused, and a modest increase of less than 1% was noticeable. Notably, Bitcoin was still trading at approximately $34,000, maintaining its position above the $30,000 mark despite the recent dip.

What’s particularly striking in the current BTC price trend is its strong bullish sentiment, as indicated by its Relative Strength Index (RSI). As of the latest data available, the RSI reading still resided in the overbought zone. This price trend has also triggered significant shifts in fees and exchange flow.
Analyzing the Bitcoin fees
According to data from Crypto fees, the recent surge in the price of Bitcoin had a positive effect on network fees. The data displayed a notable increase in network fees between 22 October and 24 October, surpassing the $6 million mark.
To provide context, throughout the month of September, the fees remained consistently below $5 million, making this surge to $6 million the most significant in nearly two months.
However, as of the current moment, the total fees have dipped slightly to over $4 million, attributed to a recent decline. This spike in fees was a clear indication of heightened trading activity driven by the rising price trends.
Inflow dominates BTC’s exchange flow
Based on the Exchange Netflow data provided by CryptoQuant, Bitcoin has experienced an increase in the inflow of assets into exchanges since the commencement of its upward trend. At the time of this writing, the flow chart displayed a positive flow of 175 BTCs, signifying that more assets were entering exchanges in comparison to those leaving.

How much are 1,10,100 BTCs worth today
Furthermore, this suggested that with the rise in Bitcoin’s price, more holders have been capitalizing on this increase and selling their holdings to secure profits.
Additionally, the sustained consistency of this flow, in conjunction with the price surge, has contributed to the heightened network fees that have recently been observed.


