
- Bitcoin’s rainbow chart revealed that BTC was in an accumulation phase.
- Metrics suggested that investors have already started to buy BTC.
Like most cryptos, Bitcoin [BTC], being the leader of the pack, turned bullish during the past 24 hours as well. Therefore, let’s assess a few key metrics of BTC to understand whether this still is the right time for investors to buy BTC.
Should you buy Bitcoin?
CoinMarketCap’s data revealed that BTC’s price increased marginally over the last 24 hours. At press time, it was trading at $61,107 with a market capitalization of over $1.20 trillion.
IntoTheBlock, an analytics and metrics provider, recently posted a tweet highlighting a key metric.
The tweet talked about BTC’s MVRV ratio and mentioned that whenever the metric goes below 1, it opens an opportunity for investors to accumulate.
Likewise, when the MVRV ratio goes above 3, it becomes a good opportunity for investors to sell. At press time, BTC’s MVRV ratio had a value of 1.93.
This meant that Bitcoin investors should get ready as a buying opportunity might appear soon.

Source: IntoTheBlock
Root, a popular crypto analyst, posted a tweet mentioning yet another important BTC metric. The tweet used BTC’s on-chain value map, which pointed out that BTC was fairly valued.
Therefore, this also suggested that investors might consider stockpiling.
AMBCrypto then checked Bitcoin’s Rainbow Chart to see what that metric had to suggest. As per our analysis, BTC’s price was in the “accumulate” stage, further indicating that it’s the correct time to accumulate.

Source: Blockchaincenter
A look at what investors are up to
AMBCrypto then checked BTC’s on-chain data to find out whether investors have started to accumulate. As per our analysis of Santiment’s charts, Bitcoin’s supply on exchanges dropped, meaning that buying pressure increased.
The fact that investors were stockpiling BTC was further proven by the substantial spike in its exchange outflow on the 9th of August.
Additionally, the top players were also actively reading BTC as the whale transaction count increased.
However, despite investors buying BTC, its weighted sentiment dropped and went into the negative one. This meant that bearish sentiment around the coin increased.
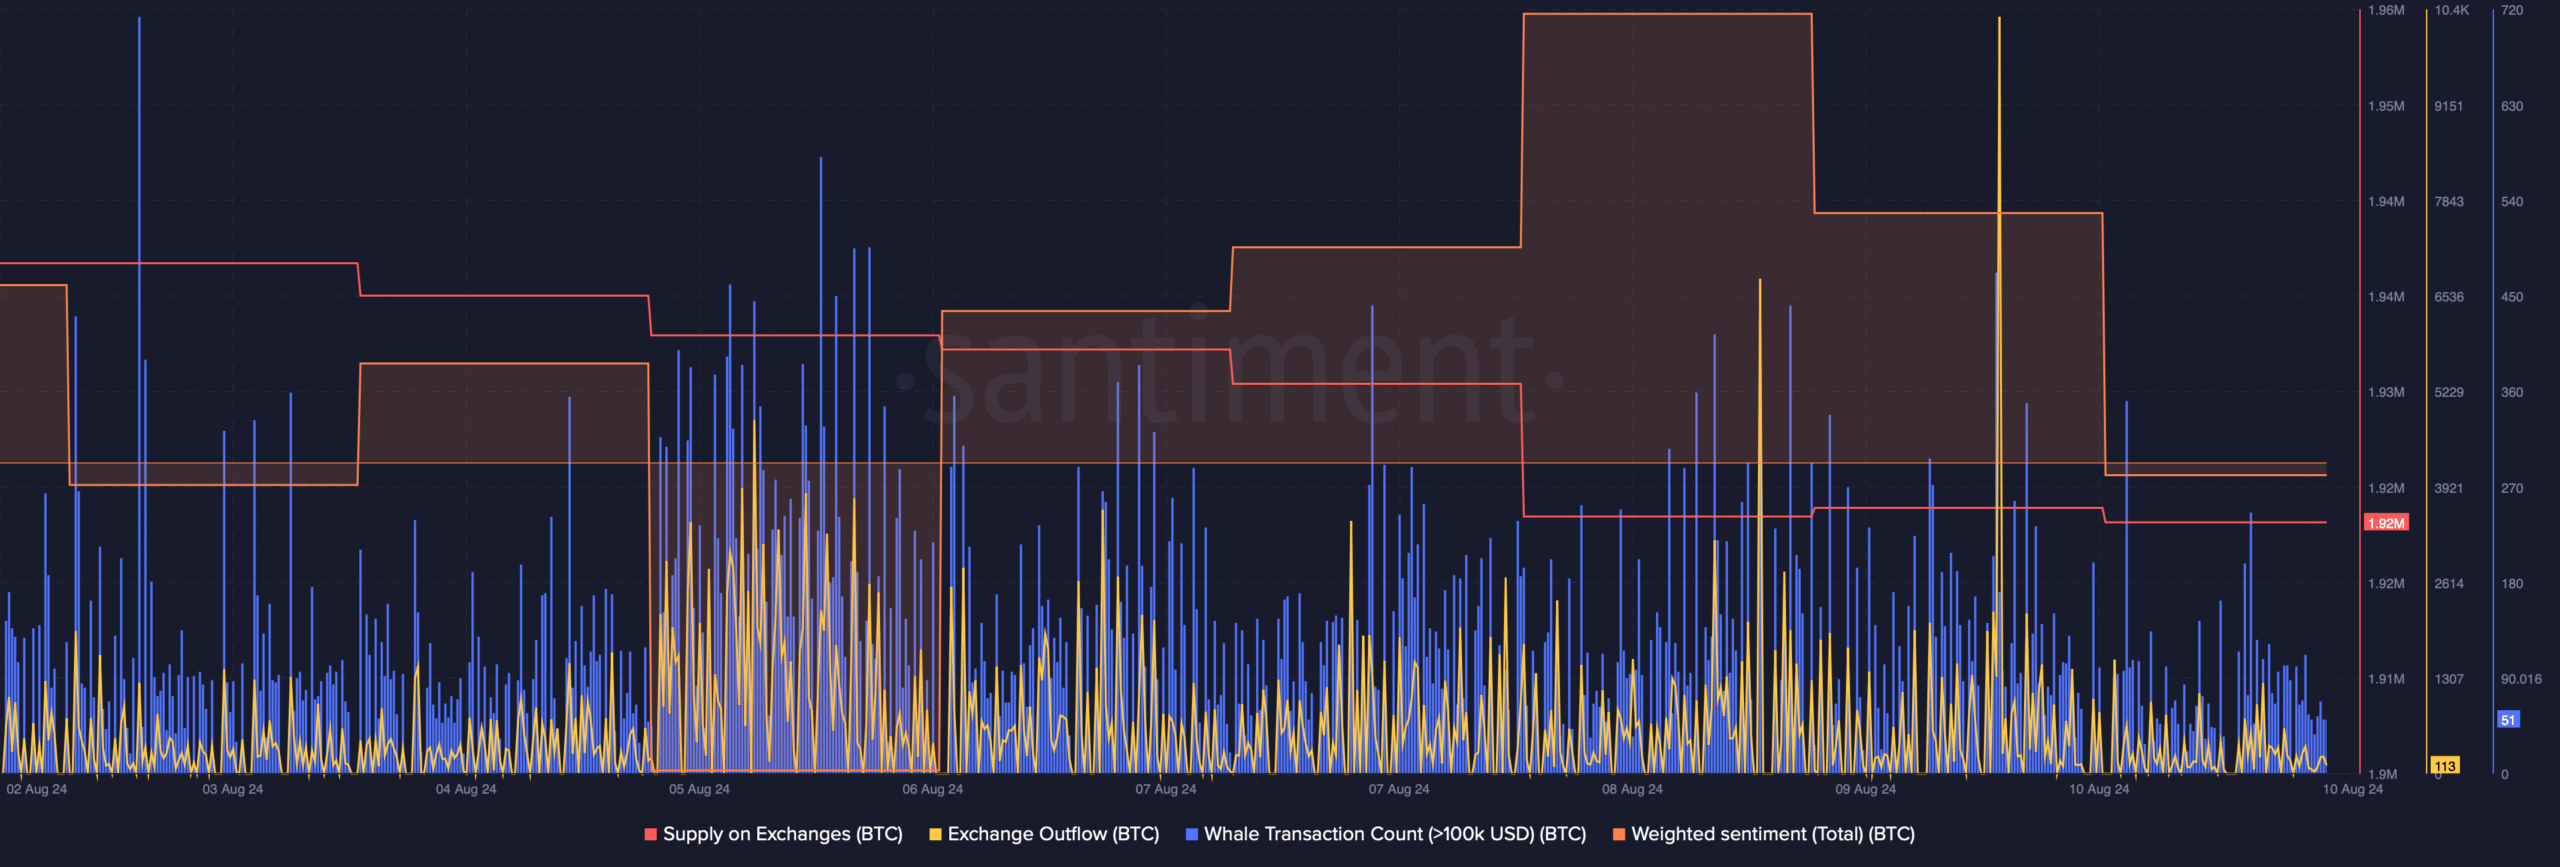
Source: Santiment
We then planned to have a look at BTC’s daily chart to see whether the drop in weighted sentiment could result in a price decline in the coming days.
Is your portfolio green? Check out the BTC Profit Calculator
As per our analysis, BTC’s Chaikin Money Flow (CMF) registered a sharp downtick, hinting at a bearish take over.
At press time, BTC was testing its 20-day Simple Moving Average (SMA) as suggested by the Bollinger Bands. Notably, the MACD displayed the possibility of a bullish crossover, which could allow BTC to successfully go above the 20-day SMA.
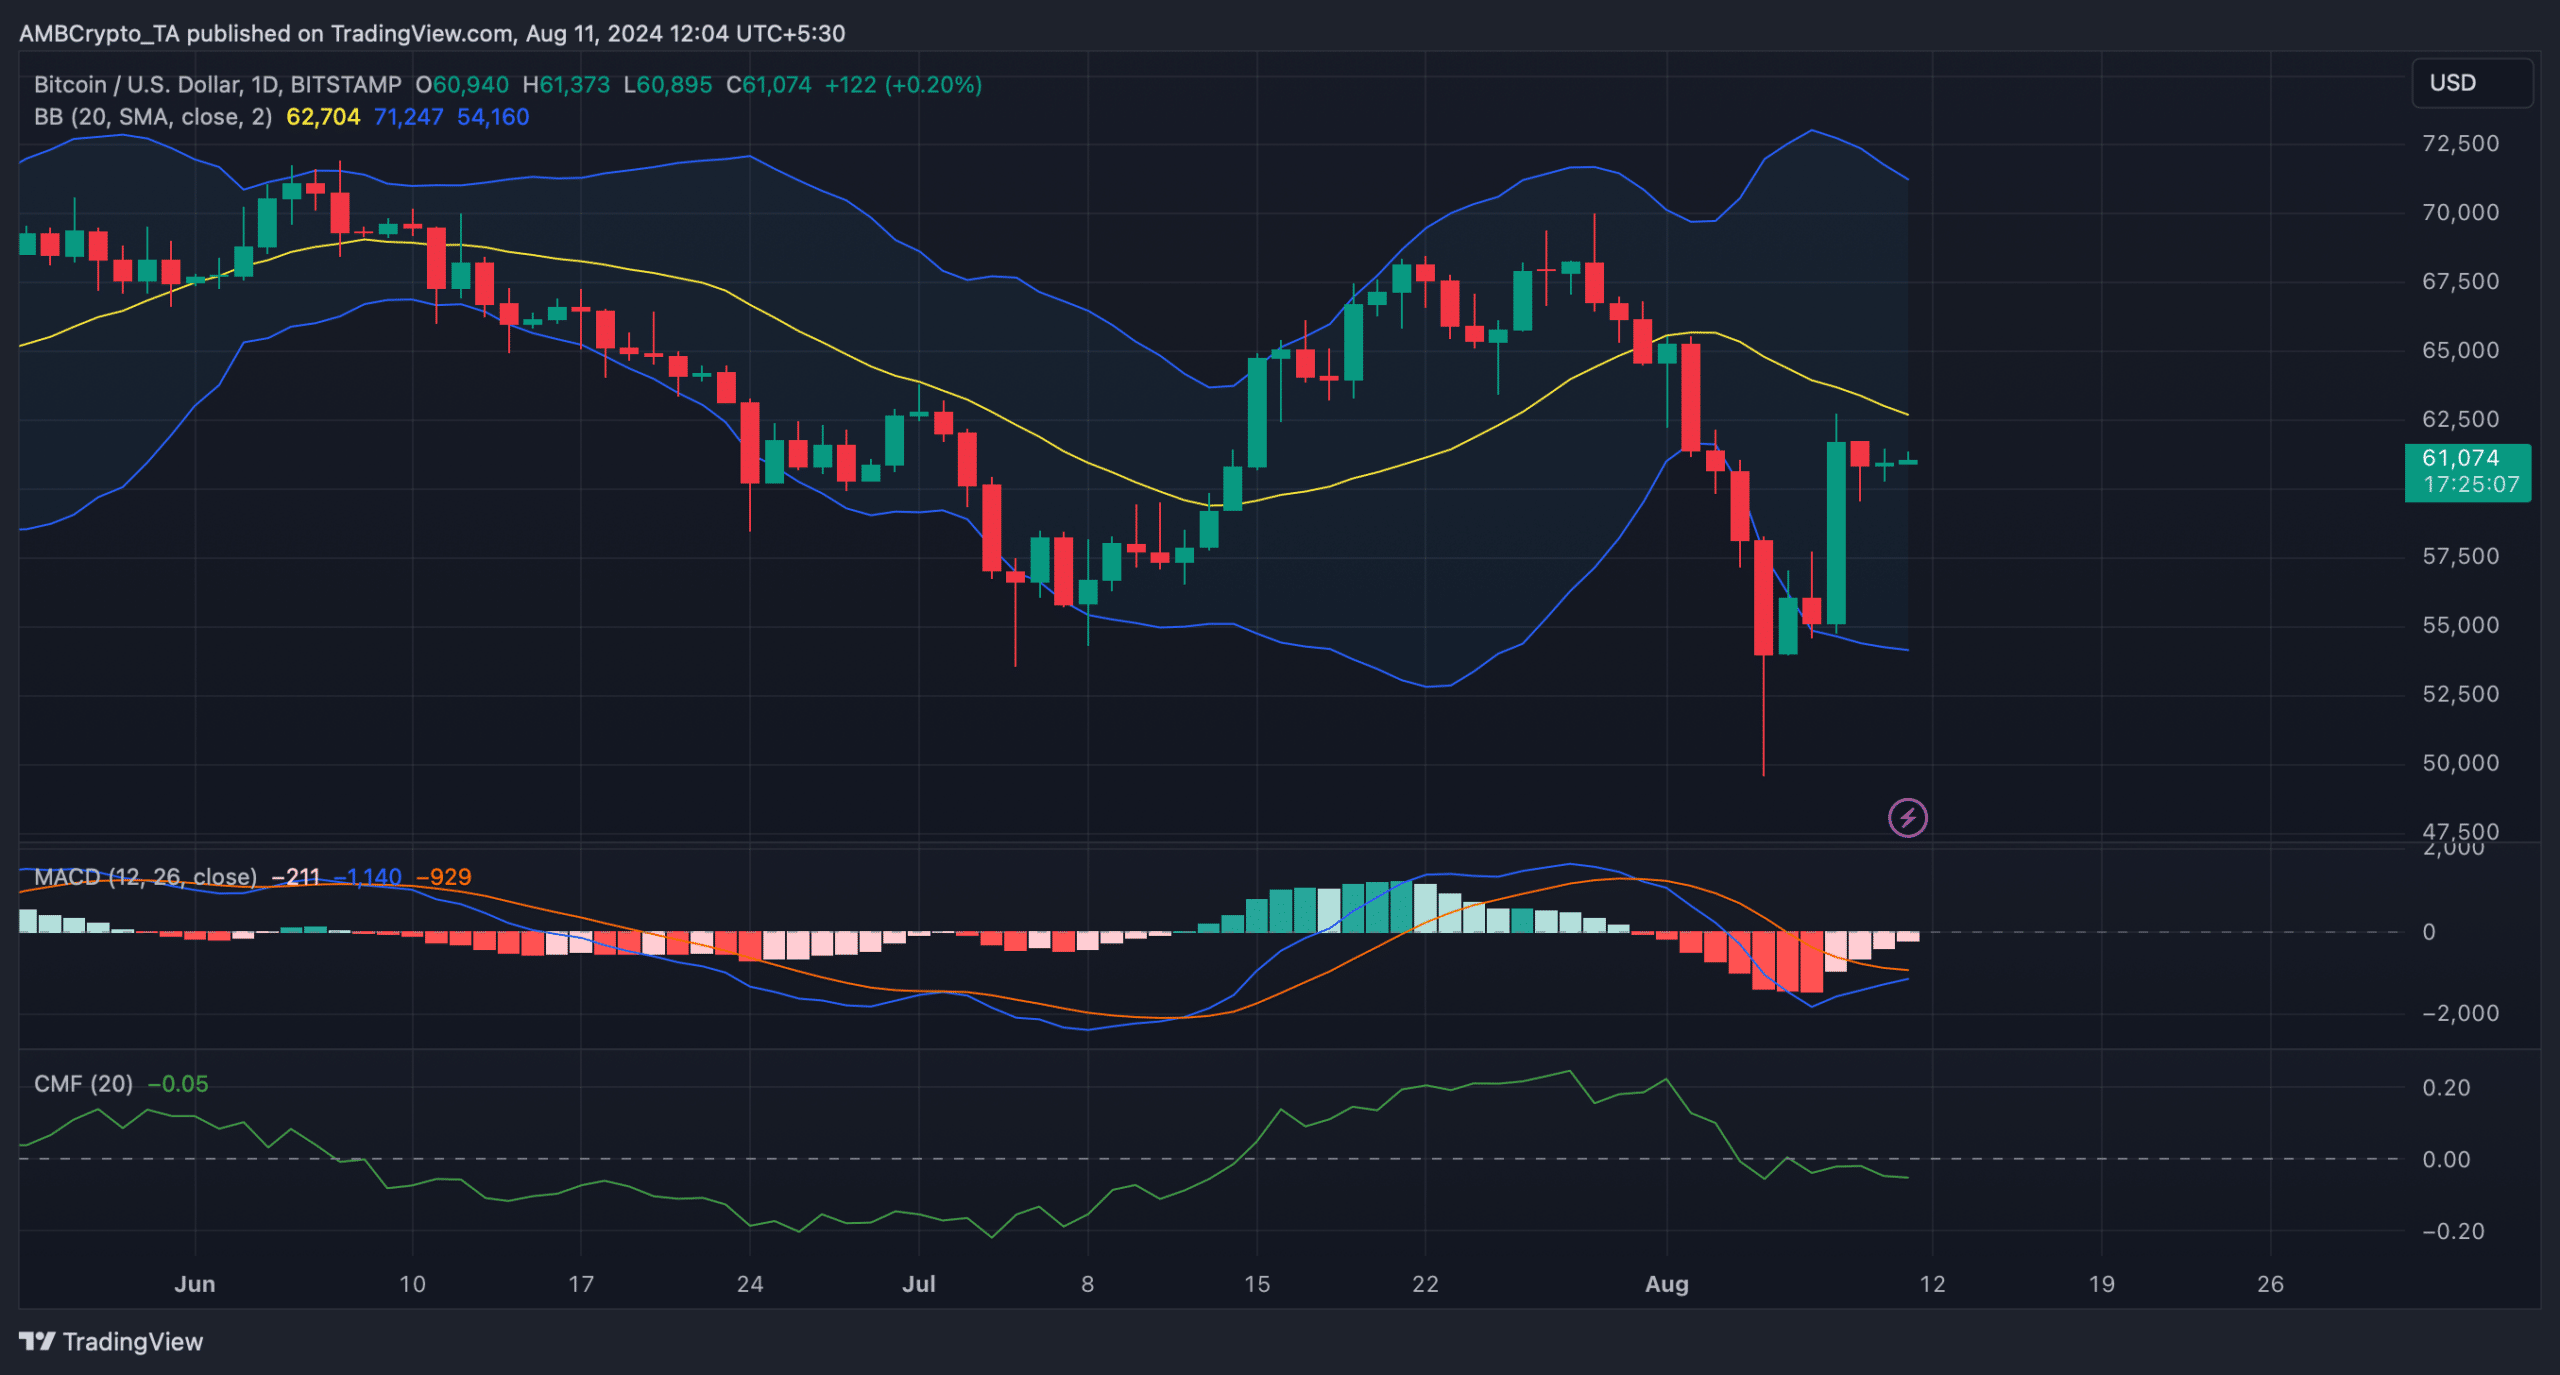
Source: TradingView