Bitcoin’s drop from $69.4k – Key levels and trends to watch this week!
A cluster of liquidation levels were present around the $70k level and at the $66.4k level, marking them as near-term targets.

- Bitcoin is down close to 3% after climbing to a local high at $69.4k.
- The Bitcoin dominance and liquidity charts hold clues about the next price move.
Bitcoin [BTC] reached the $69k resistance zone. In an earlier report, it was highlighted that the liquidity pool at this level would likely attract prices to it before a potential bearish reversal.
Over the past 24 hours of trading, BTC reached $69.4k and fell 2.7% to trade at $67.5k at press time. The metrics had been bearish in the short term earlier this week. Monday’s trading session could set up the trend for the next week.
Potential scenarios for Bitcoin this week
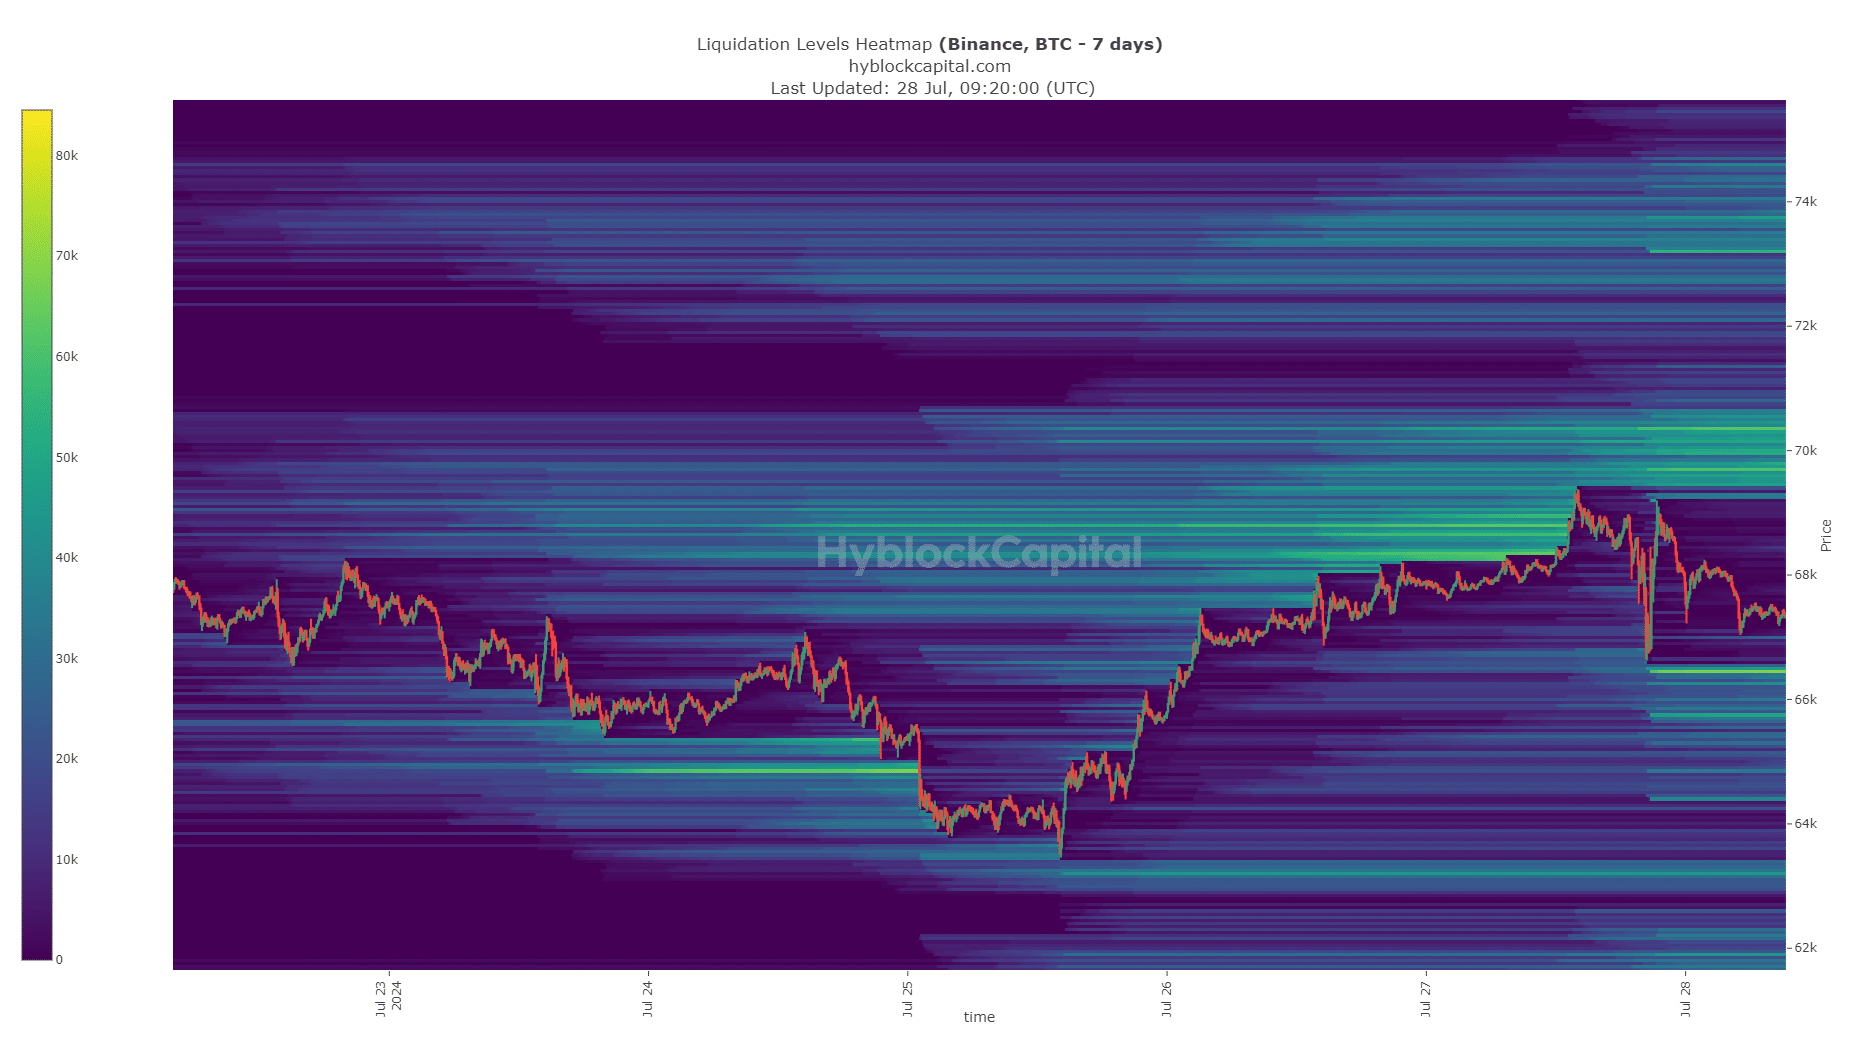
AMBCrypto analyzed the 7-day look-back period on the liquidation heatmap. A cluster of liquidation levels were present around the $70k level and at the $66.4k level.
Over the past few hours, the price reversal from the $69k zone has helped add to the liquidity pool around $70k.
This makes it an interesting price target for Bitcoin on Monday. A move to the $70k area to sweep the liquidity and create hope among bulls before a reversal could unfold.
This price bounce might precede a dip to the $66.4k level. A move beyond either level would likely signal whether this week would be bullish or bearish.
Clues from the Dominance chart
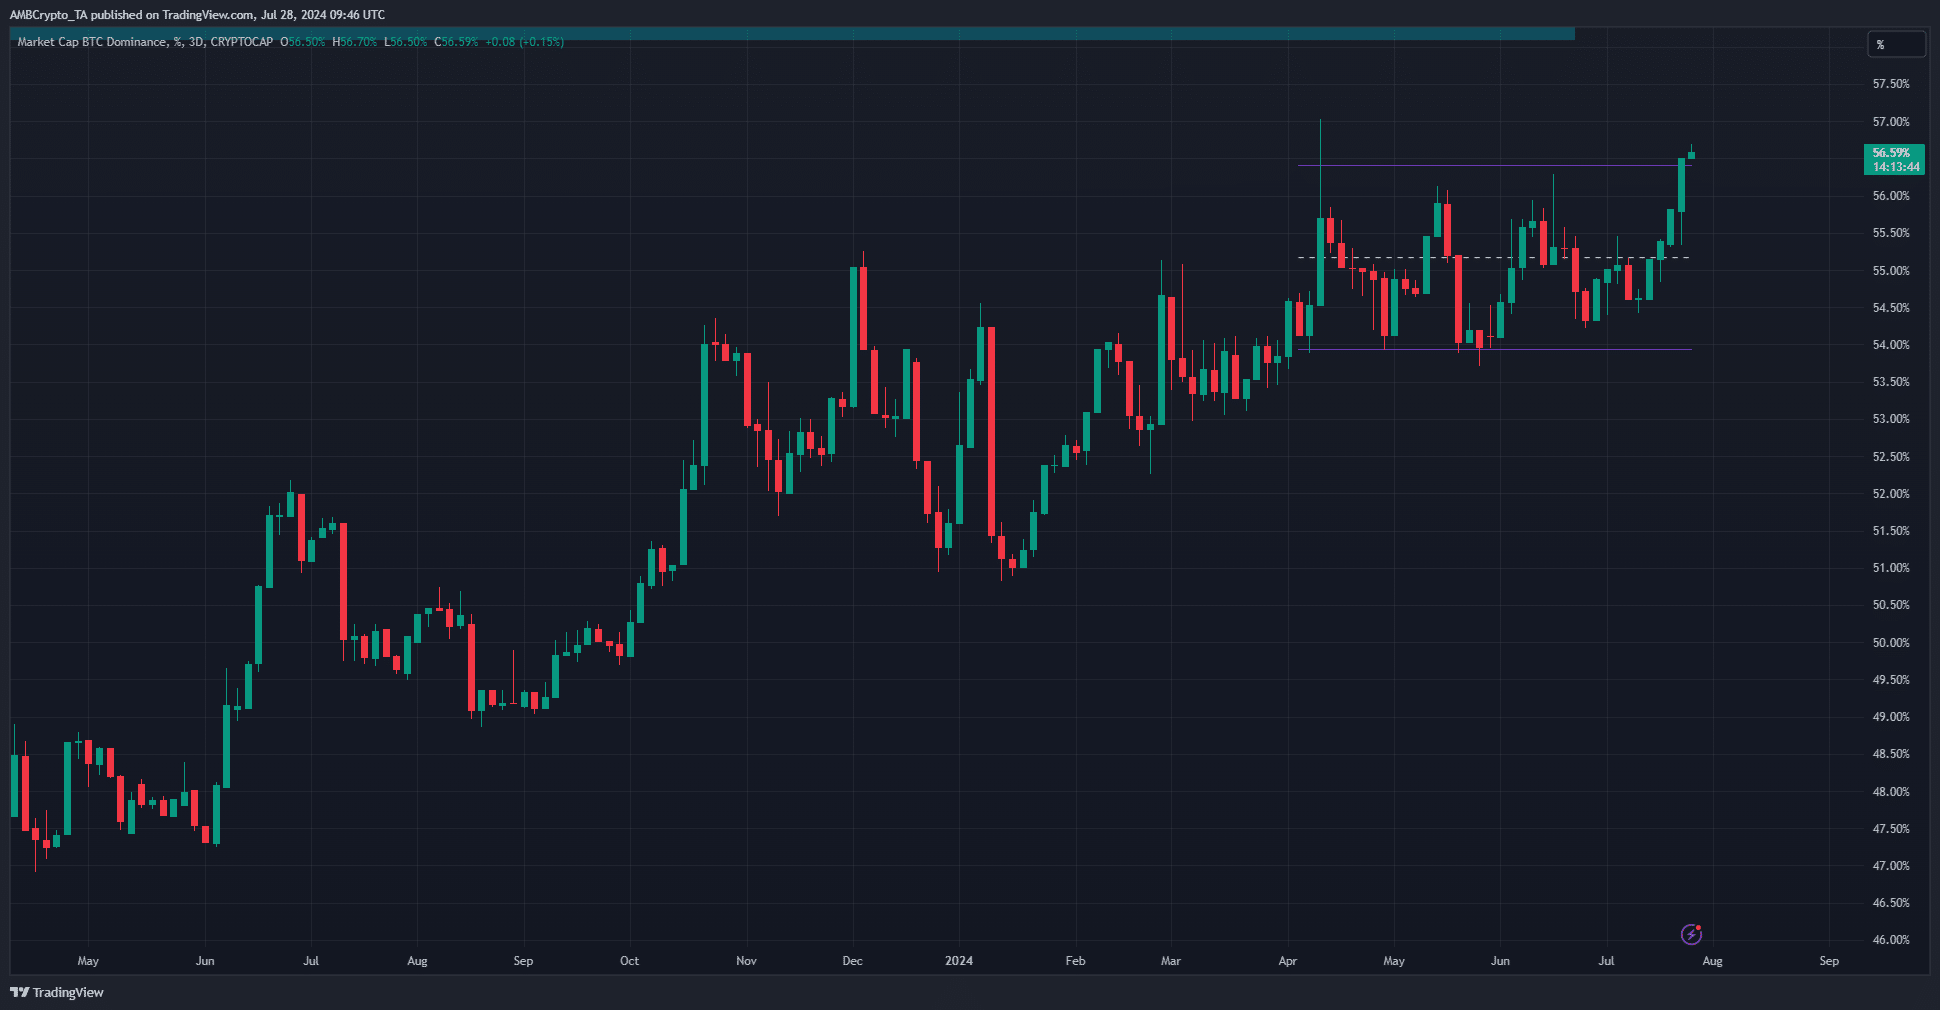
The Bitcoin Dominance chart showed a breakout above the range highs. This meant that Bitcoin was performing better than the major altcoins. In case of a market-wide slump, altcoins would suffer disproportionately.
Traders can use this information to decide what assets to trade based on Monday’s directional clues.
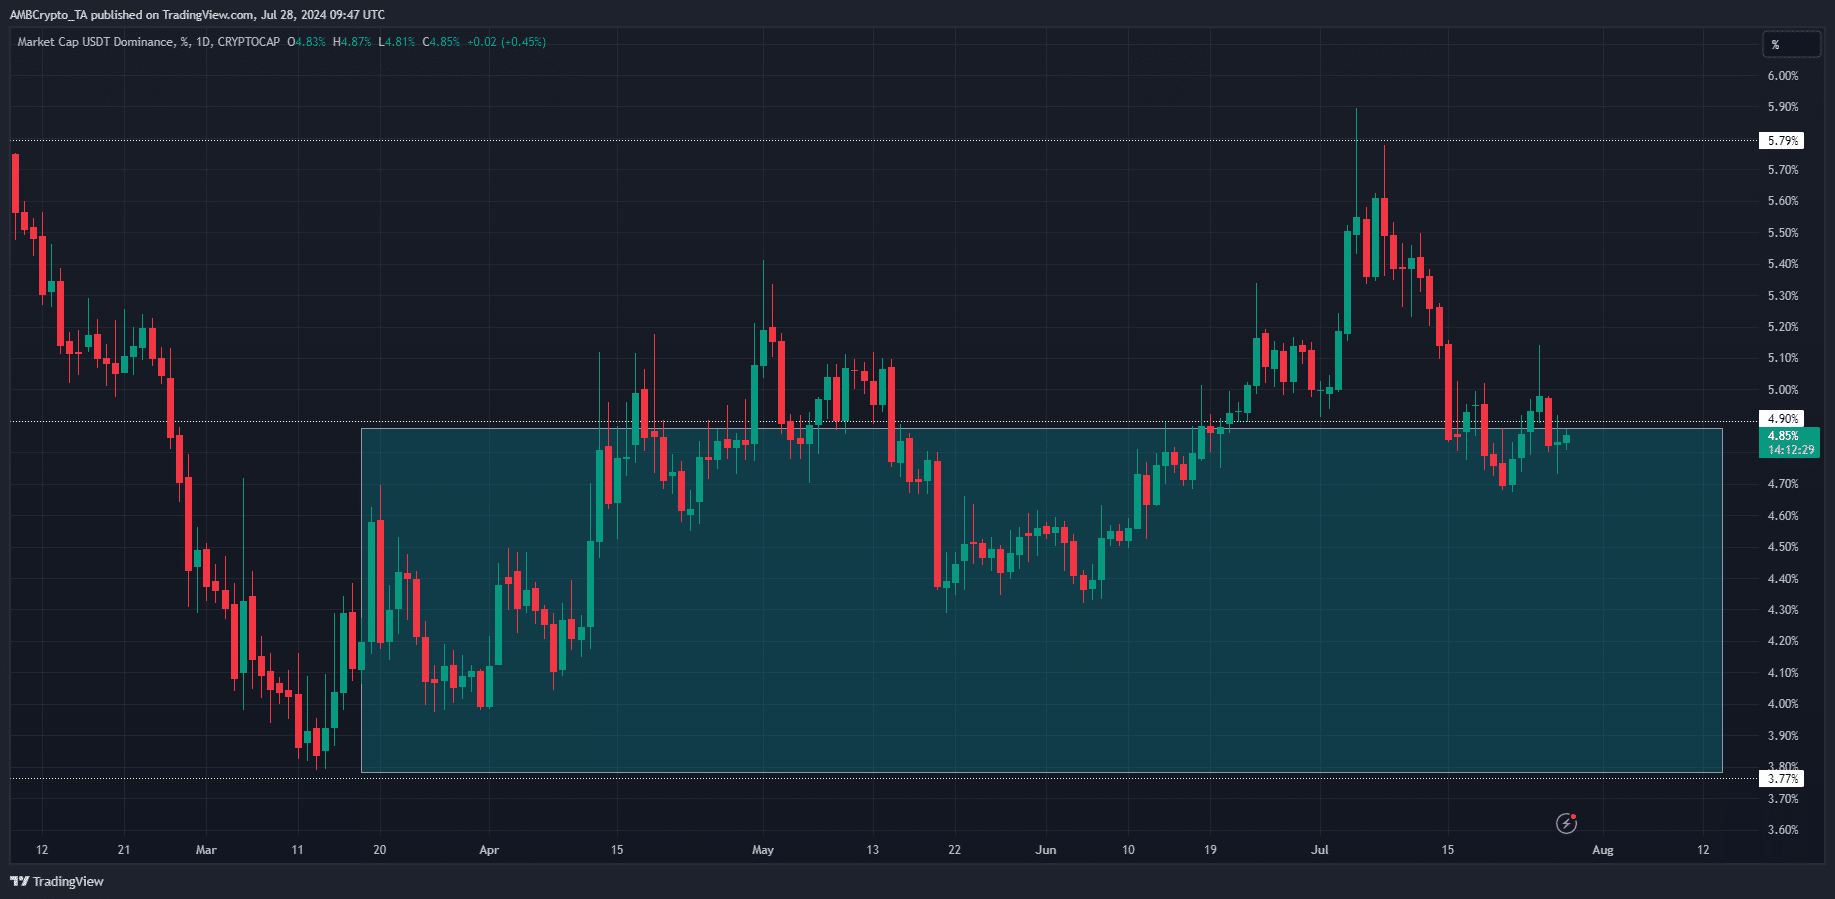
The Tether Dominance chart is inversely related to crypto market price moves. When USDT.D goes up, it’s a sign that investors are moving to stablecoins and selling their crypto.
Read Bitcoin’s [BTC] Price Prediction 2024-25
Based on the Tether Dominance trend, a move downward might ensue this week. Traders can watch Monday’s performance closely and structure their directional bias accordingly.
Over the past month, USDT.D movement on Mondays has generally set the tone for the upcoming week.