

Dormant XRP coins wake up: What means for the altcoin’s road to $4
Bitcoin
Bitcoin’s expanding triangle, explained: Looming breakout or trap?
Bitcoin’s expanding triangle signals volatility; breaking $63,800 could trigger a surge or sharp decline.


- Bitcoin’s expanding triangle pattern signals high volatility, setting the stage for a breakout or drop.
- MVRV ratio suggests holders are in profit, but there’s room before critical profit-taking levels are reached.
Bitcoin’s [BTC] price continued to form an expanding triangle pattern at press time, catching the attention of analysts.
This formation, characterized by a broadening price action, suggests market indecision with increasing volatility.
Crypto analyst Peter Brandt notes that Bitcoin is in a sequence of lower highs and lower lows, which may persist unless the price closes meaningfully above the July highs.
The current technical setup could be setting the stage for a major breakout or further downside risks.
Expanding triangle and support levels
Bitcoin’s expanding triangle formation reflects uncertainty in the market, with widening price swings that signal increasing volatility. Historically, such patterns have often preceded sharp moves, either upwards or downwards.
Bitcoin’s lower boundary around $49,130 and previous lows at $53,219 are crucial support levels to monitor. A break below these points could indicate further downside risks, potentially leading to more significant losses.
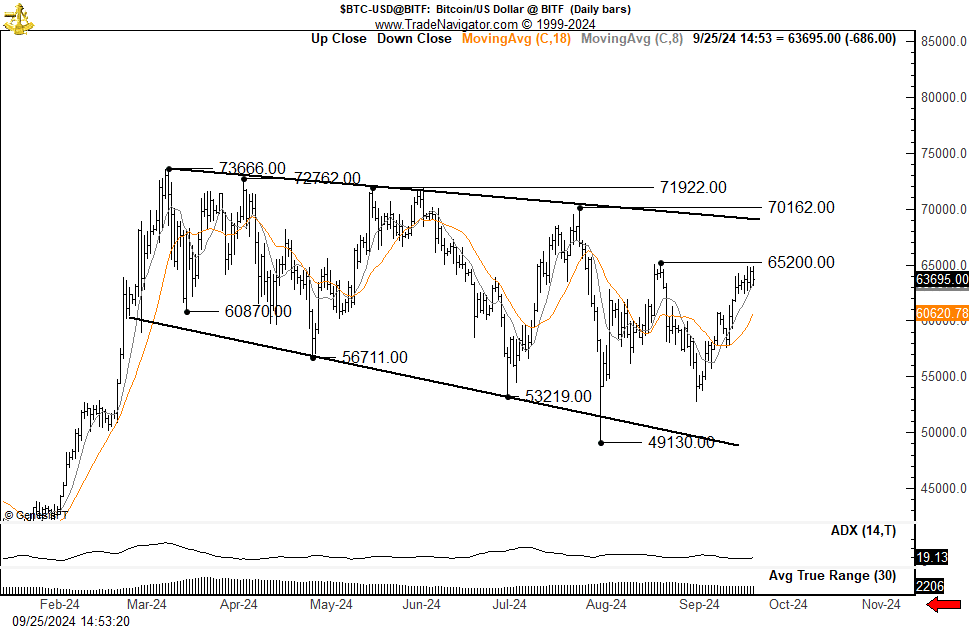
Source: X
As of press time, Bitcoin was trading around $63,838.14, showing a slight 0.01% gain in the last 24 hours and a 2.85% increase over the past week.
The market remains on edge, waiting for a decisive move as the price hovers near critical resistance levels.
Bollinger bands and momentum indicators
The price action is consolidating near the upper Bollinger Band, which suggests Bitcoin is testing resistance at around $63,800.
The widening of the bands indicates a potential increase in volatility, often seen before a significant market move. If Bitcoin manages to sustain momentum above this resistance, it could signal further upward movement.
Conversely, failure to maintain this level may result in a pullback towards the middle band near $60,355.
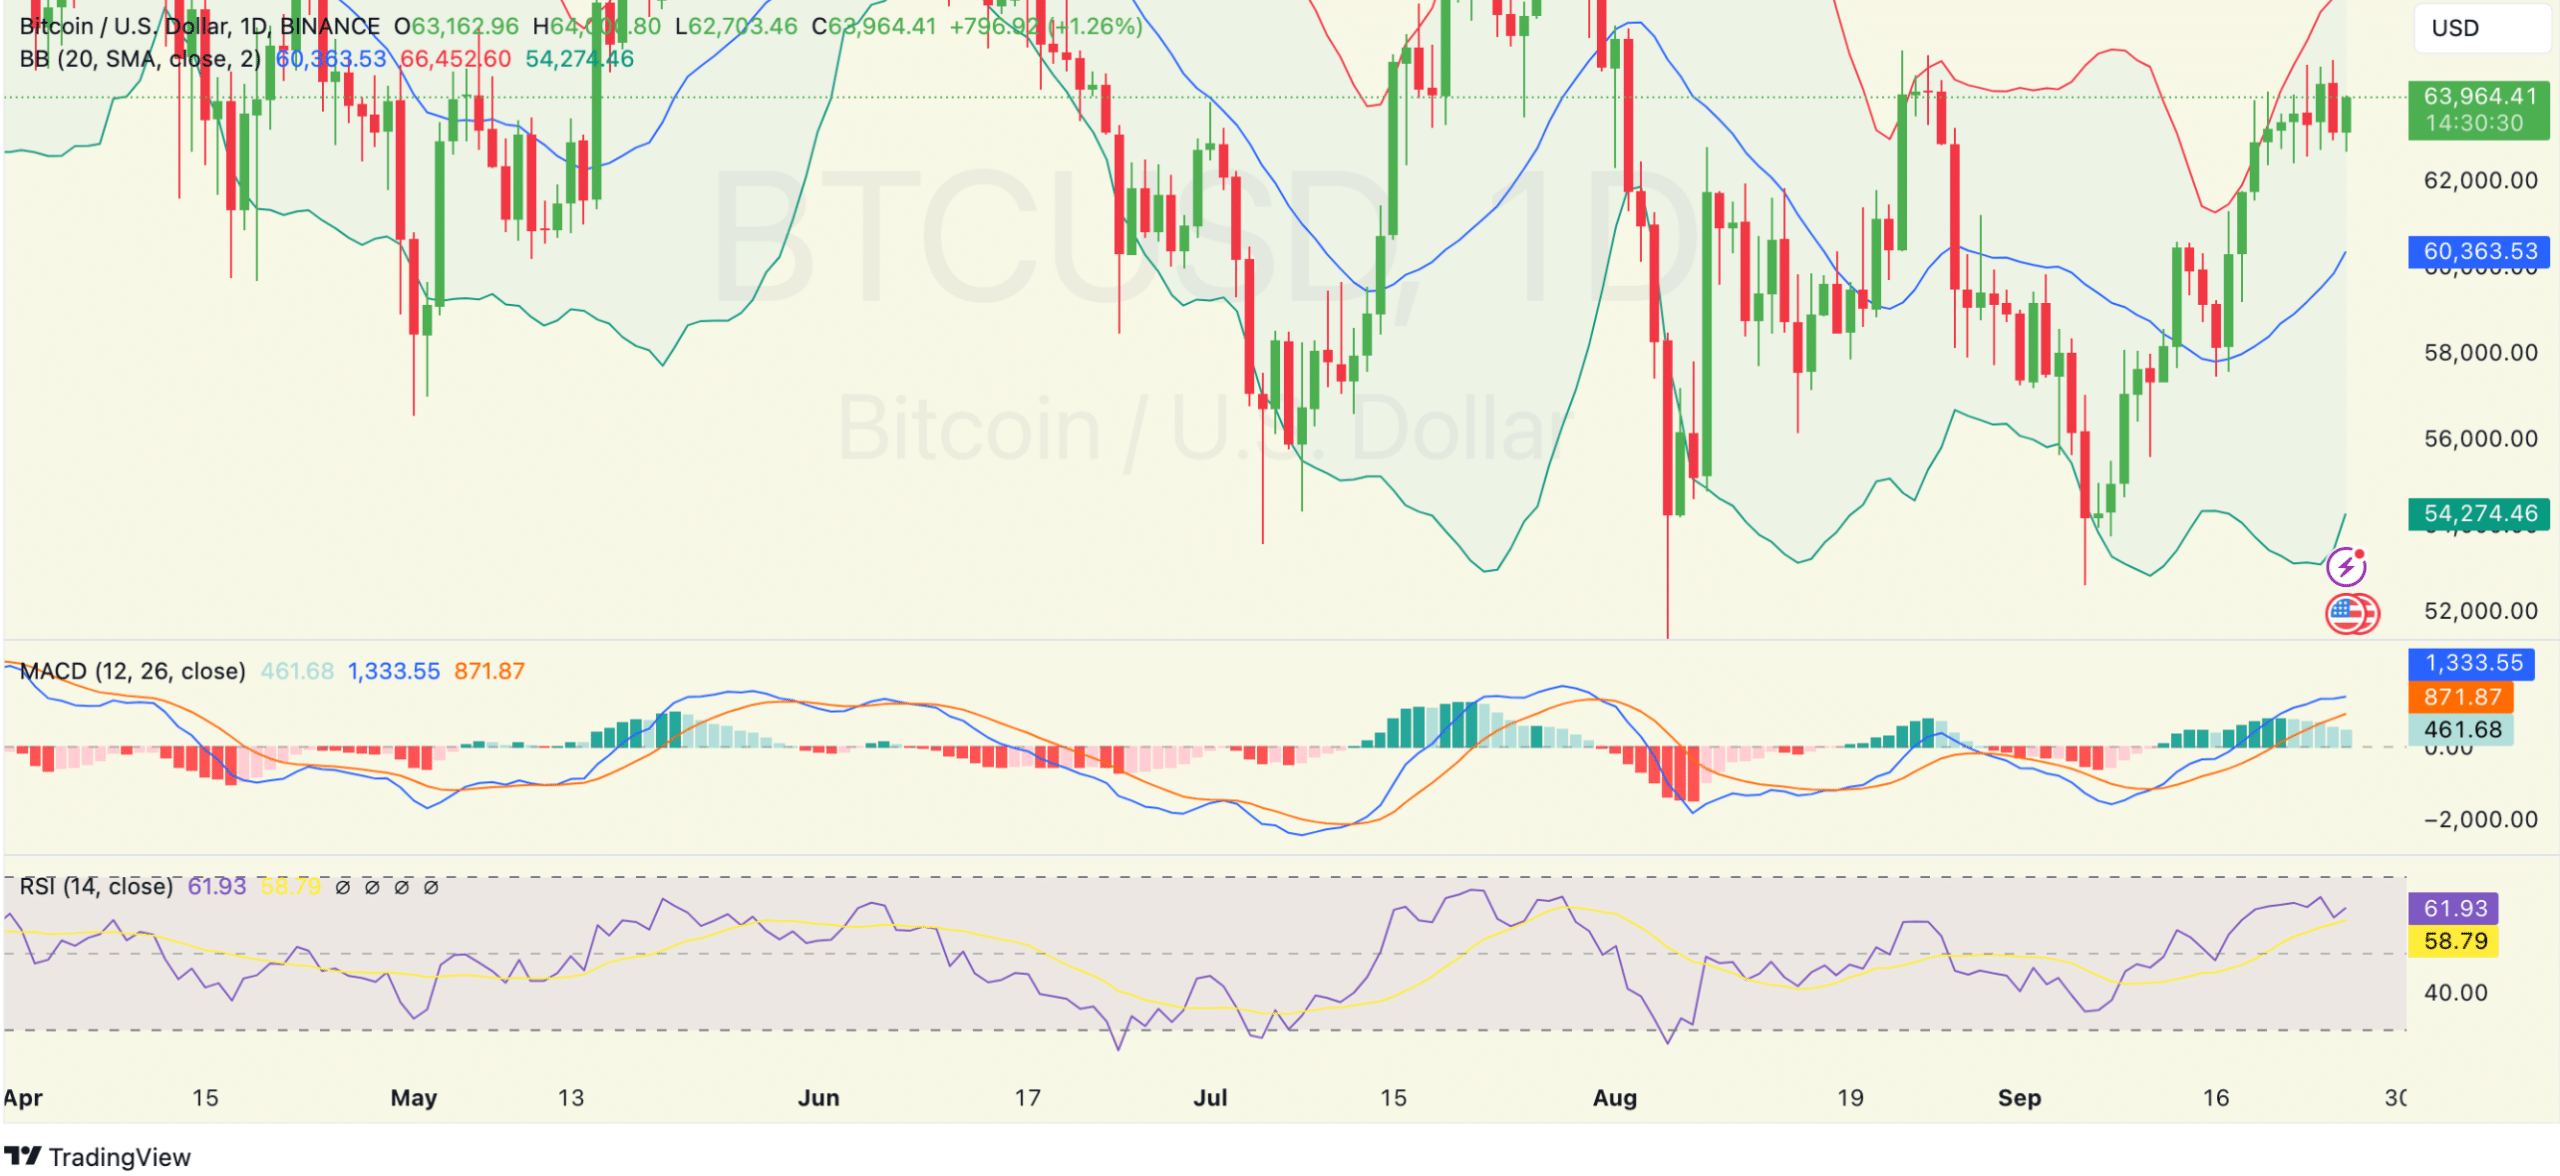
Source: TradingView
Momentum indicators, such as the MACD, show a bullish stance with the MACD line above the signal line and in positive territory.
However, declining histogram bars hint at a slowdown in bullish momentum, raising caution for traders.
A potential bearish crossover could serve as an early warning of a reversal, prompting careful monitoring of these technical signals.
The Relative Strength Index (RSI) is currently around 61, indicating Bitcoin is in bullish territory but not yet overbought.
This suggests there is room for further price appreciation before reaching overbought conditions, which typically trigger profit-taking.
Should the RSI rise above 70, traders may begin to see increased selling pressure, potentially leading to a price pullback.
Bitcoin profits near peak?
On-chain data shows that Bitcoin’s MVRV ratio is at 2.01, reflecting that the market value is double the realized value.
Read Bitcoin’s [BTC] Price Prediction 2024–2025
This ratio is rising, suggesting that holders are increasingly in profit, which could lead to selling if the ratio continues to climb.
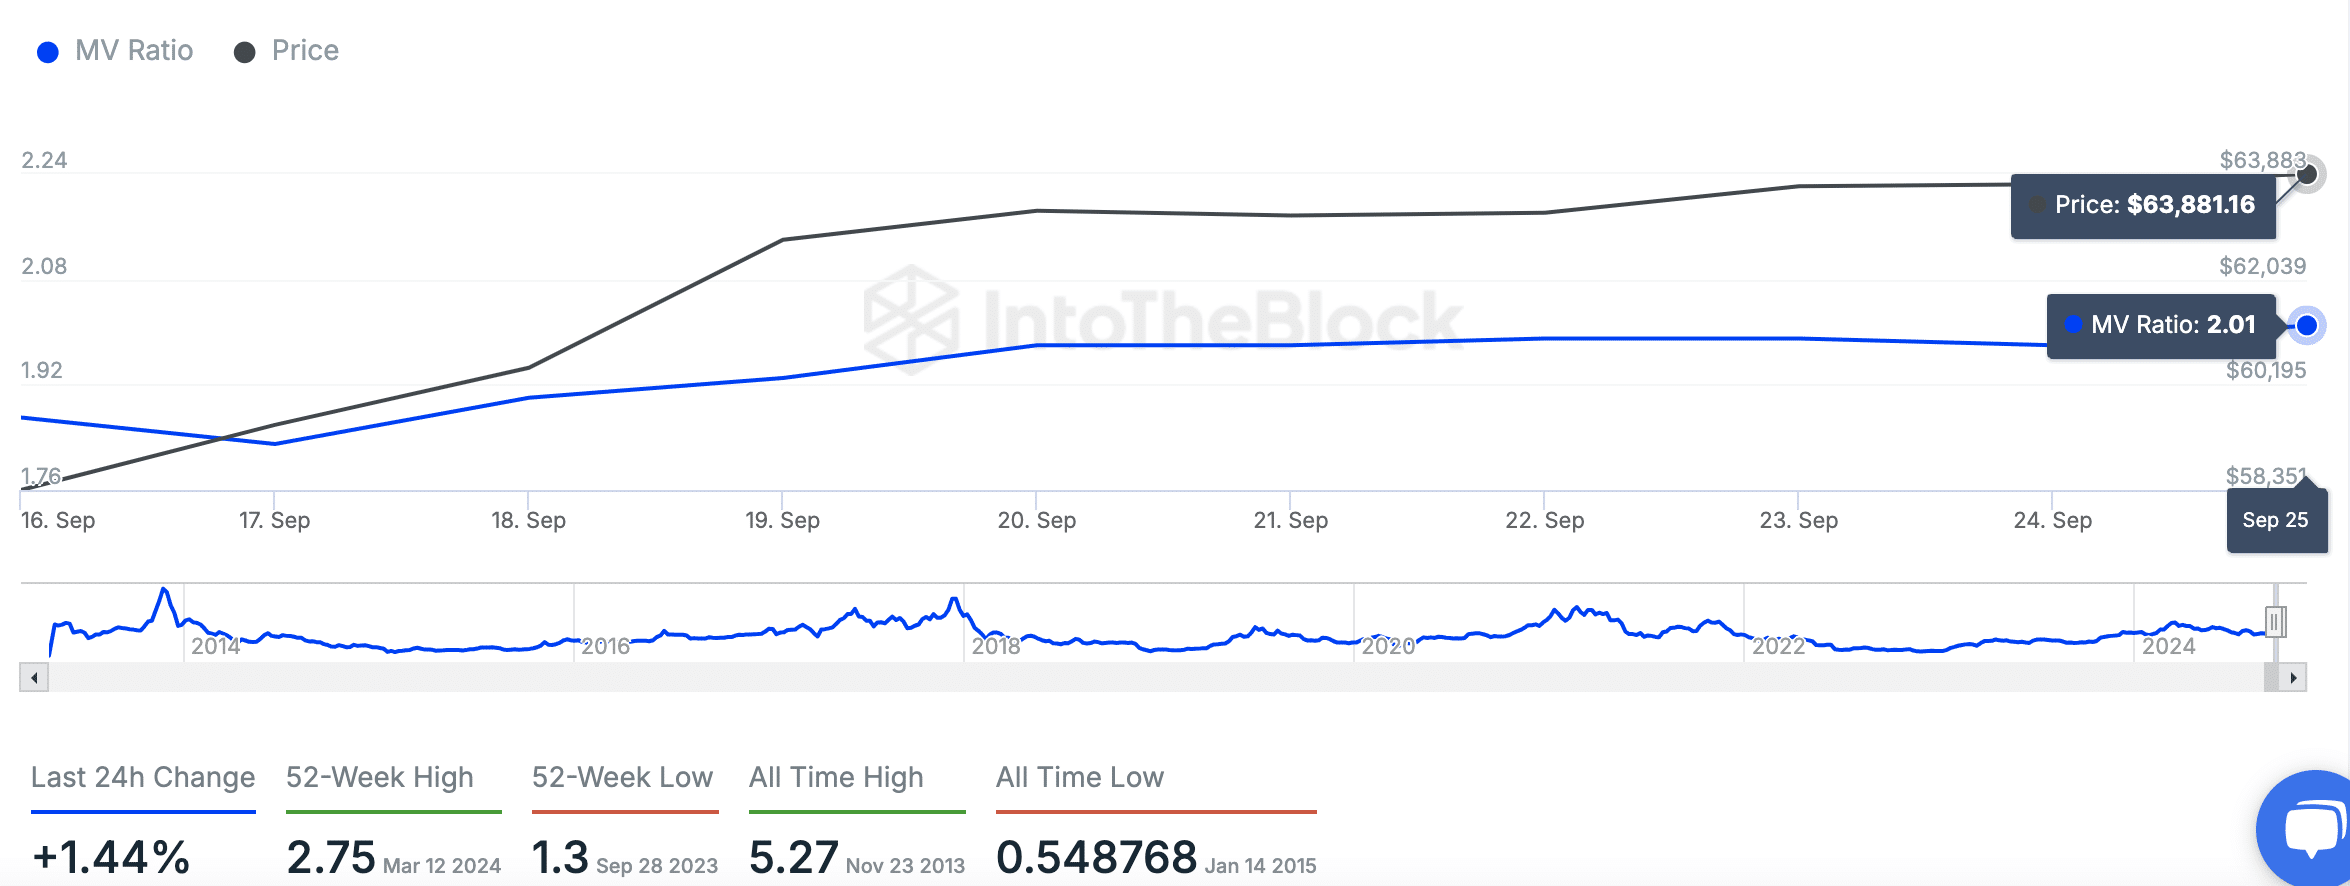
Source: IntoTheBlock
However, with the MVRV still below the 52-week high of 2.75, there remains room before reaching historically significant profit-taking levels.


