
- Analysts are highlighting several catalysts for BTC’s move to an ATH including a potential ‘golden cross’ formation.
- Further, both technical and on-chain data signaled a bullish outlook for BTC but after a pullback.
Bitcoin [BTC] experienced a surge over the weekend, briefly climbing back to the $60,000 mark. However, it has since returned to a press time price of $58,507.40.
Despite the price only increasing by a modest 0.14% over the last seven trading days, there has been a notable 33% rise in trading volumes, indicating a growing interest.
Although the current price movement appears sluggish, two analysts have argued that this trend is only temporary and has justified their outlook.
AMBCrypto has expanded on these analysts’ views and, according to our independent analysis, a sharp increase in Bitcoin’s price seems inevitable at this juncture.
Experts’ view on why a BTC rise is imminent
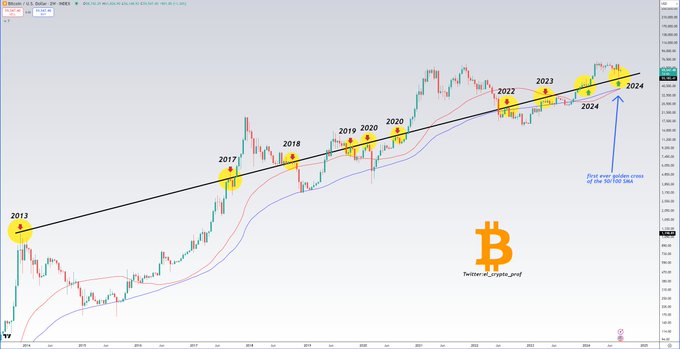
One crypto analyst, Moustache, in a “friendly reminder,” has highlighted an 11-year trendline pattern that BTC has respected both as resistance and support.
According to the chart he shared, it appears that this trendline is gradually becoming a crucial support again, as it had earlier this year.
Should BTC bounce off this trendline, we could witness a rapid ascent, similar to previous patterns when this trendline first acted as support.
Source: X
Moustache also noted that Bitcoin’s simple moving average indicates a potential rally.
He added
“First ever golden cross of the 50/100 SMA is also in the making.”
Should the 50 SMA (red line) cross above the 100 SMA (blue line), BTC is expected to see a notable increase in value, potentially rising into the $60k zone or higher.
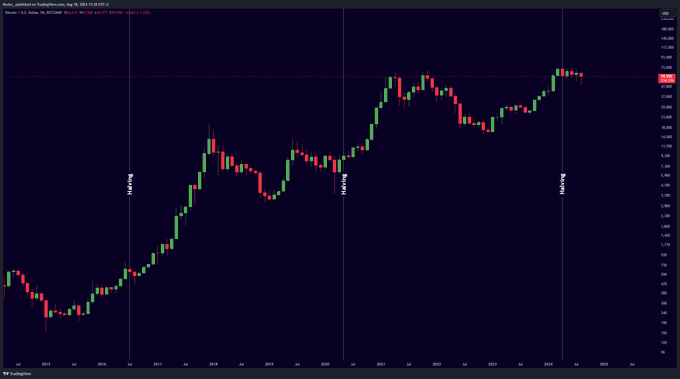
While this bullish outlook is clear, another analyst, Mister Crypto, has added to the optimistic sentiment. He shared a chart demonstrating BTC’s performance post-Bitcoin halving.
In both scenarios he presented, from 2016 and 2020, BTC experienced a significant price increase post-halving, reaching new all-time highs each time.
Source: X
Mister Crypto described this pattern as:
“A #Bitcoin supply shock is coming”
This suggests that the value of BTC could soon oscillate between the $60k and $70k range if this historical pattern continues to hold.
Golden Cross might drive BTC’s rise to $70k
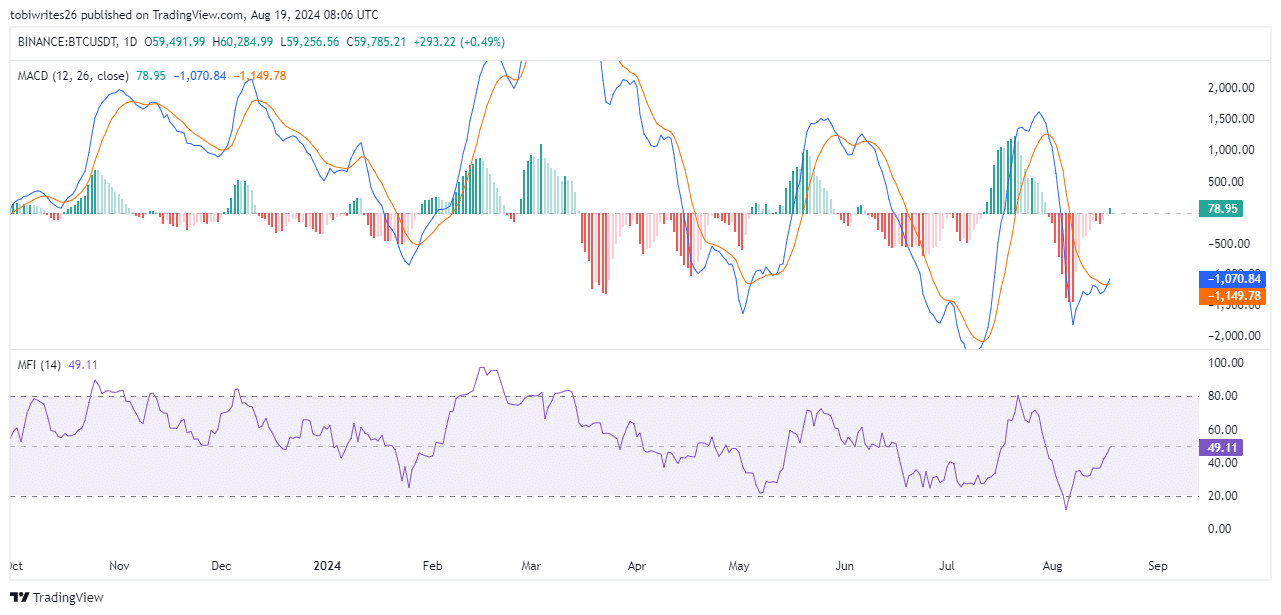
According to AMBCrypto’s latest analysis, BTC has just witnessed a golden cross on the moving average convergence and divergence (MACD) technical indicators.
A golden cross occurs when the MACD line (blue) crosses above the signal line (orange), giving a sign of a bullish turn that typically predicts a significant upward movement in price.
Source: Trading View
For instance, when this pattern last appeared on July 12, BTC’s price rose from a low of $56.5k to a high of approximately $70k by July 29. If this pattern holds, BTC could reach similar heights in the coming weeks.
Further analysis of the Money Flow Index (MFI)—a technical indicator that merges price and volume data to pinpoint overbought or oversold conditions and anticipates price reversals—indicates that bulls are gradually taking control of the market.
The MFI has been climbing steadily over the past few days and currently stands at 49.11. Should this uptrend persist, Bitcoin could soon be trading at or above $70k.
Anticipated pullback before a leg-up
Analysis of Netflow on BTC across weekly and daily timeframes Coinglass indicates a predominantly bullish trend.
A negative net flow suggests BTC holders are transferring their assets from exchanges to cold storage, implying they are not planning to trade their BTC in the near future.
This reduction in BTC supply on exchanges could drive up demand, potentially pushing prices higher.
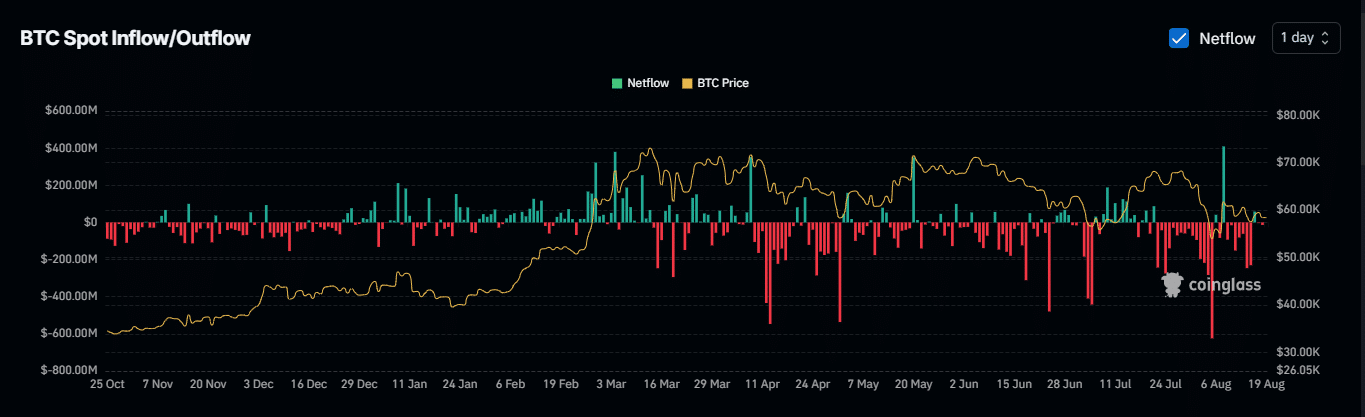
Source: Coinglass
The open interest (OI), representing the total number of unsettled derivative contracts like futures or options, provides further bullish signals.
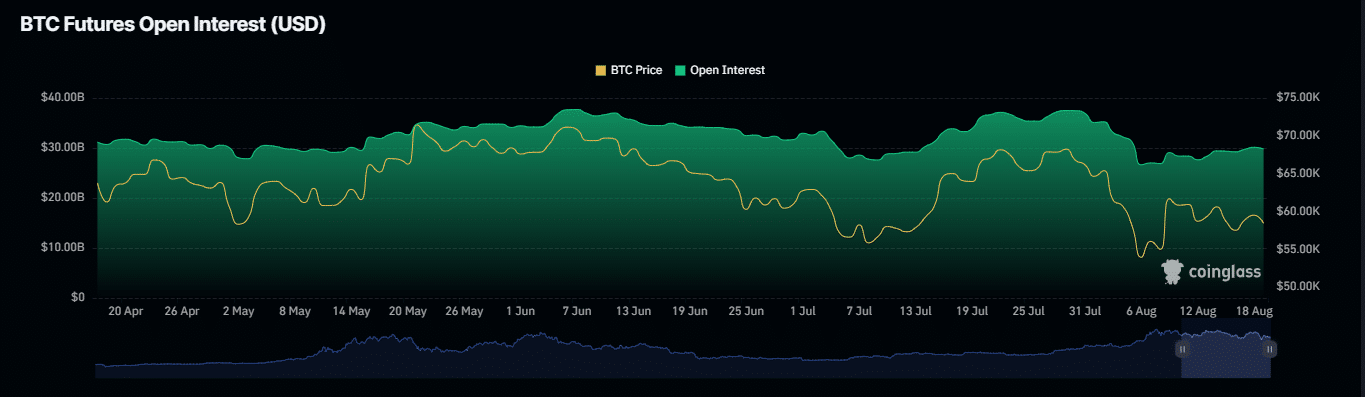
Source: Coinglass
From August 12 to August 19, OI rose from $27.64 billion to $29.81 billion, indicating growing bullish momentum in anticipation of a rally.
However, in the short term, many long traders have faced liquidation according to a dataset from Coinglass.
Read Bitcoin’s [BTC] Price Prediction 2024-25
This occurs when traders with long positions are forced to close their contracts as the market moves against them, often resulting in a sell-off to meet margin requirements.
This situation suggests that Bitcoin might experience a downward push before it can rally to potentially new highs.