Bitcoin’s halving countdown – Does this ratio’s value suggest BTC is ‘priced in?’
Many expected Bitcoin to hike 50x or 100x immediately before or after the halving. It hasn't, and it might not, because...

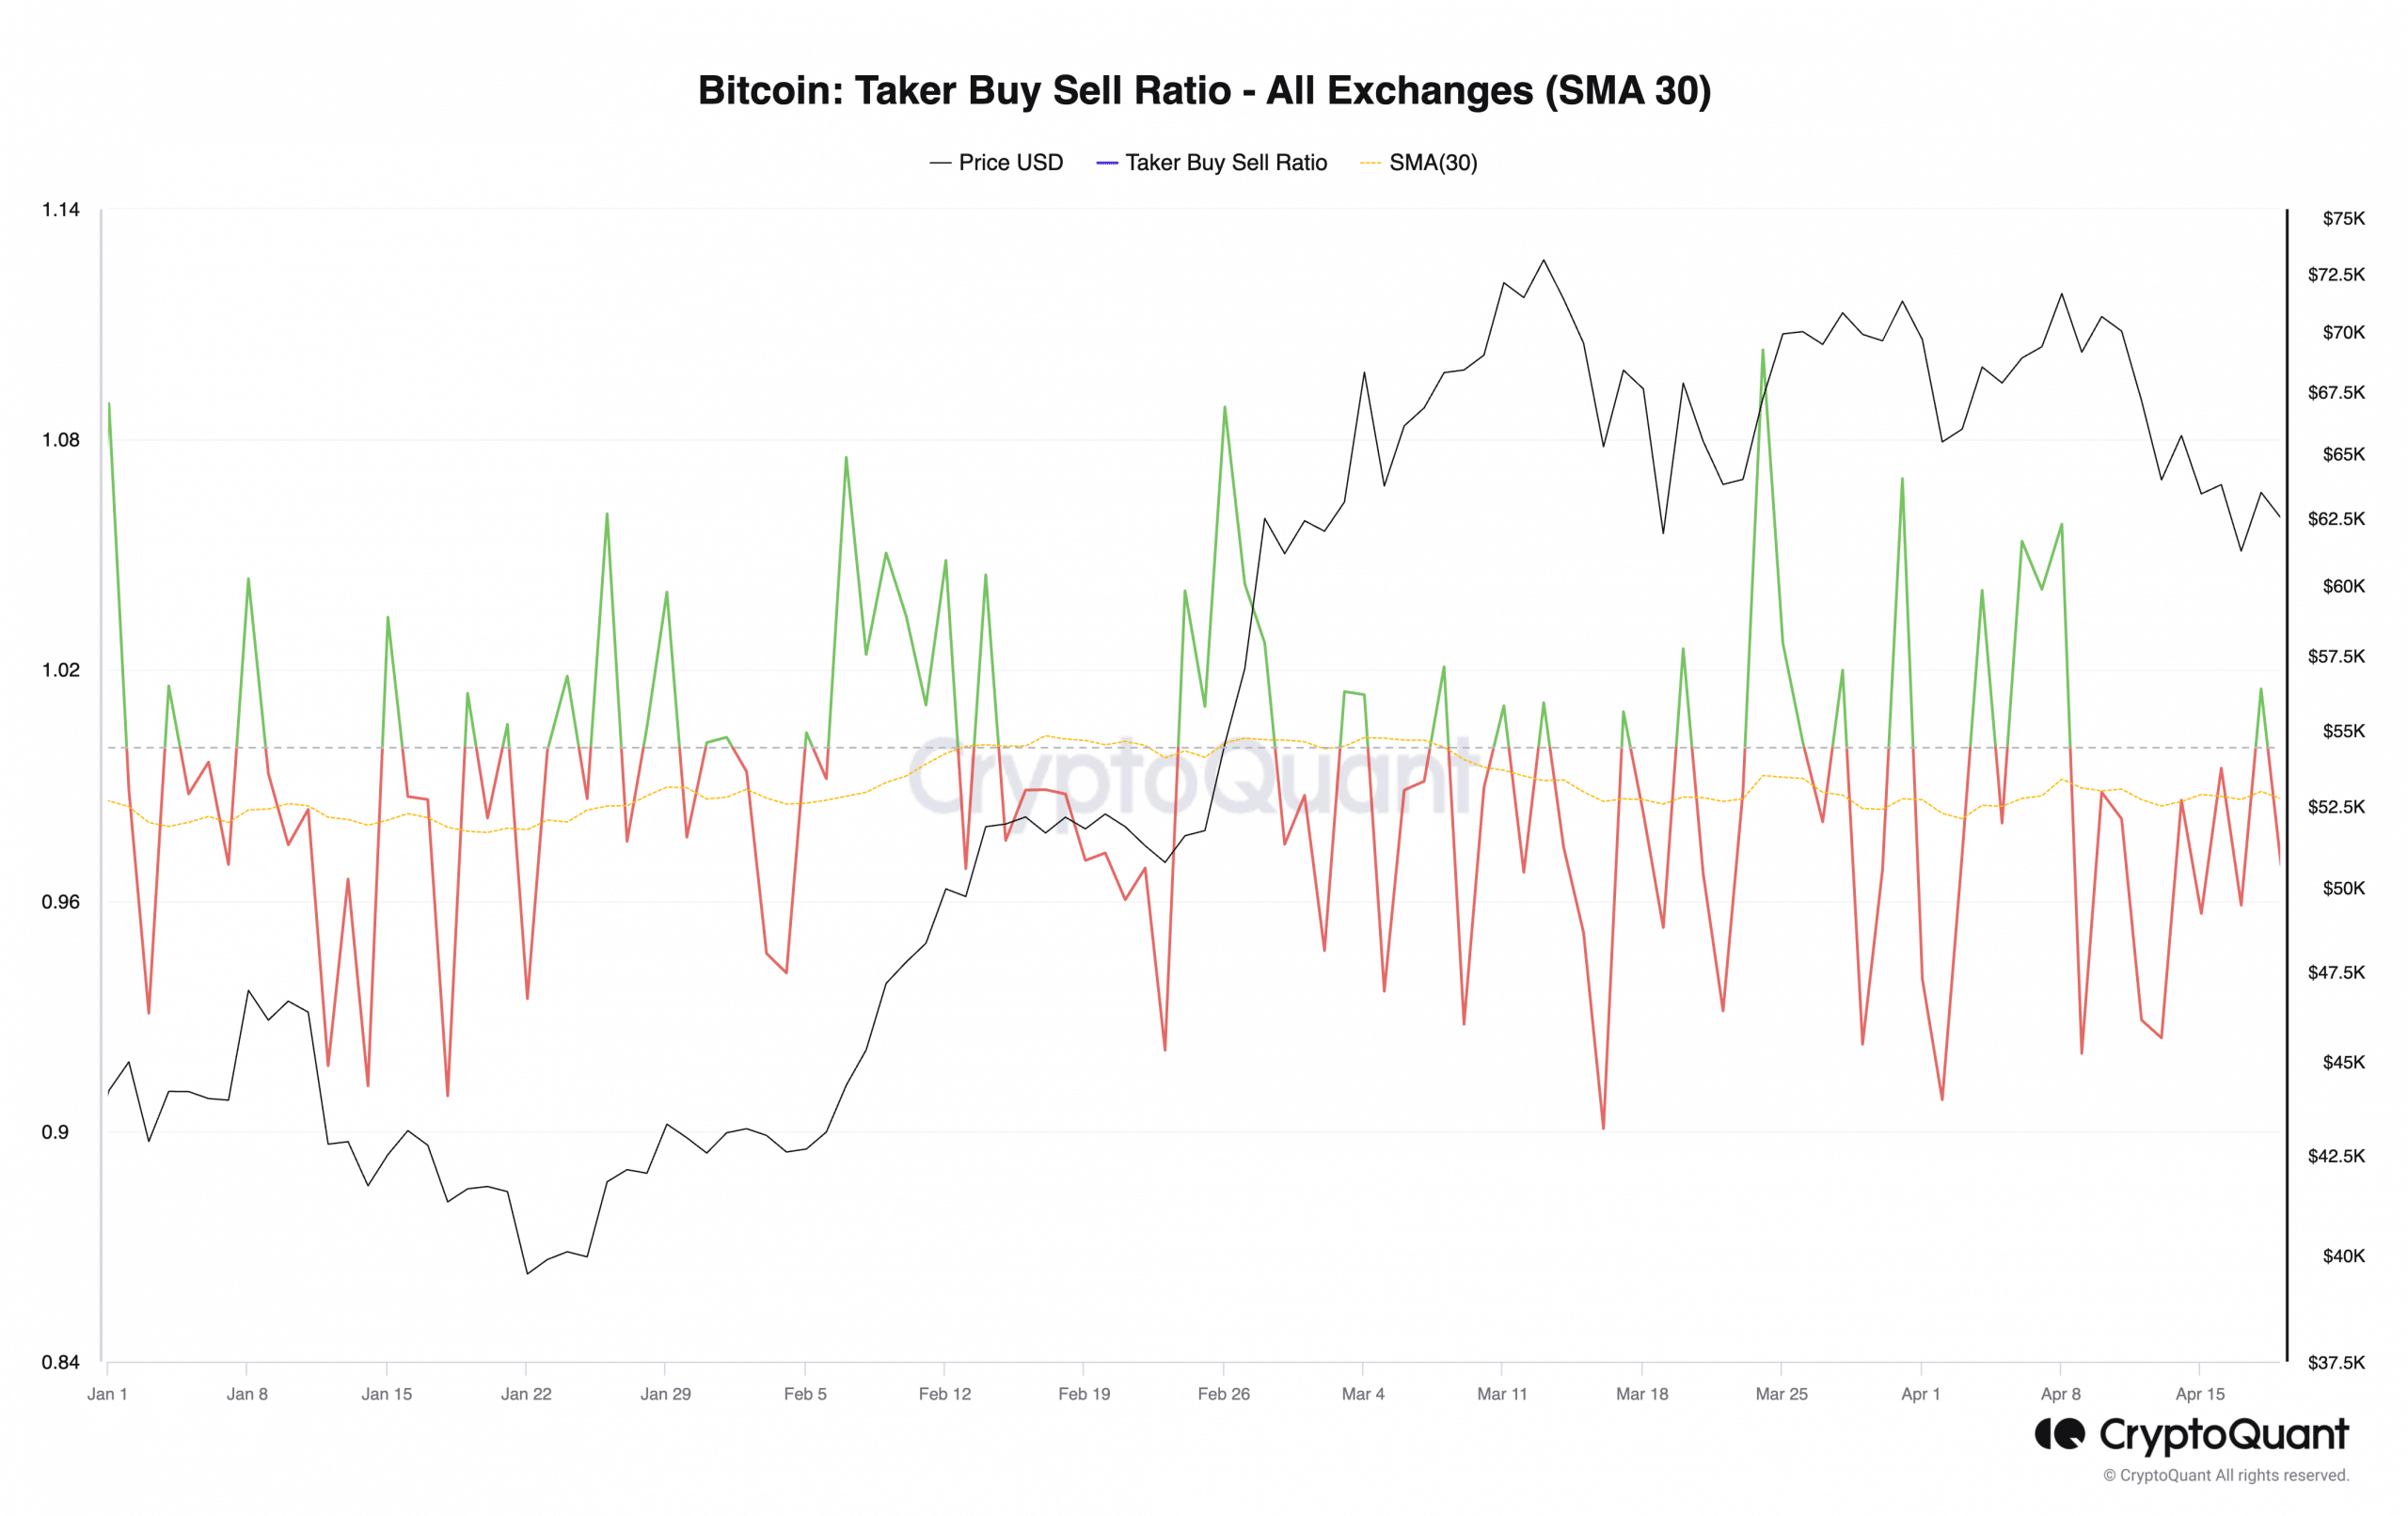
- At press time, Bitcoin’s taker buy-sell ratio was 0.95
- Reading pointed to an uptick in selling pressure in the market
Bitcoin’s [BTC] taker buy-sell ratio has fallen below its center line to return a negative value as the halving event draws nearer, according to data from CryptoQuant.
BTC’s taker buy-sell ratio measures the ratio between the coin’s buy volume and sell volume in its Futures market. When its value exceeds 1, it indicates more buy volume than sell volume. Conversely, a value less than 1 means more sell volume than buy volume.
At press time, this metric had a reading of 0.95, as per CryptoQuant’s data.
Market bears have emerged
An assessment of BTC’s markets revealed a spike in bearish sentiments over the past 24 hours. The halving event is expected to occur during late trading hours on 19 April or early 20 April, and market participants are starting to lose hope for a post-halving rally.
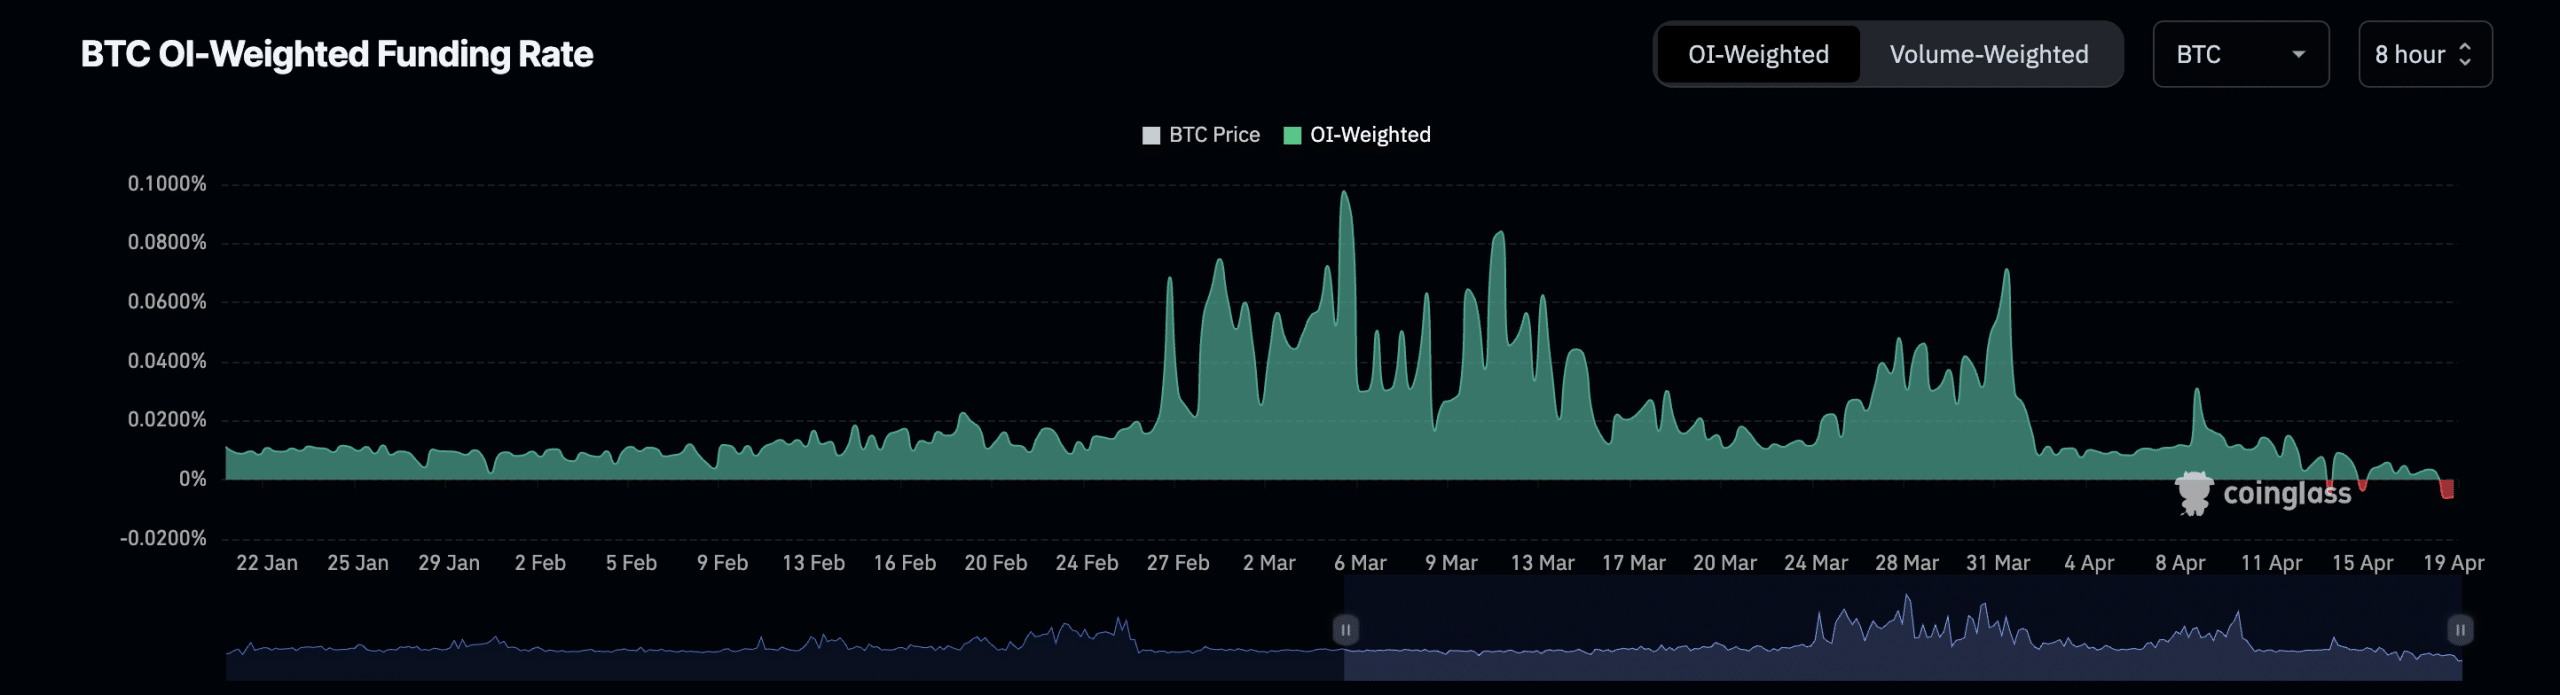
In fact, BTC’s funding rate across crypto-exchanges was negative at press time, suggesting a spike in the number of short positions opened.
Additionally, according to Coinglass, this is just the second time Bitcoin has recorded a negative funding rate since the market rally began in October 2023. The first time was on 15 April.
AMBCrypto found that during the period under review, BTC’s Futures market saw an uptick in trading volume and a corresponding rise in open interest. As of this writing, BTC’s Futures open interest was $31.2 billion, rallying by 1% in the past 24 hours.
Although the growth in BTC’s open interest suggests an increase in the number of open contracts in the coin’s Futures market, the negative funding rate indicates that there are more traders in short positions than those expecting its price to climb as the halving event closes in.
Read Bitcoin’s [BTC] Price Prediction 2024-25
Flashing red
Bitcoin’s performance on the 1-day chart confirmed that the market remains dominated by bearish sentiments. For example, its Awesome Oscillator, which measures market momentum, projected south-facing red histogram bars at press time. This has been the trend since 12 April. Here, downward-facing red bars on an asset’s Awesome Oscillator are interpreted as a bearish sign – A sign of a hike in selling pressure.
Similarly, readings from its Elder-Ray Index revealed that it has returned only negative values since 12 April.
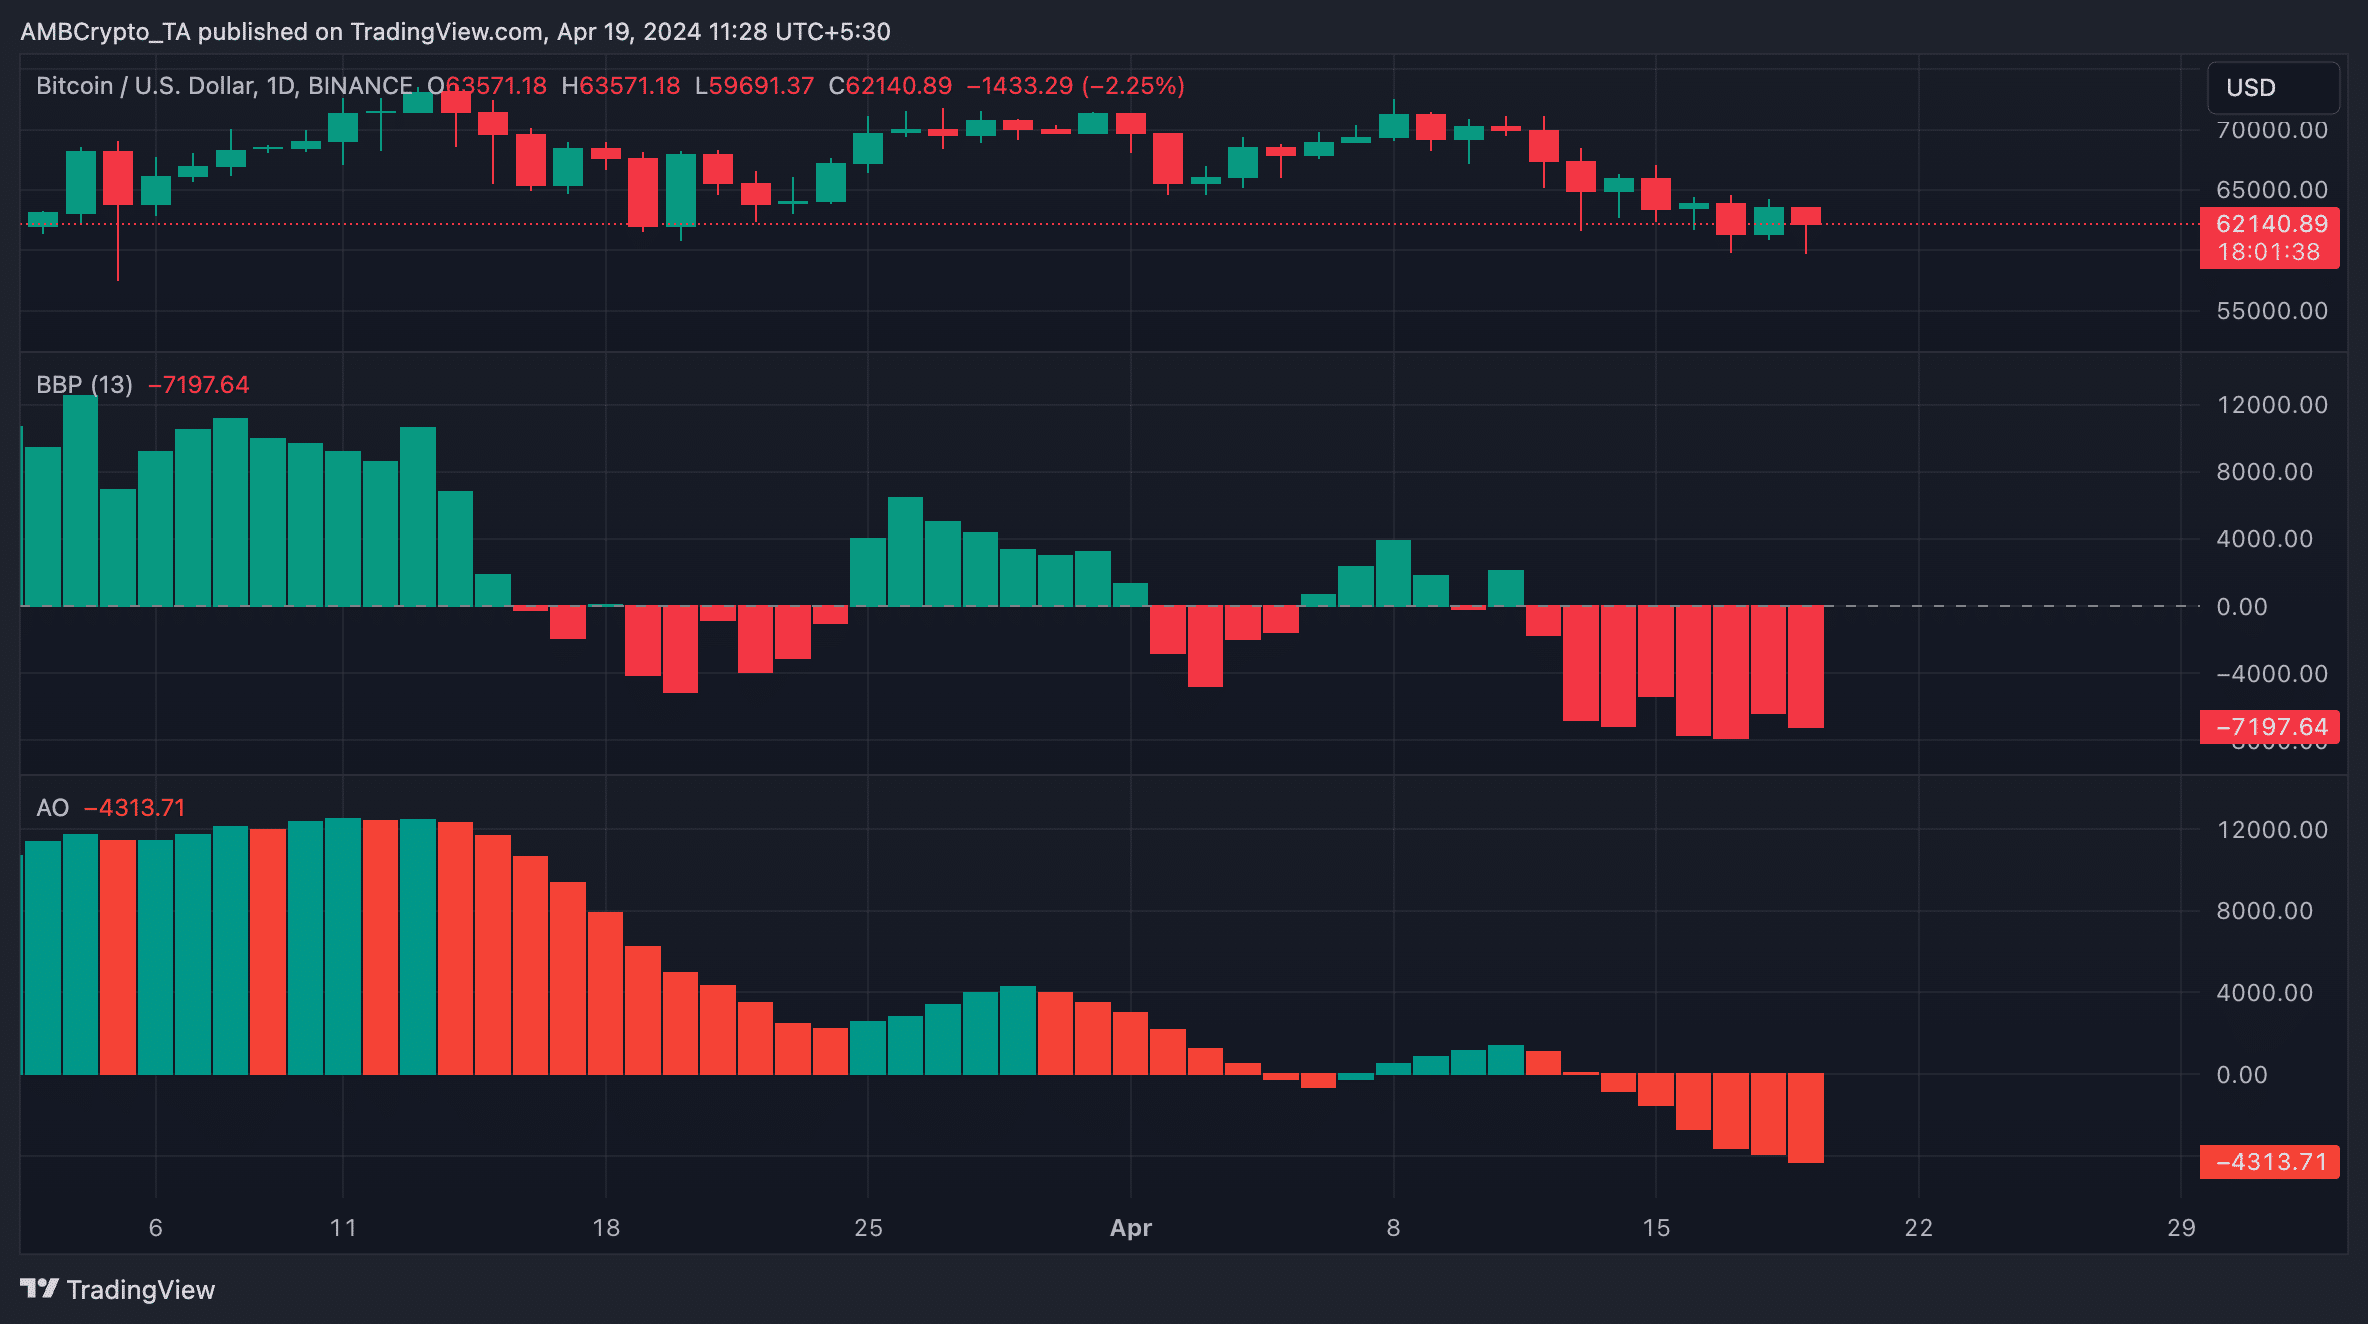
This indicator measures the relationship between the strength of buyers and sellers in the market. When its value is less than zero, bear power dominates the market.
Simply put, those who expected Bitcoin to rally by 50x or 100x immediately before and after the halving could be wrong. Maybe, just maybe, the episode could already be priced in on the charts.