Bitcoin’s history repeats itself? Why a bull run is on the cards

- Bitcoin has experienced a similar dump that happened in October 2023.
- A technical indicator turned bearish on the king coin.
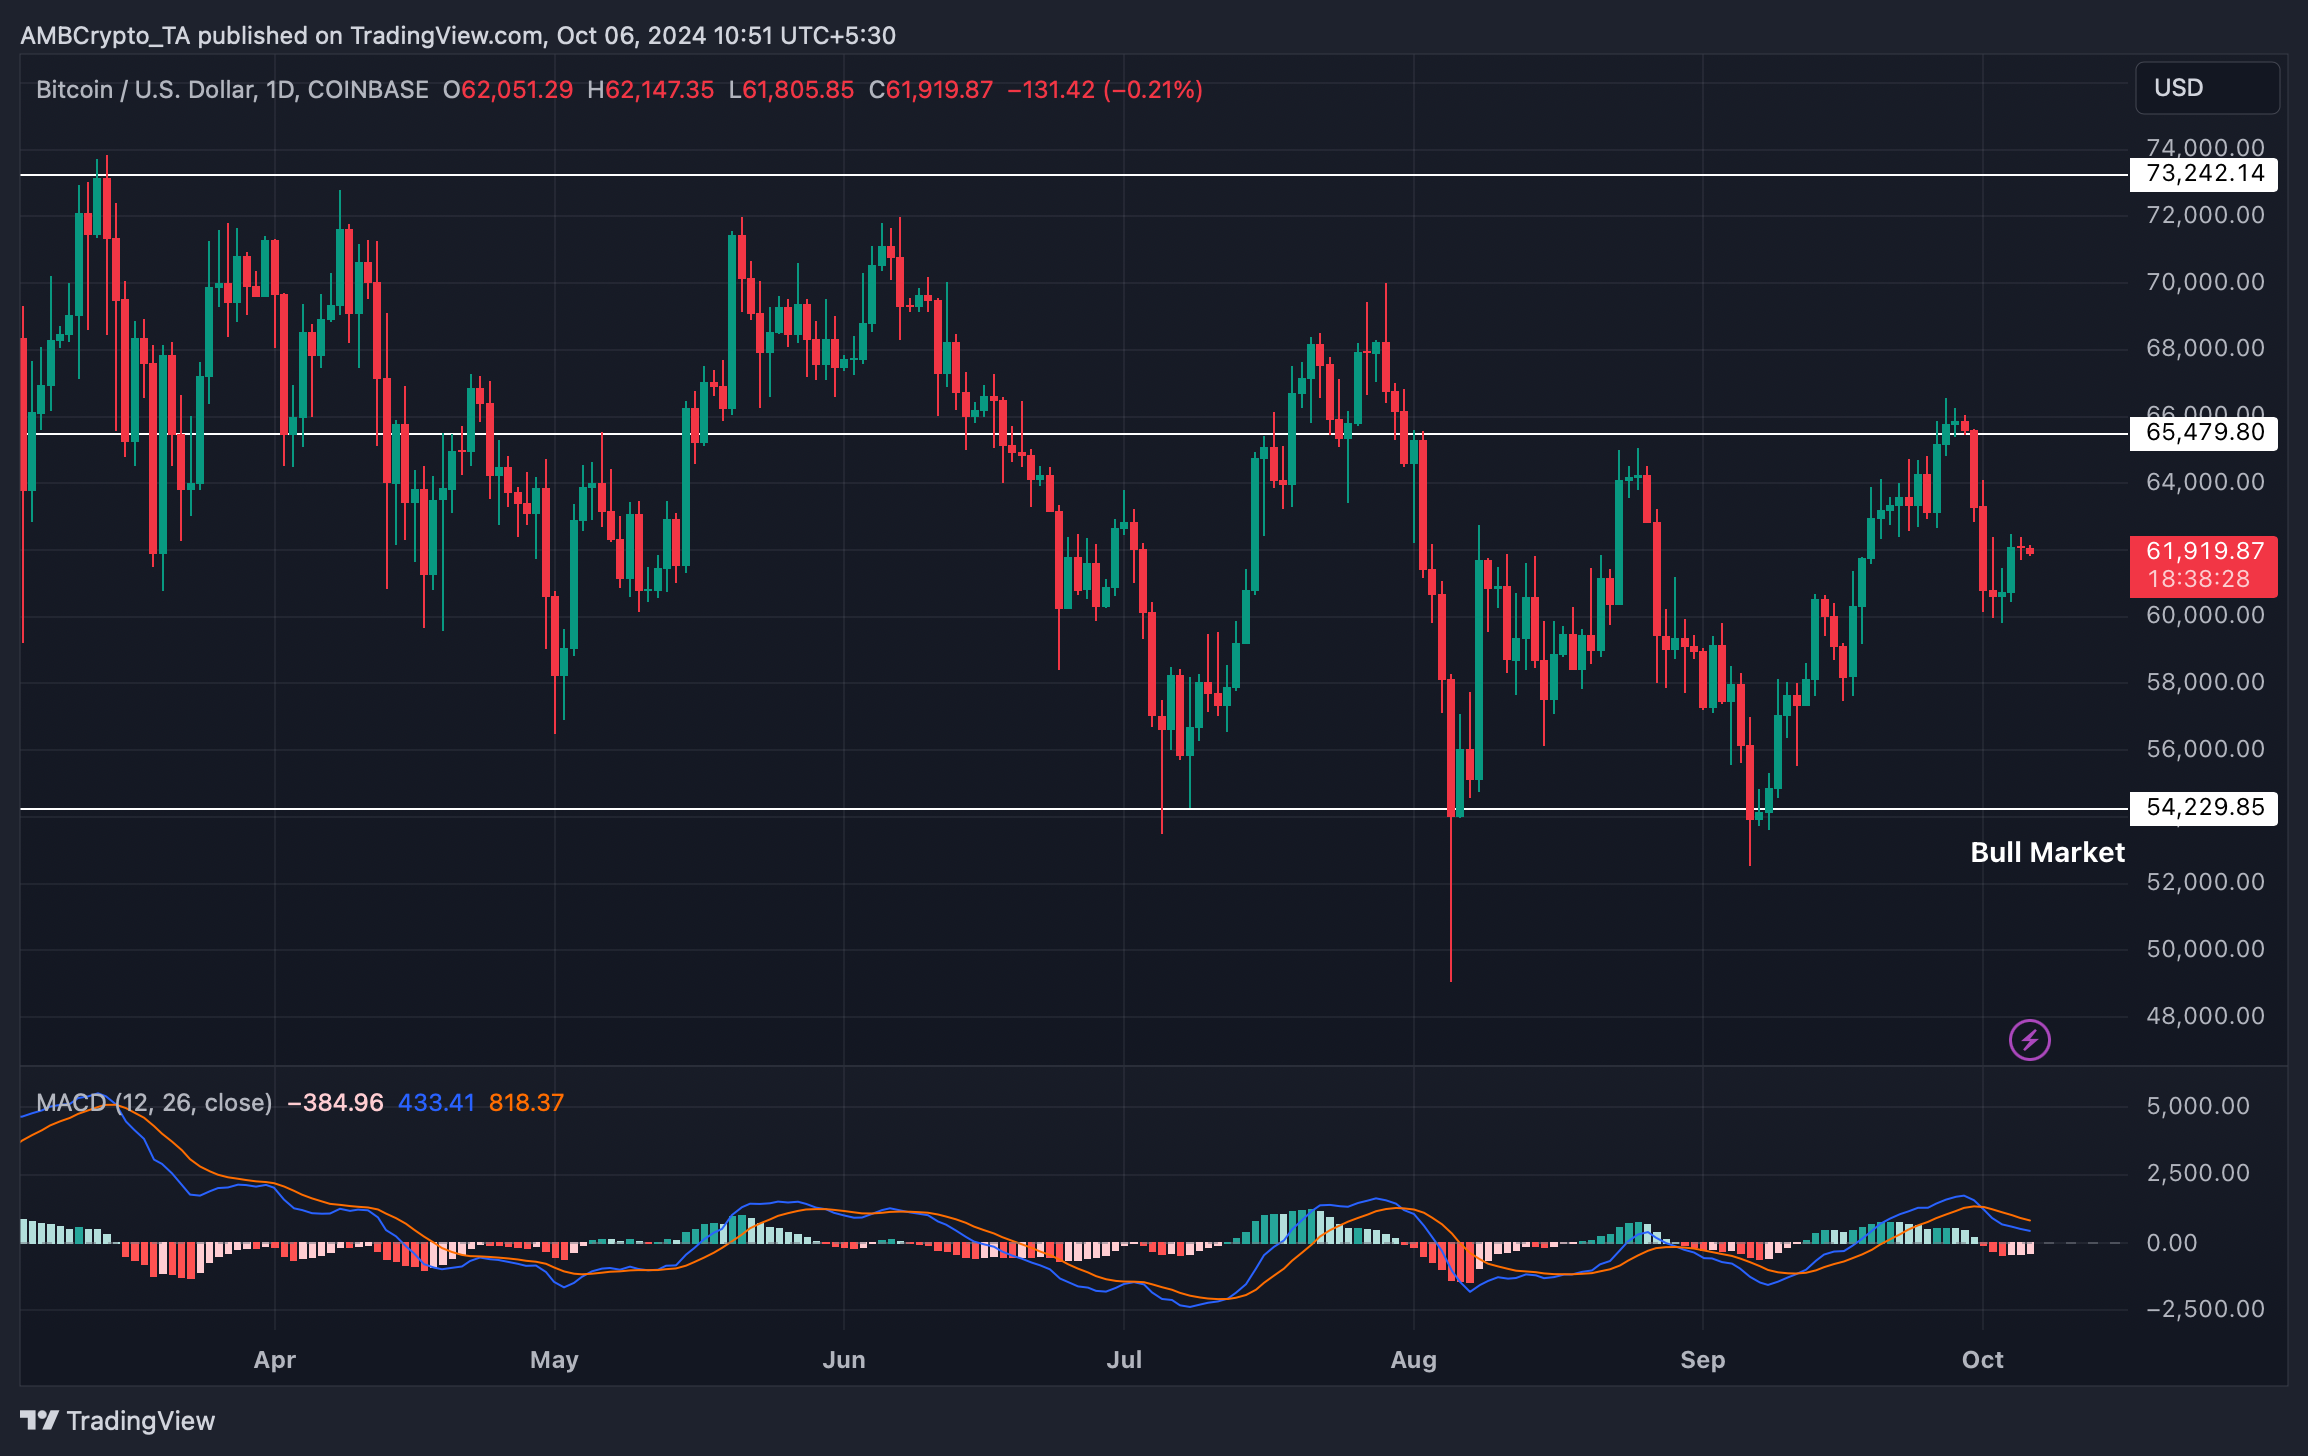
Bitcoin [BTC] has been quietly approaching the $62k mark over the last few days. Though this latest development might not seem massive, this just might be the beginning of a new bull rally.
Bitcoin to repeat history?
AMBCryptro reported earlier that Bitcoin was consolidating and was slowly approaching $62k. Also, buying pressure on the coin was rising, which often resulted in price hikes.
At press time, the king coin was trading at $61,865.46. Alongside this, latest analysis revealed that BTC was following a past trend.
Mister Crypto, a popular crypto analyst, recently posted a tweet highlighting a similar trend that was seen back in 2023. Last year, BTC was in a consolidation phase, after which it experienced a dump.
As per the tweet, a similar scenario has now appeared. If history repeats itself, then it won’t be surprising to see BTC beginning a bull rally in the coming days.
Apart from this, Titan Of Crypto, yet another popular crypto analyst, posted a tweet revealing an interesting development. The tweet mentioned that Bitcoin bounced from the Gaussian Channel.
For starters, the Gaussian Channel Indicator is a technical analysis tool that helps traders identify price trends and potential trading opportunities.
If we take a look back, whenever such bouncebacks have happened, BTC’s price has always rallied. Therefore, there were chances of that happening on this occasion as well.
What to expect from Bitcoin
AMBCrypto then assessed the king coin’s on-chain data to better understand whether all of them hint at a price rise. As per our analysis, BTC miners were willing to hold their assets.
This was clear from BTC’s green Miners’ Position Index.
Its Binary CDD was also green, meaning that long-term holders’ movements in the last seven days were lower than average. They have a motive to hold their coins.
However, the coin’s aSORP looked bearish. The metric revealed that more investors were selling at a profit. In the middle of a bull market, it can indicate a market top.
Read Bitcoin’s [BTC] Price Prediction 2024–2025
Lastly, we took a look at Bitcoin’s daily chart. Despite the positive metrics mentioned above, BTC’s technical indicator MACD displayed a bearish crossover. This suggested that investors might witness a price drop.
If that happens, then BTC might again plummet to its support at $54k soon.


