Bitcoin’s latest ‘death cross’ and what it means for its price, traders like you

- Bitcoin rose to reclaim $62,000 on 8 August, but the price has since struggled
- On-chain indicators flashed positive signals, but a moving average crossover on the daily chart pointed to a looming setback
Relief gains on Thursday helped crypto prices across the board recover from multi-month lows posted after last weekend’s crypto and stock market bloodbath. In fact, Bitcoin (BTC) traded as high as $62,500 at the peak of its rebound on Thursday.
BTC’s bullish speculators vainly attempted to hold on to the previous day’s gains on Friday, but the flagship crypto pulled back to lower heights.
At the time of writing, however, its press time price action showed that buyers have been gaining control after the significant selling pressure earlier this week. Still, analysts are divided on whether the previous heavy losses were a bear trap or a precursor to further declines.
On-chain analysis signals trend reversal
On-chain indicators suggest the market is mainly bullish, despite recent uncertainties.
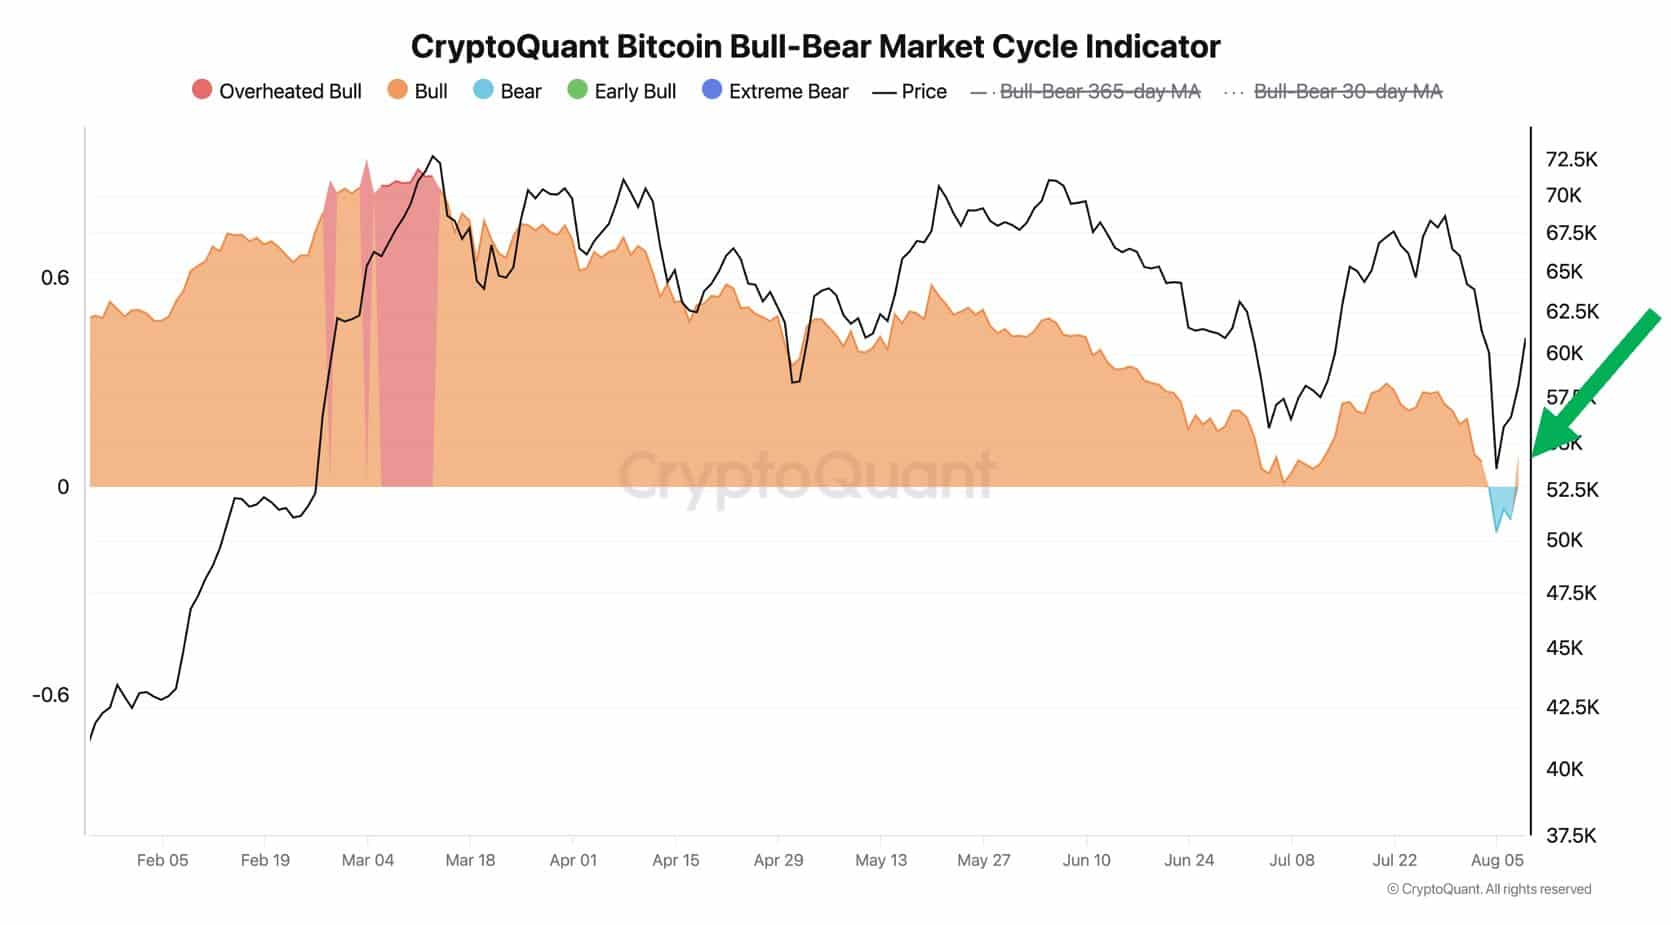
CryptoQuant founder Ki Young Ju opined in a post on 9 August,
“Most Bitcoin on-chain cyclical indicators that were hovering near the borderline have now shifted back to signaling a bull market.”
Young Ju specifically pointed out that Bitcoin’s bull-bear market indicator has turned bullish again following Bitcoin’s quick rebound in the last 36 hours.
The indicator, which broadly tracks sentiment among market participants, flashed red this week after Bitcoin’s steep decline to $49,751 on 5 August.
BTC/USDT technical analysis
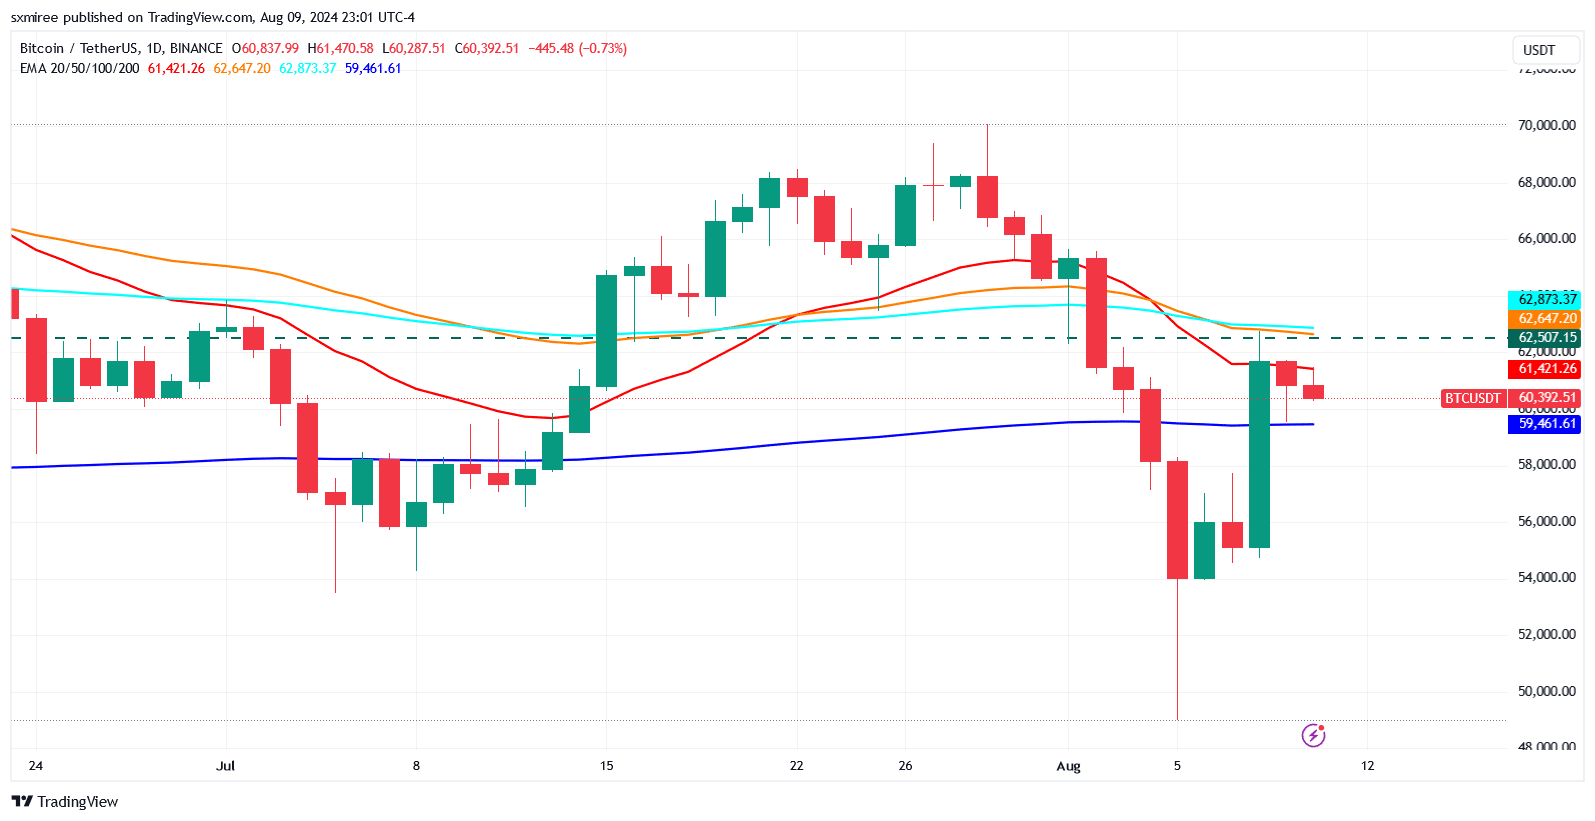
Bitcoin (BTC) bulls are attempting to form psychological support at the $60,000-mark. A recovery above its current range will attract selling pressure if the BTC/USDT pair fails to overcome the resistance just below the 100-day exponential moving average (EMA), which stood at around $62,873.
A rejection at the level would set the pair up to retest major support at this week’s six-month lows around $49,900.
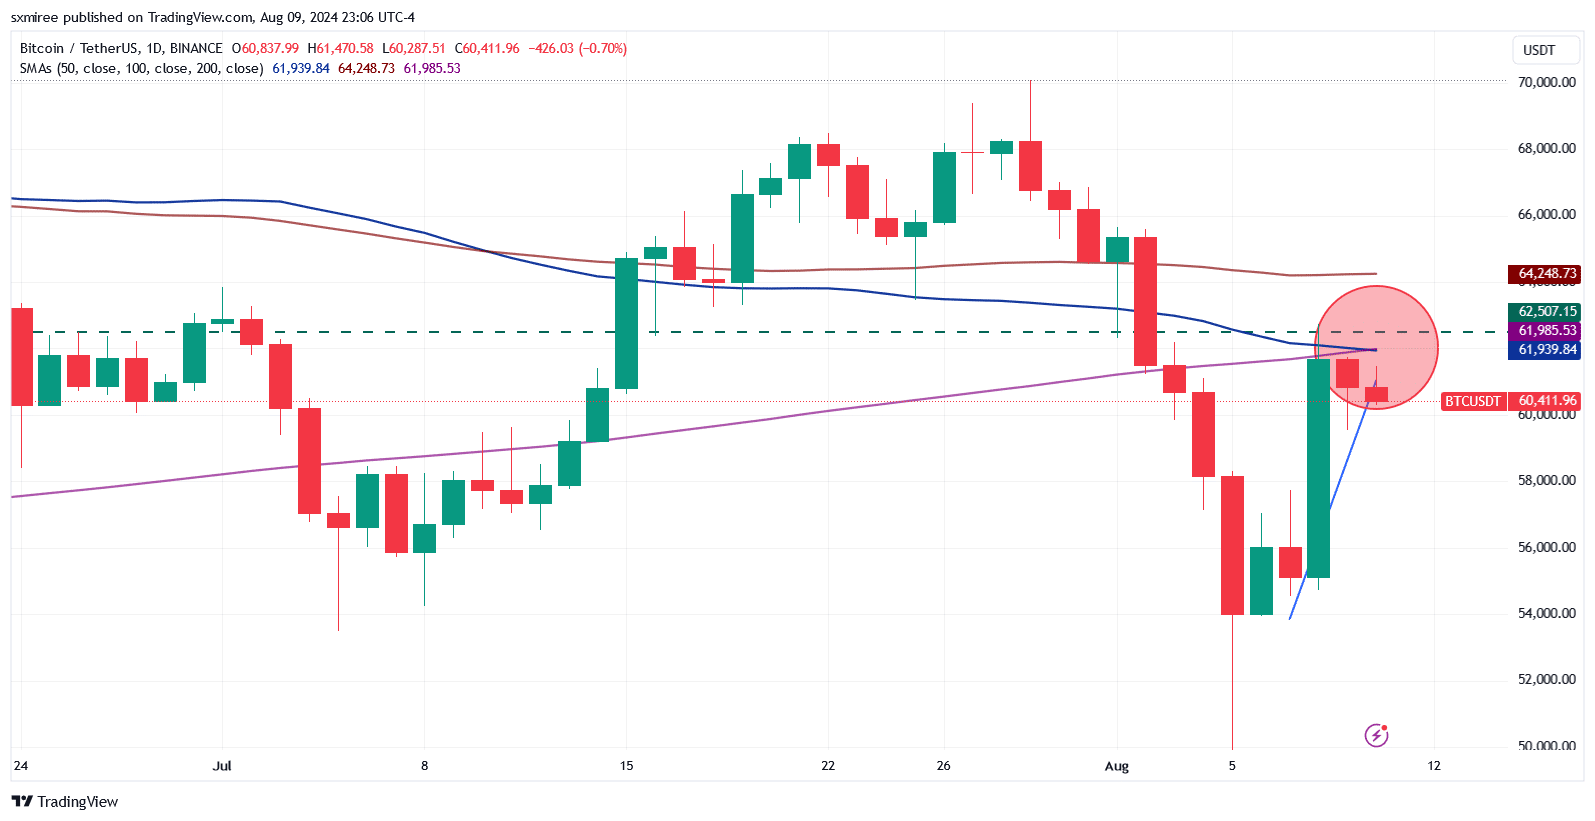
Here, it’s worth pointing out that on the hourly chart, the BTC/USD pair maintained its course above a key bullish trend line backing the support.
On the daily chart, BTC/USD formed a death cross after its downward-sloping 50-day simple moving average (SMA) crossed below the 200-day SMA. A death cross occurs when a shorter-term moving average crosses below a longer-term moving average and is mostly associated with increasing bearish sentiment and a potential sell-off.
The 50-day and 200-day SMAs stood at $61,939 and $61,985, respectively, at the time of writing.
Though the formation of a death cross is historically considered a sign that the asset’s recent price performance is weakening relative to its longer-term trend, it doesn’t always guarantee a sustained market downturn.
In the most recent instance of a death cross formation, for instance, Bitcoin didn’t head into a more prolonged downtrend. Rather, it registered modest gains on the charts.


