Bitcoin
Bitcoin’s loss could be Solana’s gain – Here’s why $187 target may be in sight
SOL could be the key beneficiary if an important Bitcoin metric falls on the charts.
- A bearish divergence appeared on BTC’s dominance chart
- If SOL turns bullish, then it might target $187 in the coming weeks
Bitcoin’s [BTC] dominance has been rising for multiple weeks now, suggesting that altcoins might have to wait longer for a rally. However, the situation can change soon as a bullish divergence seemed to appear on the charts. This might allow altcoins like Solana [SOL] to gain bullish momentum soon.
Hence, it’s worth taking a look at the odds of an altcoin summer.
Bitcoin dominance to fall soon?
BTC dominance has consistently remained well above the 50% mark. Whenever this metric rises, it indicates that the chances of altcoins gaining upward momentum are low. At press time, BTC’s dominance
stood at 54%, as per CoinStats.Additionally, AMBCrypto’s assessment of the Altcoin Season Index revealed that the indicator had a reading of 20. Generally, a value under 25 hints at a Bitcoin season.
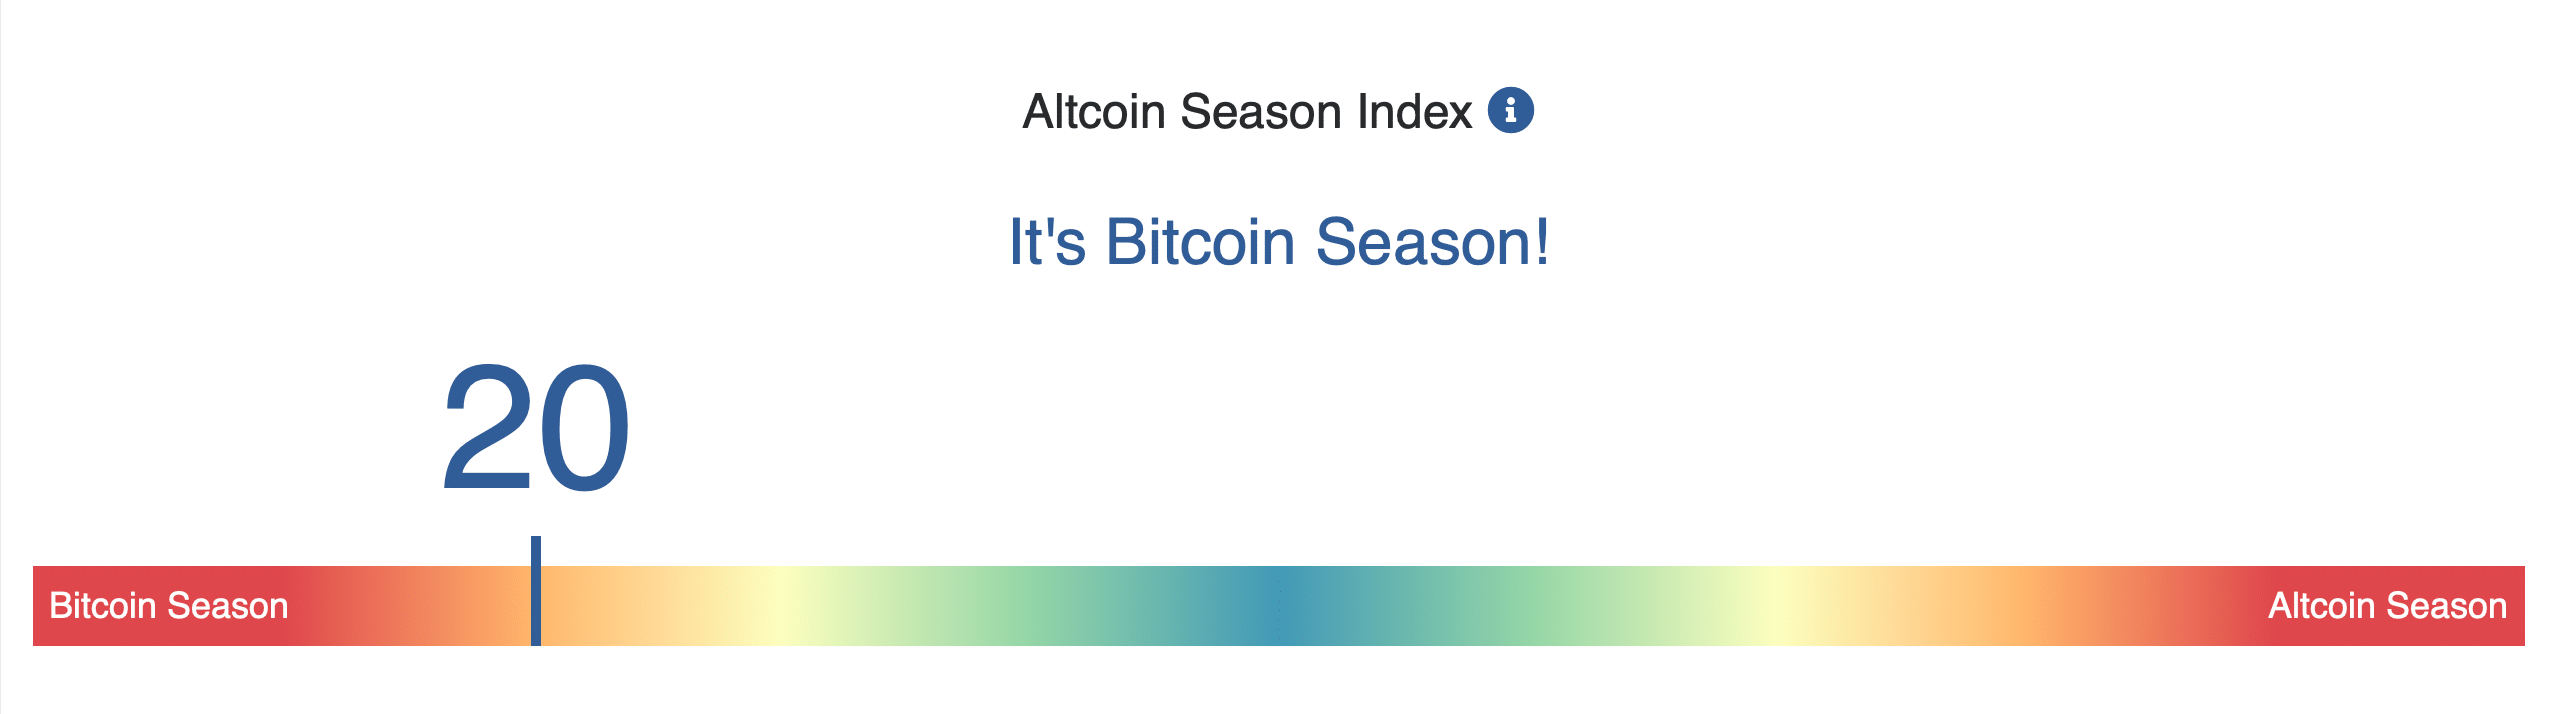
Source: Blockchain Center
However, the situation might change soon. CryptoBullet, a popular crypto analyst, recently shared a tweet highlighting a bullish and bearish divergence on BTC’s dominance chart. As per the same, while BTC’s dominance increased, a bearish divergence appeared on the Relative Strength Index (RSI) chart.
This might indicate a possible dip in the cryptocurrency’s dominance going forward.
Interestingly, the opposite happened in late 2021, with the same resulting in a hike in BTC dominance in subsequent months. If the bearish divergence pattern is tested, then investors might soon seen altcoins flourish across the board.
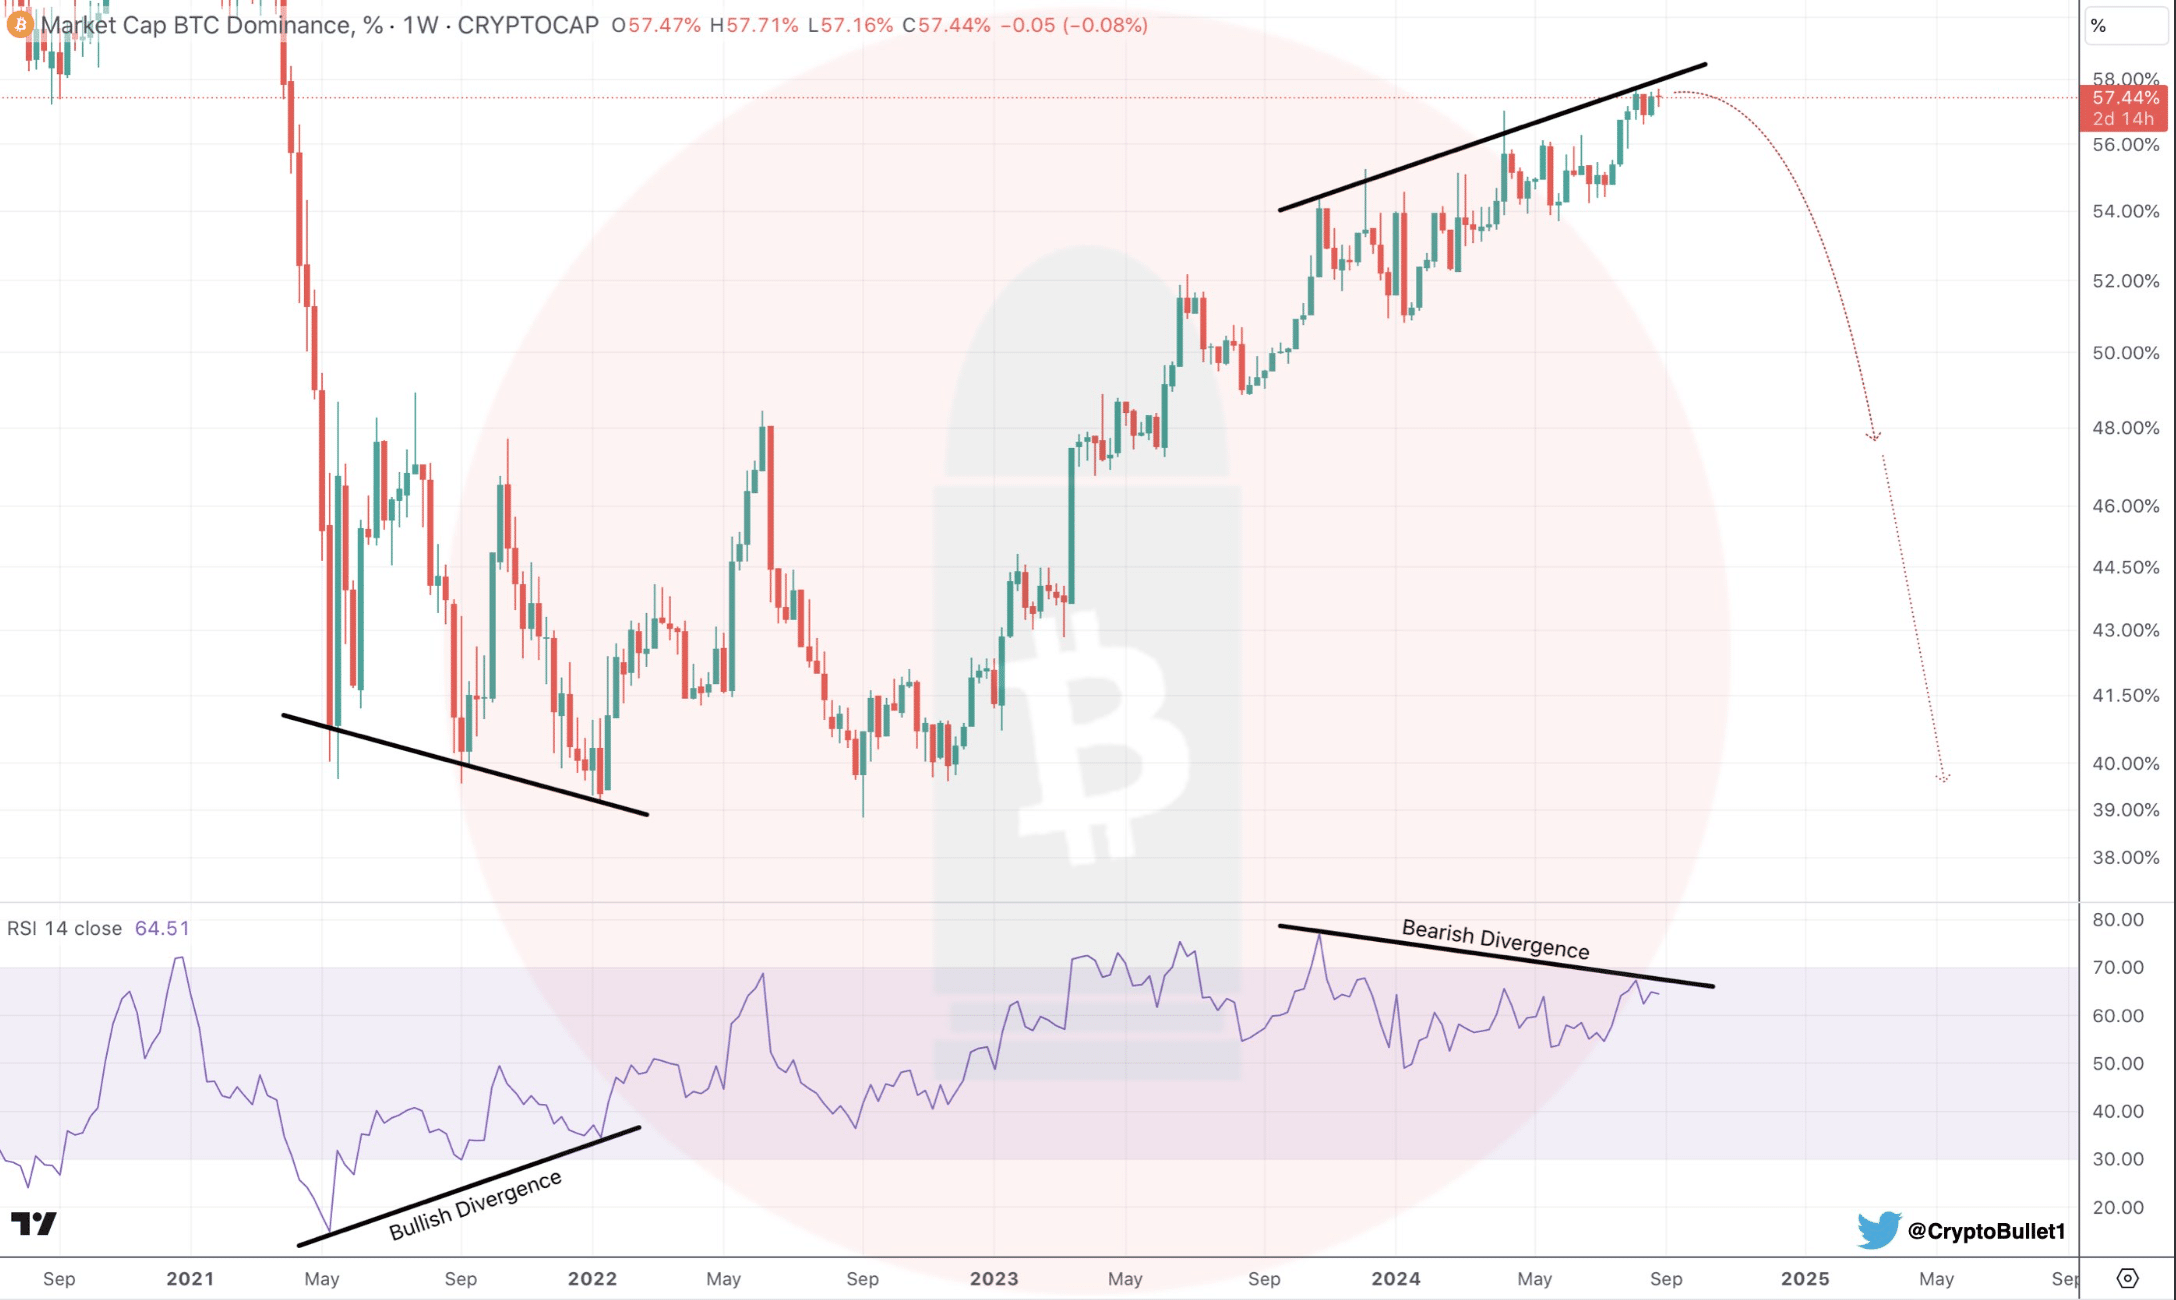
Source: X
Will Solana benefit from this?
Since a drop in BTC dominance might result in an altcoin rally, AMBCrypto planned to check Solana’s state to see whether it showed any signs of a bull rally. According to
CoinMarketCap, SOL’s value dropped by over 10% in the last seven days.At press time, it was trading at $138.57 with a market capitalization of over $64 billion.
The bad news was that SOL’s trading volume spiked while its price dropped, which legitimized the downtrend. The token’s weighted sentiment also plummeted sharply, meaning that bearish sentiment around SOL was dominant.
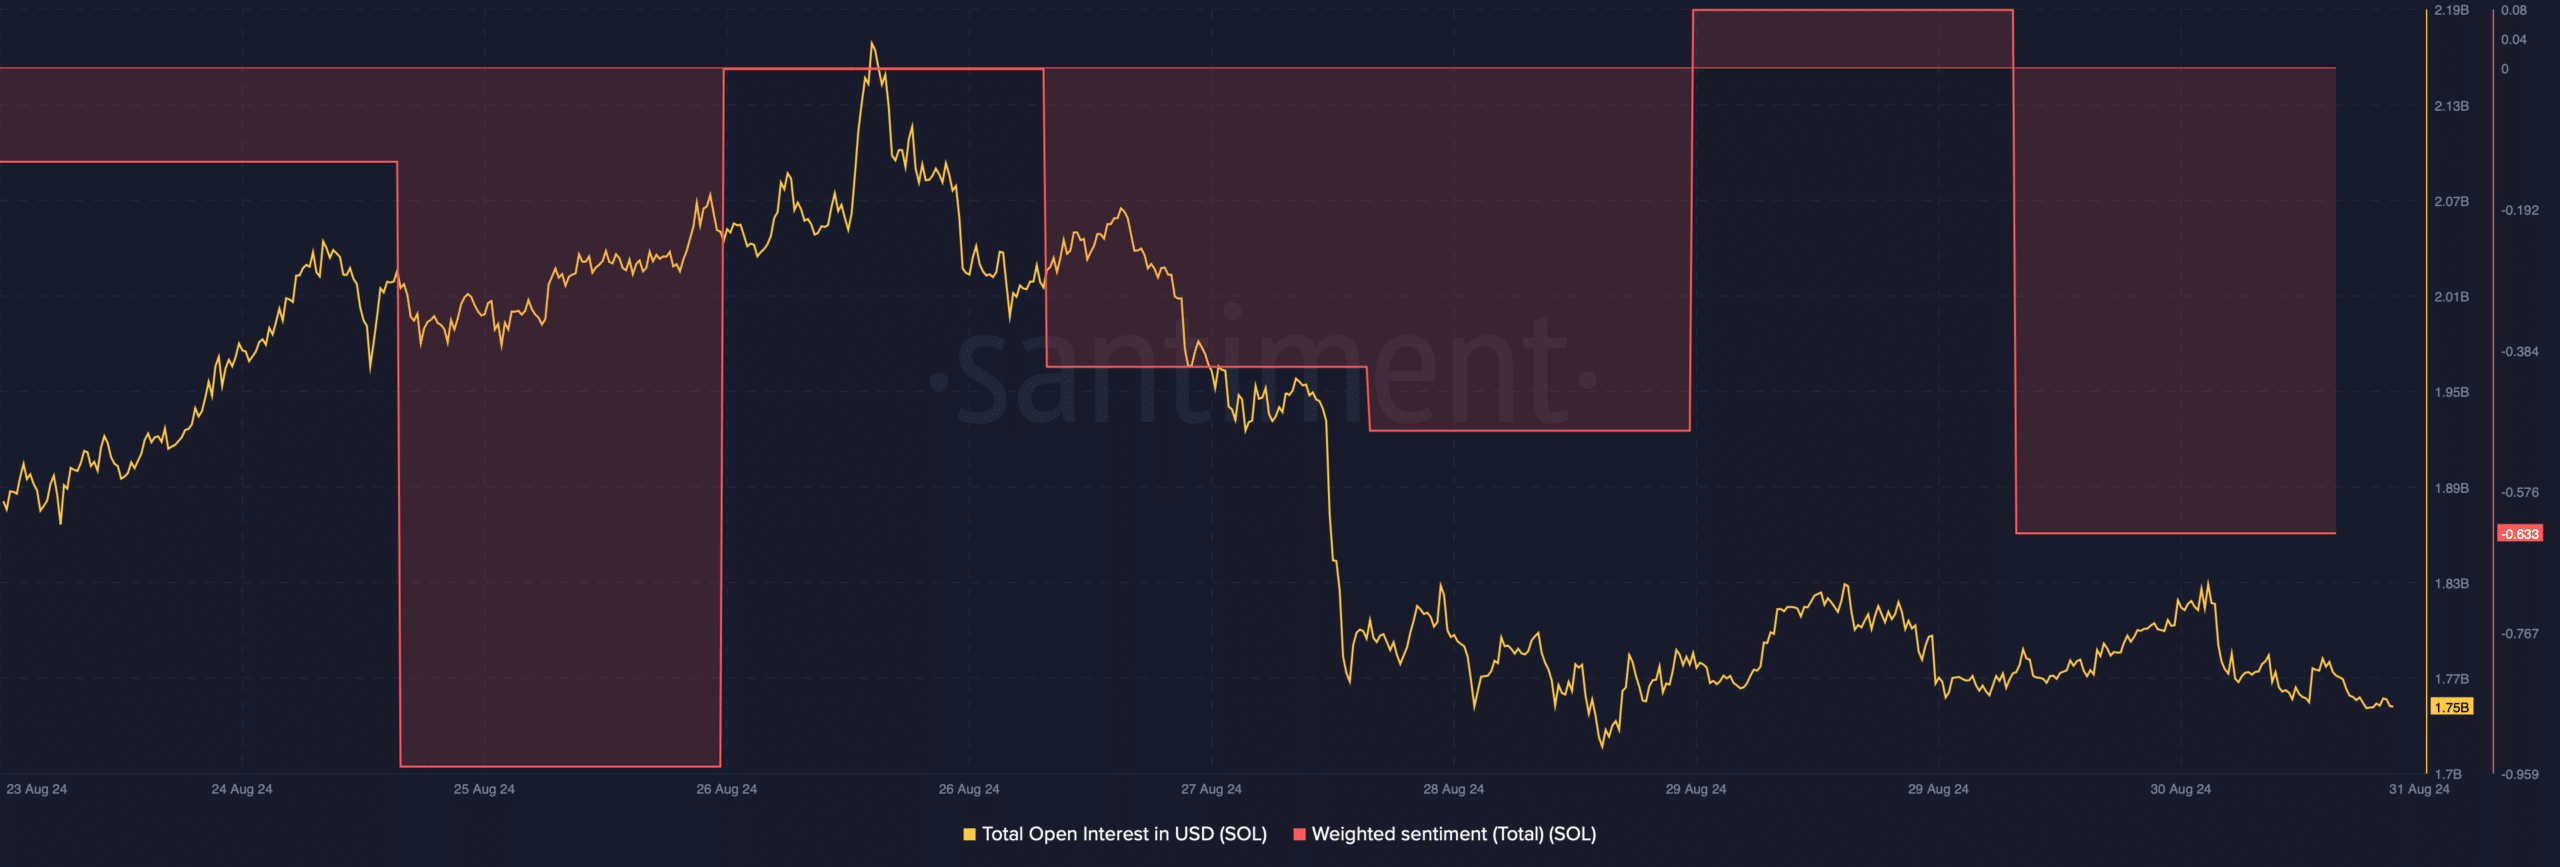
Source: Santiment
Nonetheless, SOL’s Open Interest dipped. Usually, a drop in this metric indicates that there are chances of the ongoing price trend changing. Therefore, AMBCrypto checked SOL’s daily chart to find out what the technical indicators suggested.
The Money Flow Index (MFI) registered a downtick, hinting at a sustained price drop. If that happens, then investors might seen SOL dropping to $127.
Is your portfolio green? Check out the SOL Profit Calculator
On the contrary, the Chaikin Money Flow (CMF) went north. Additionally, if BTC dominance falls, then SOL might as well turn bullish. In the event of a bullish takeover, SOL might target $163 before it begins its journey towards $187.
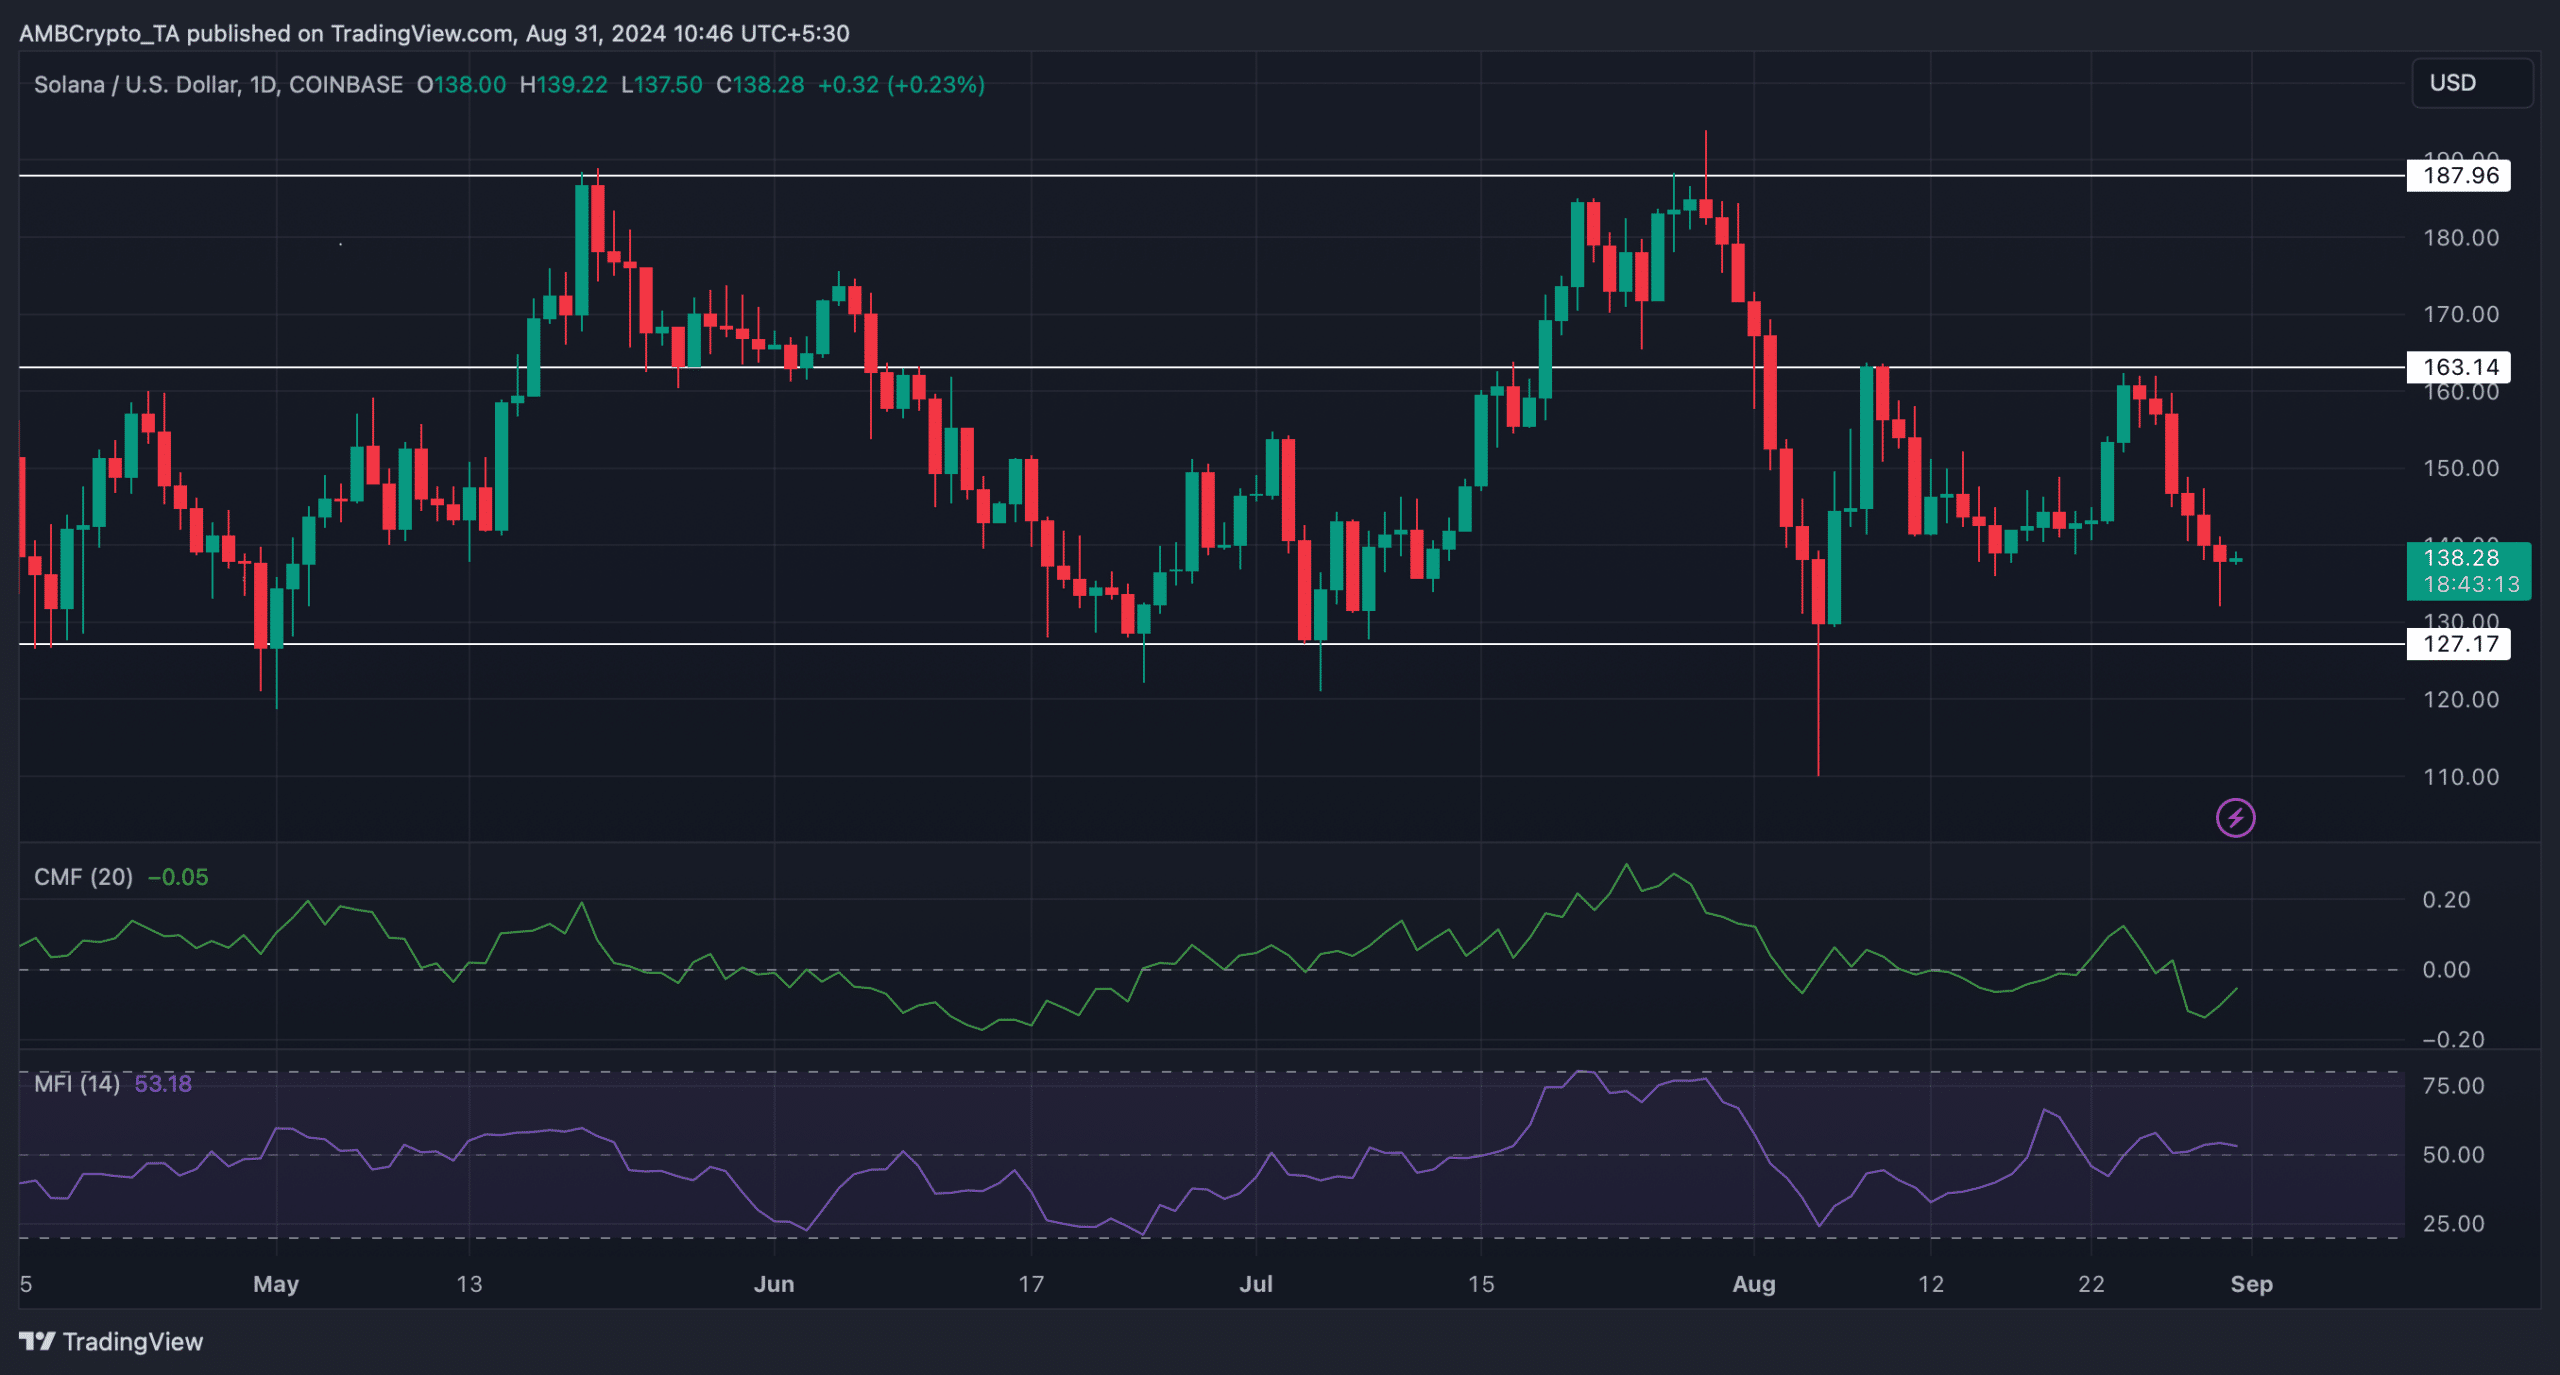
Source: TradingView