Bitcoin’s major sell-off might be ending: Will BTC recover now?

- Bitcoin presented a buying opportunity, but the downtrend was not yet over.
- The sell-off might be at an end, and BTC token transfer volumes resembled their 2023 levels.
Bitcoin [BTC] has shed nearly 5% since Friday, dragging the Fear and Greed Index lower. The short-term holders were facing losses, while longer-term holders preferred to accumulate.
This might not spark an immediate recovery, but a recovery could be brewing.
The stablecoin ratio channel signaled a buying opportunity for BTC and altcoins. The increase in stablecoin supply indicates increased liquidity and tends to occur during bearish market phases.
Markets are cyclical, and the market will swing bullishly — the question is when.

Source: CryptoQuant
The Coinbase Premium Index tracks the price difference between Coinbase and Binance. A positive premium implies greater demand from U.S.-based investors.
This has not been the case over most of the past three months, a sign of fear from U.S. investors.
The CB Premium Index is near neutral levels right now. Its movement would depend on the BTC price movement, which was bearishly biased in the lower timeframes at press time.

Source: Axel on X
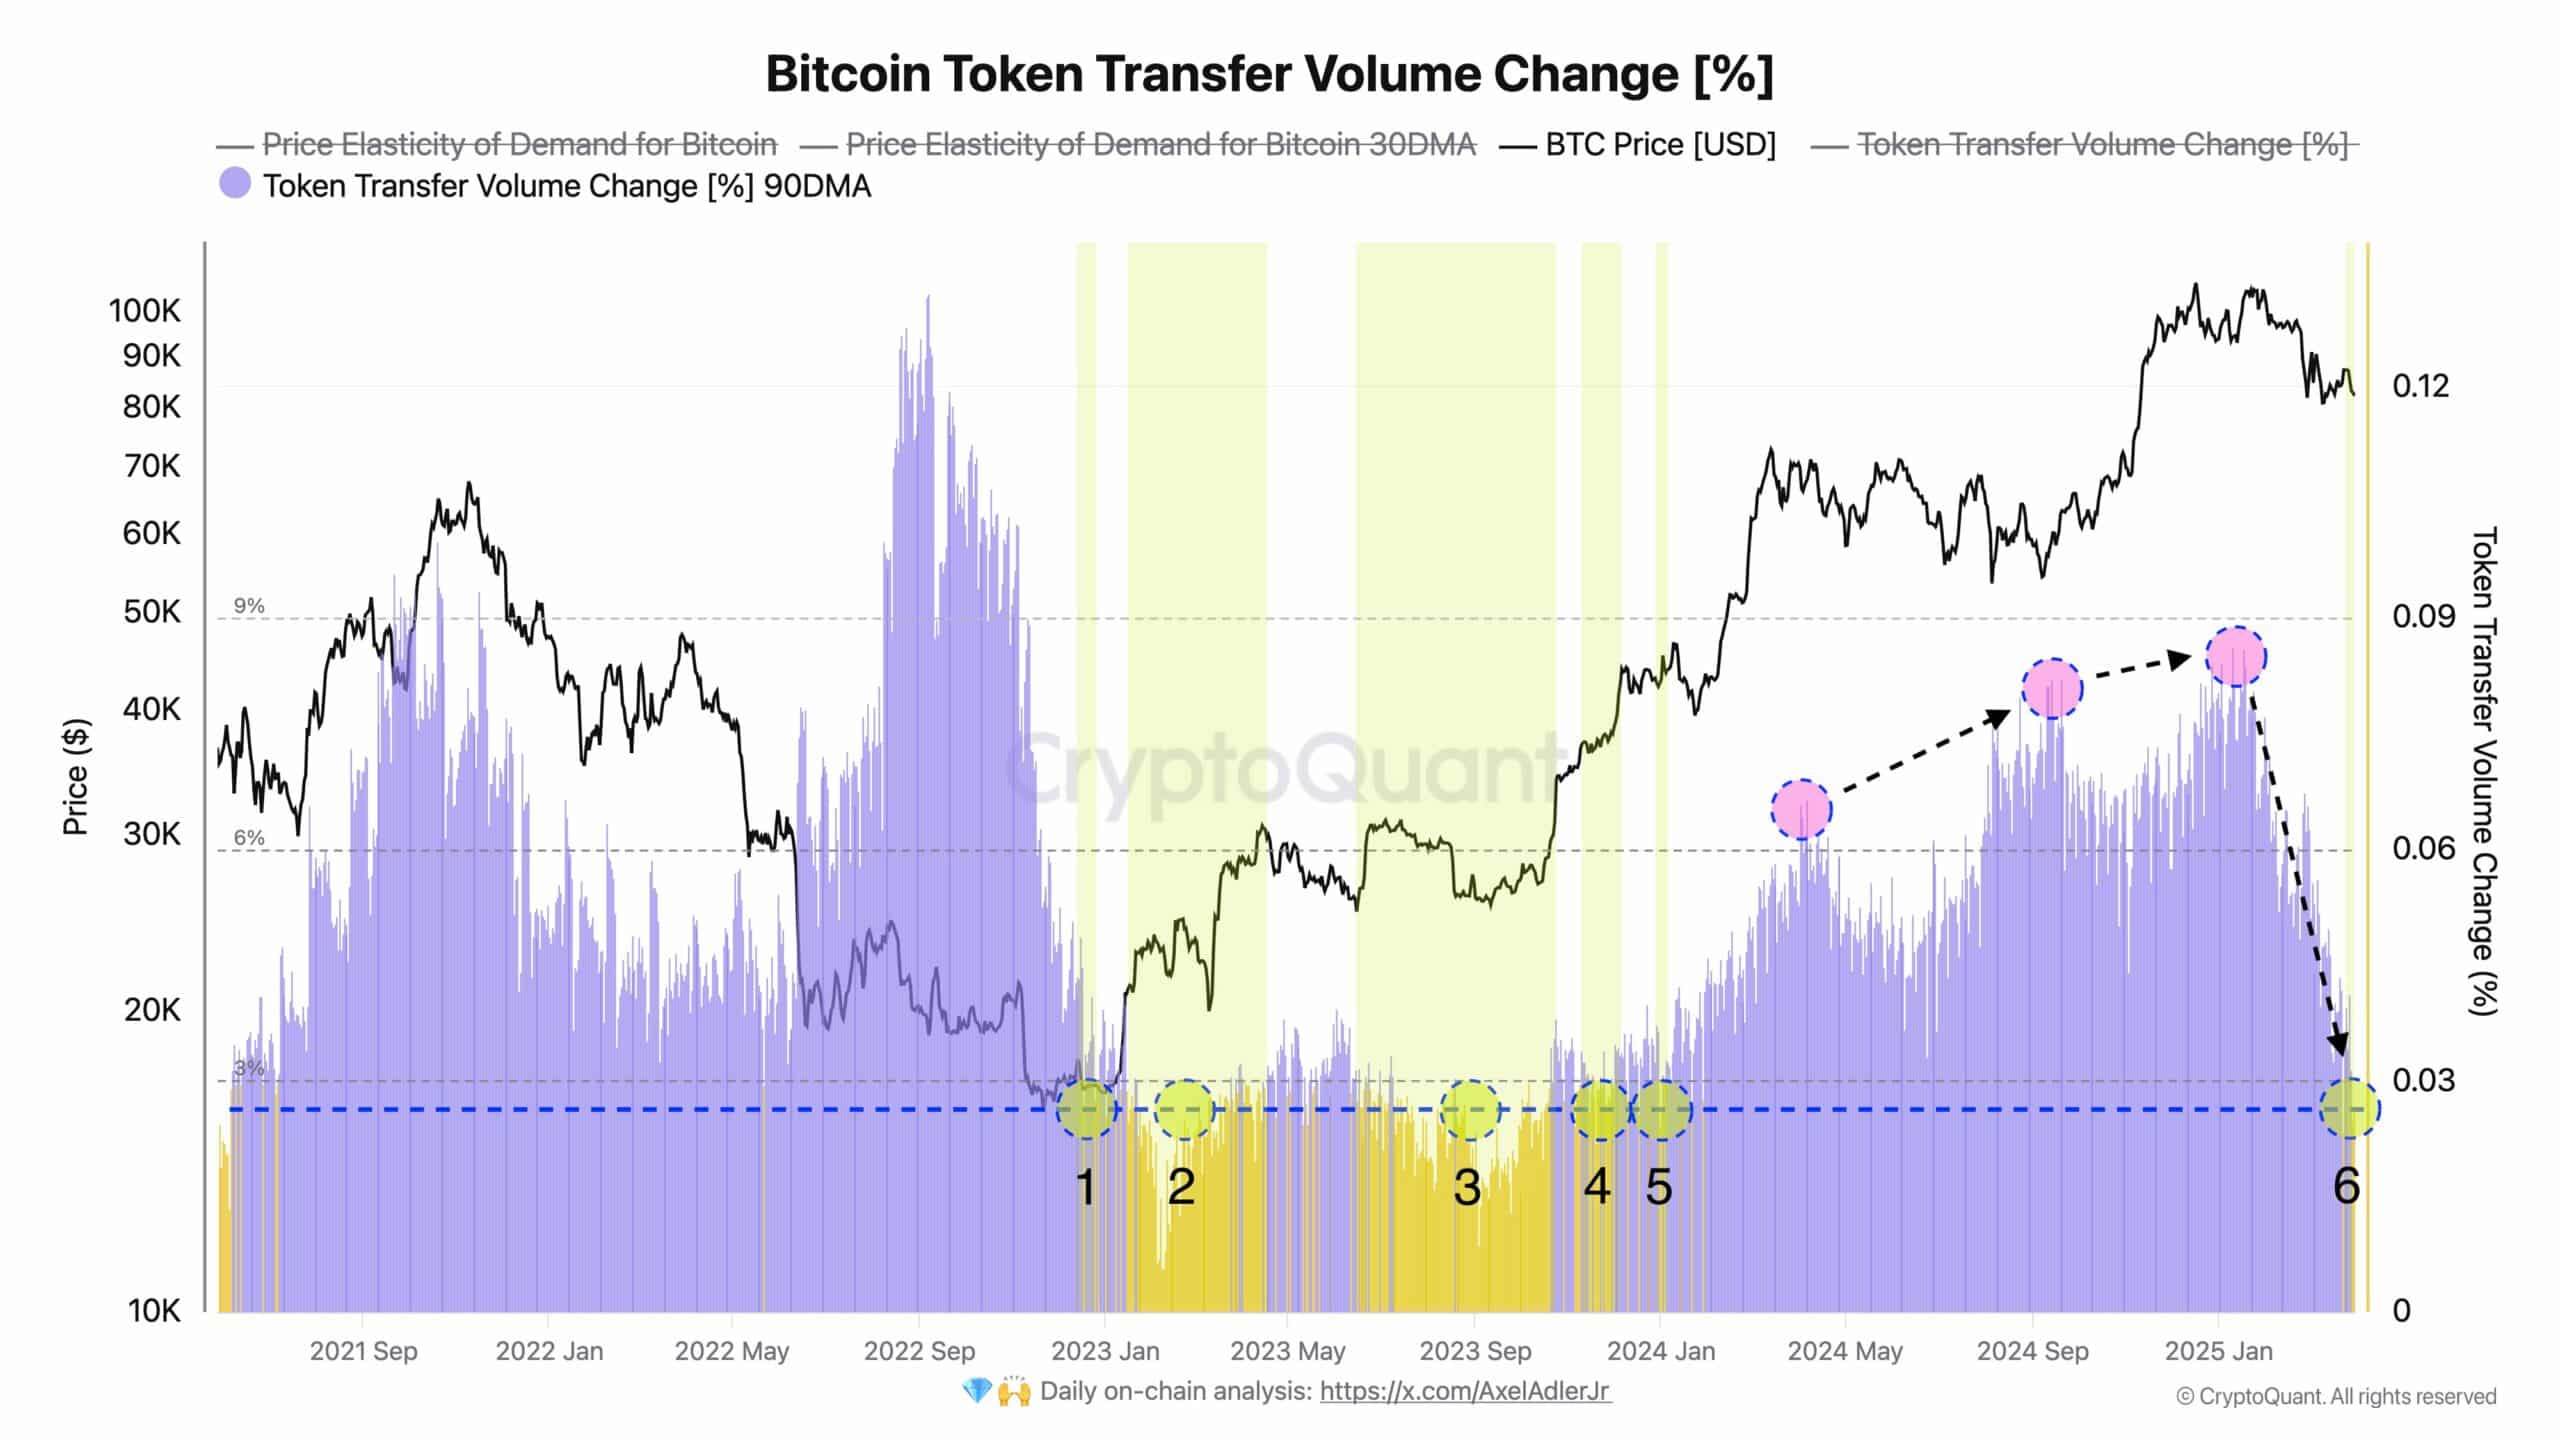
However, the selling pressure might be at an end. Crypto analyst Axel Adler Jr observed in a post on X that the 90-day moving average of the Bitcoin token transfer volume change (%) was falling.
It was currently near the lows from 2023, which corresponded to a period of BTC accumulation.
The indicator shows the average change in transaction volume over the last 90 days compared to the previous day.
Its recent retreat meant that major sell-offs were over, and Bitcoin might begin to trend higher on the price chart.

Source: CryptoQuant
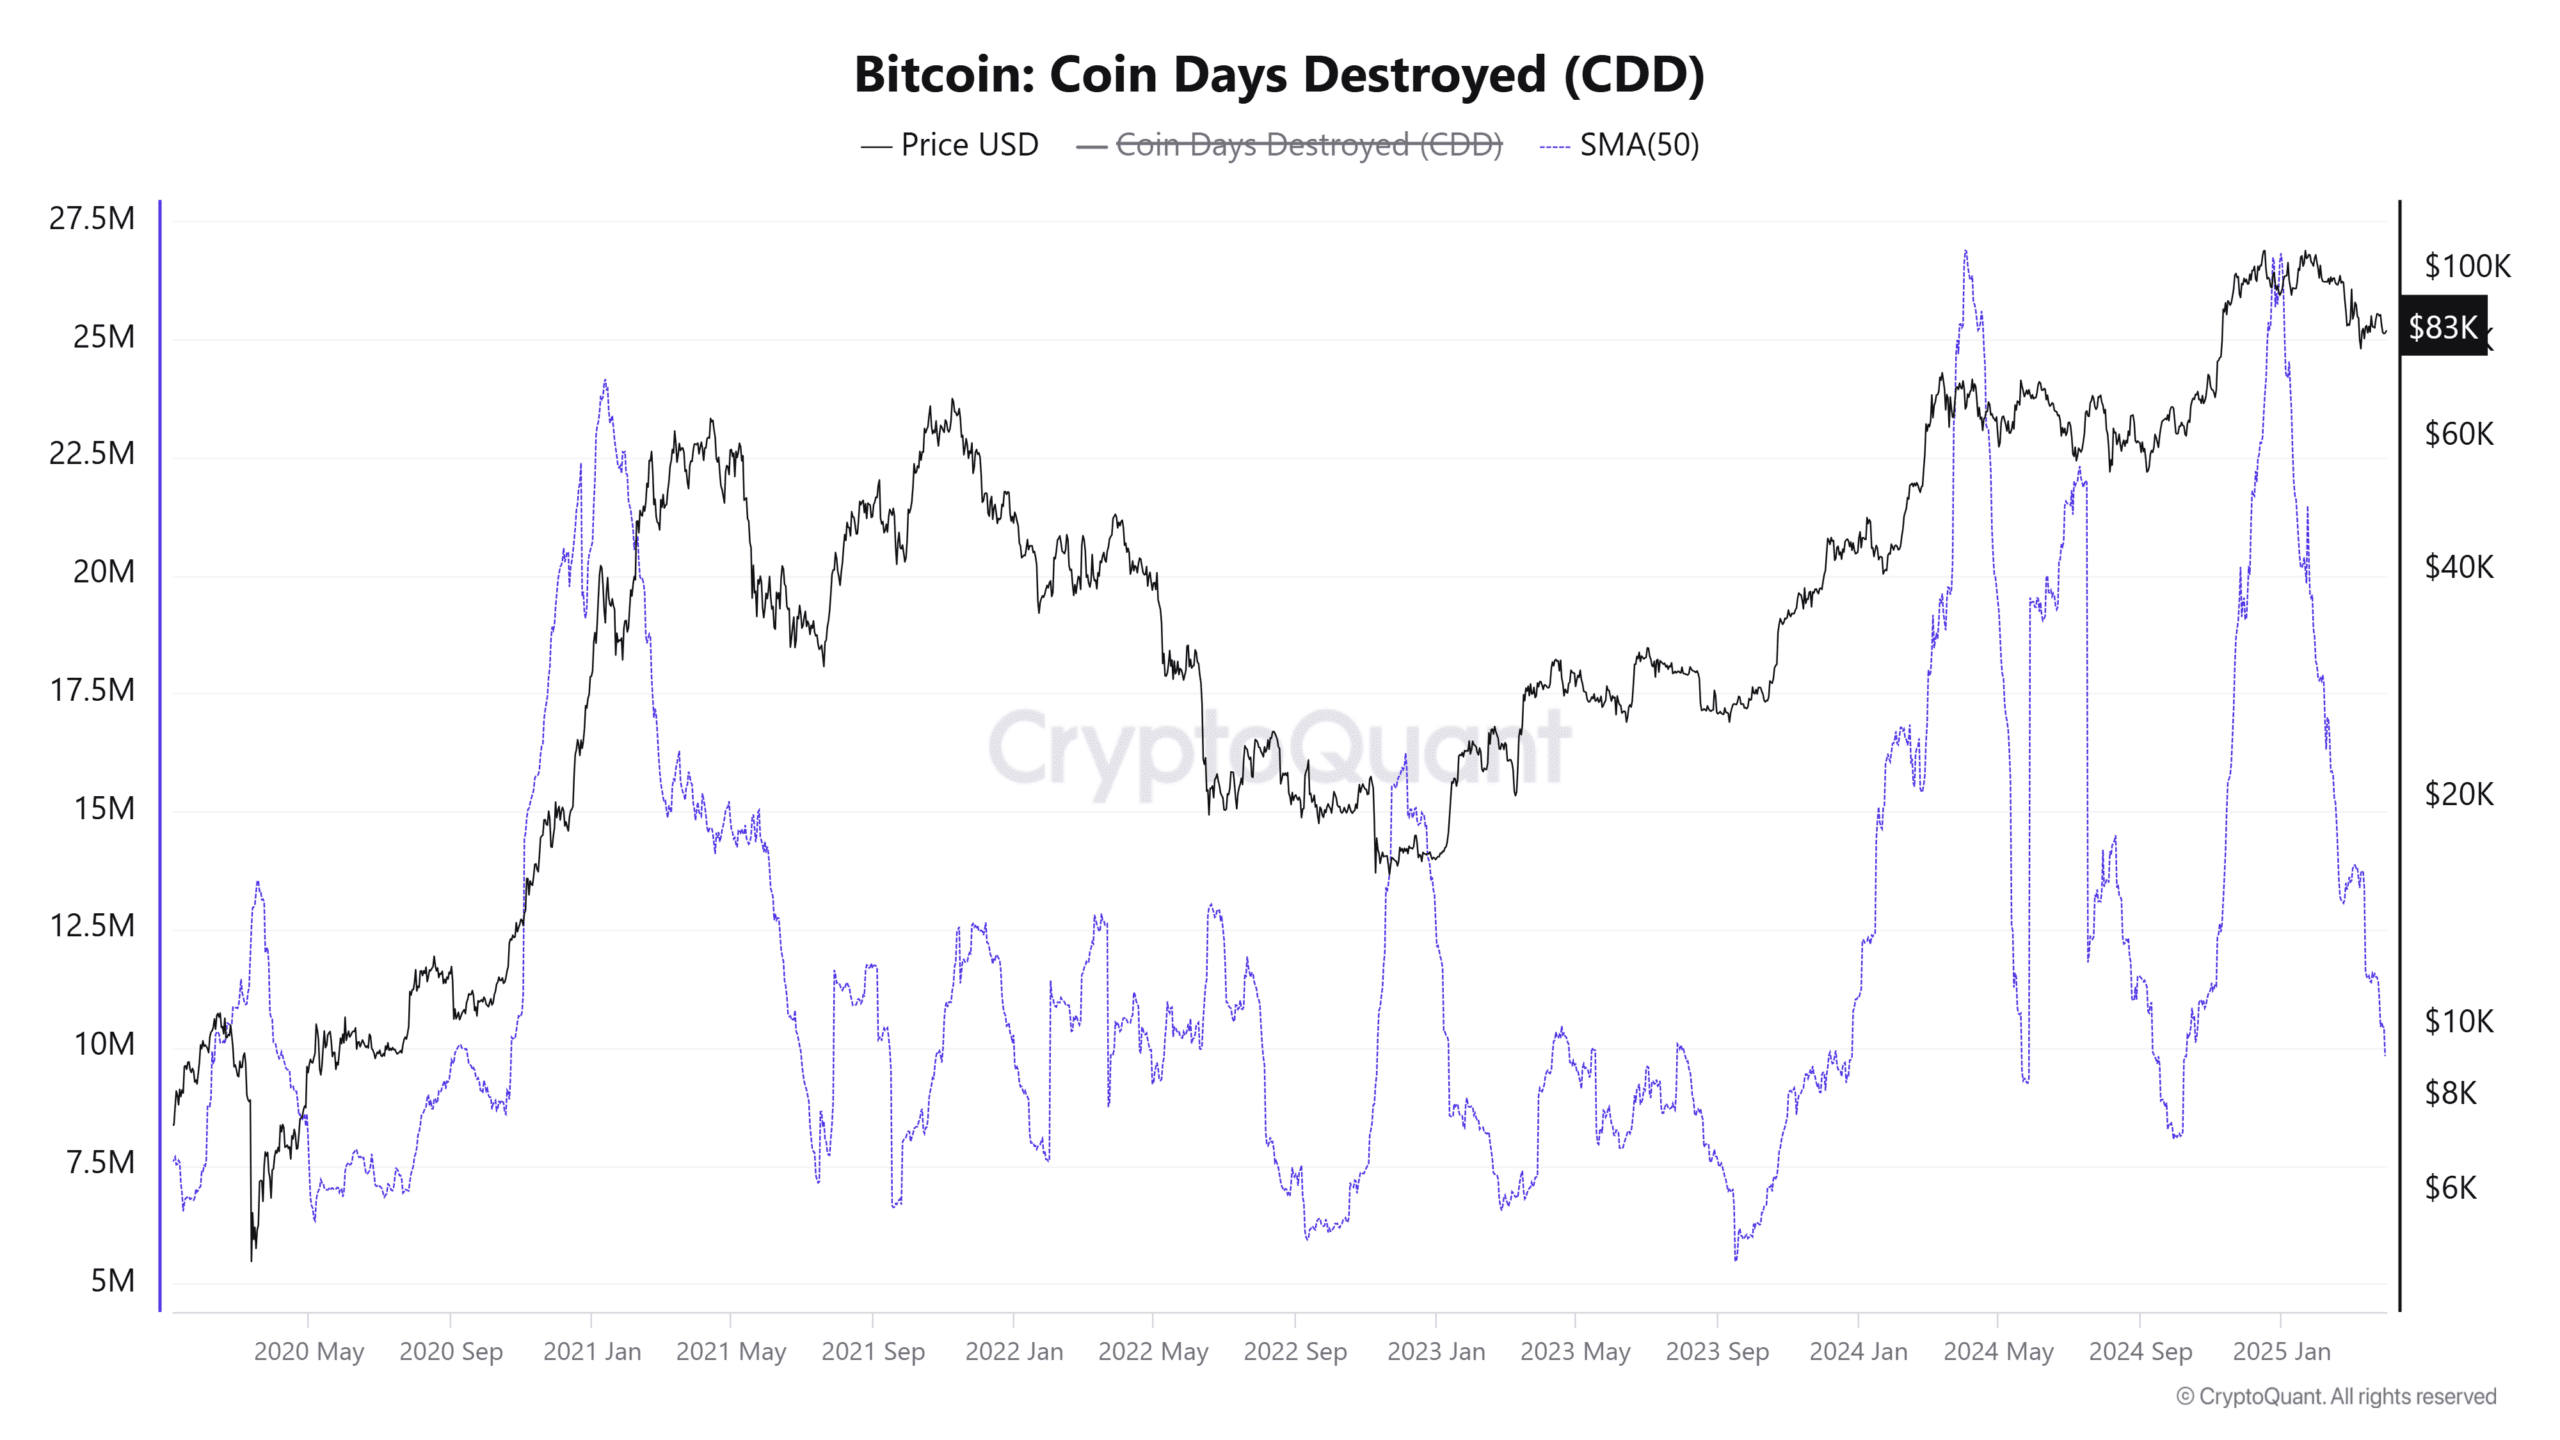
The BTC coin days destroyed (CDD) tracks the long-term holder activity.
When a coin is spent, the number of days the coin was held is multiplied by the number of coins moved to arrive at CDD. High CDDs indicate long-term holders selling, and can mark major trend shifts.
Over the past three months, the 50DMA of the BTC CDD metric has been falling. This signaled reduced selling pressure from long-term holders.
Putting the clues together, it appeared likely that Bitcoin was nearing the end of the downtrend.
However, it does not signal an immediate trend reversal, and traders and investors must be cautious of being too eager to catch the price bottom.


