
- Bitcoin’s long-term holders [LTH] continue to realize profits, but momentum is slowing down
- Short-term holders [STH] dominate loss realization, indicating weaker near-term demand
A shifting balance in Bitcoin’s [BTC] on-chain dynamics revealed that short-term holders are now shouldering nearly all of the realized losses – A trend that could signal a broader market reset.
Meanwhile, long-term holders remain profitable. Even though their selling momentum has been tapering lately.
Short-term holders dominate Bitcoin realized losses
According to Glassnode, over 80% of realized value in the Bitcoin market can be currently attributed to short-term holders [STHs] who acquired their coins within the last 155 days.
In fact, the chart highlighted a sharp surge in realized losses among STHs, coinciding with Bitcoin’s pullback from above $100k to its press time level around $83.7k.
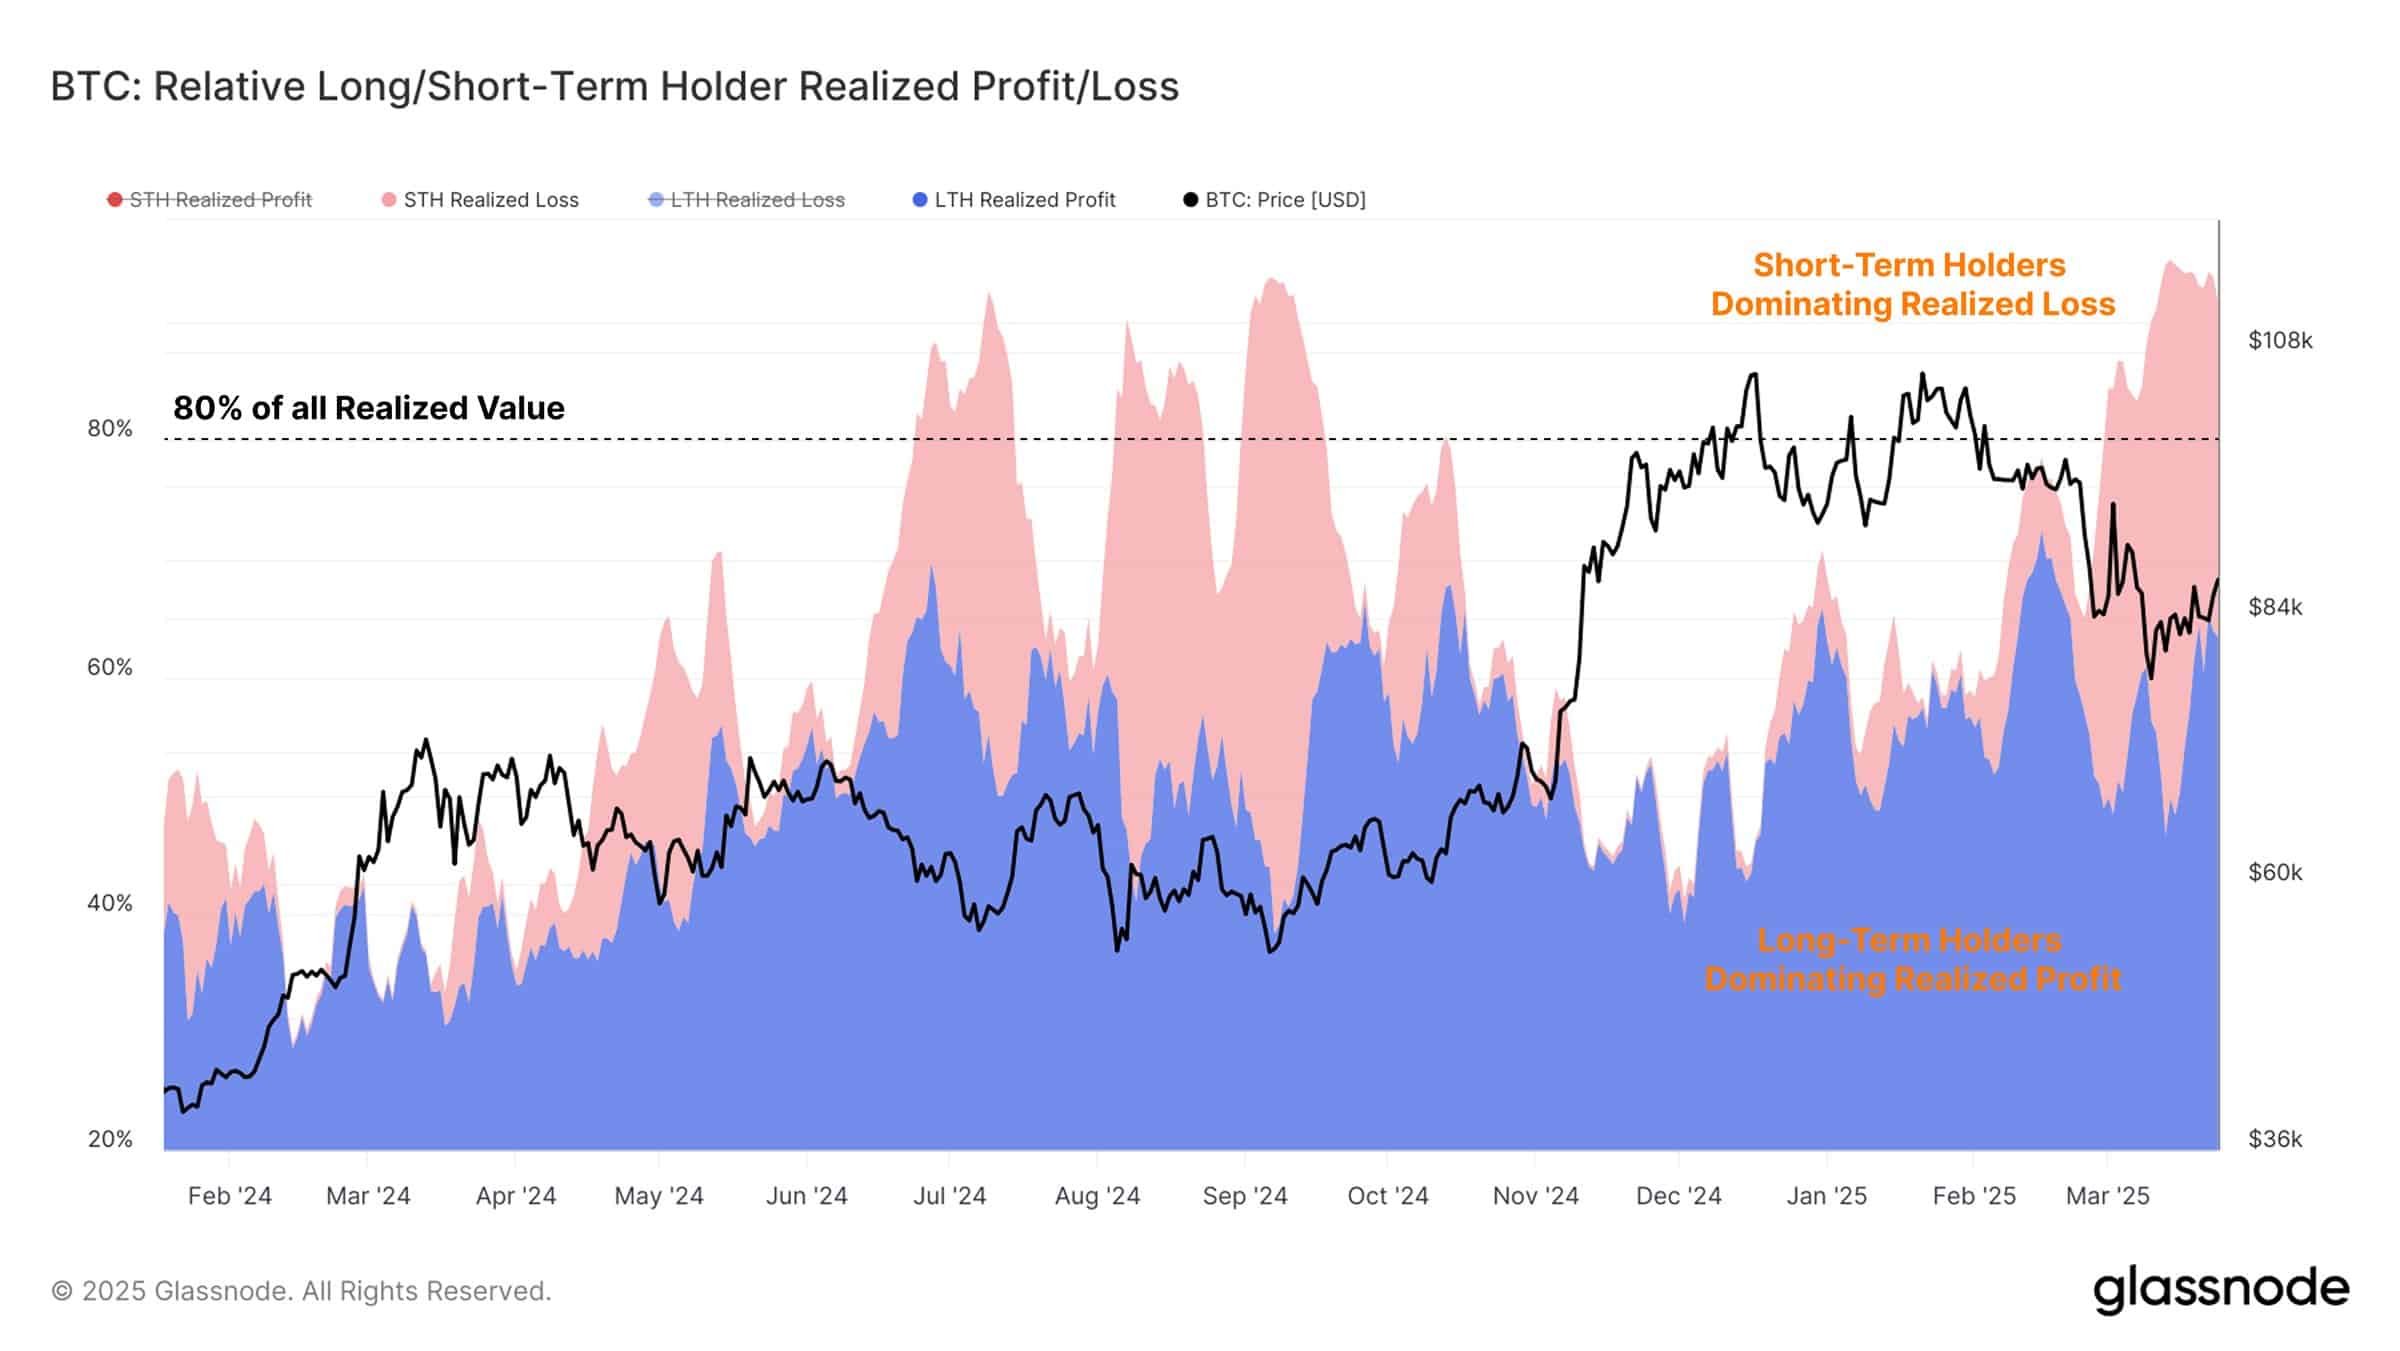
Source: Glassnode
This capitulation behavior suggested that recent buyers, who entered during Bitcoin’s parabolic rally, have been exiting at a loss amid heightened volatility.
The realized profit/loss imbalance hinted at a strong emotional reaction from newer participants and waning confidence in the crypto’s immediate upside.
Long-term holders still in profit, but slowing
Despite Bitcoin STHs absorbing a bulk of the losses, long-term holders [LTHs] remain a consistent source of profit realization. However, the trend has been weakening lately.
In fact, the net difference between long-term profits and short-term losses has been narrowing too, as shown in the second chart.
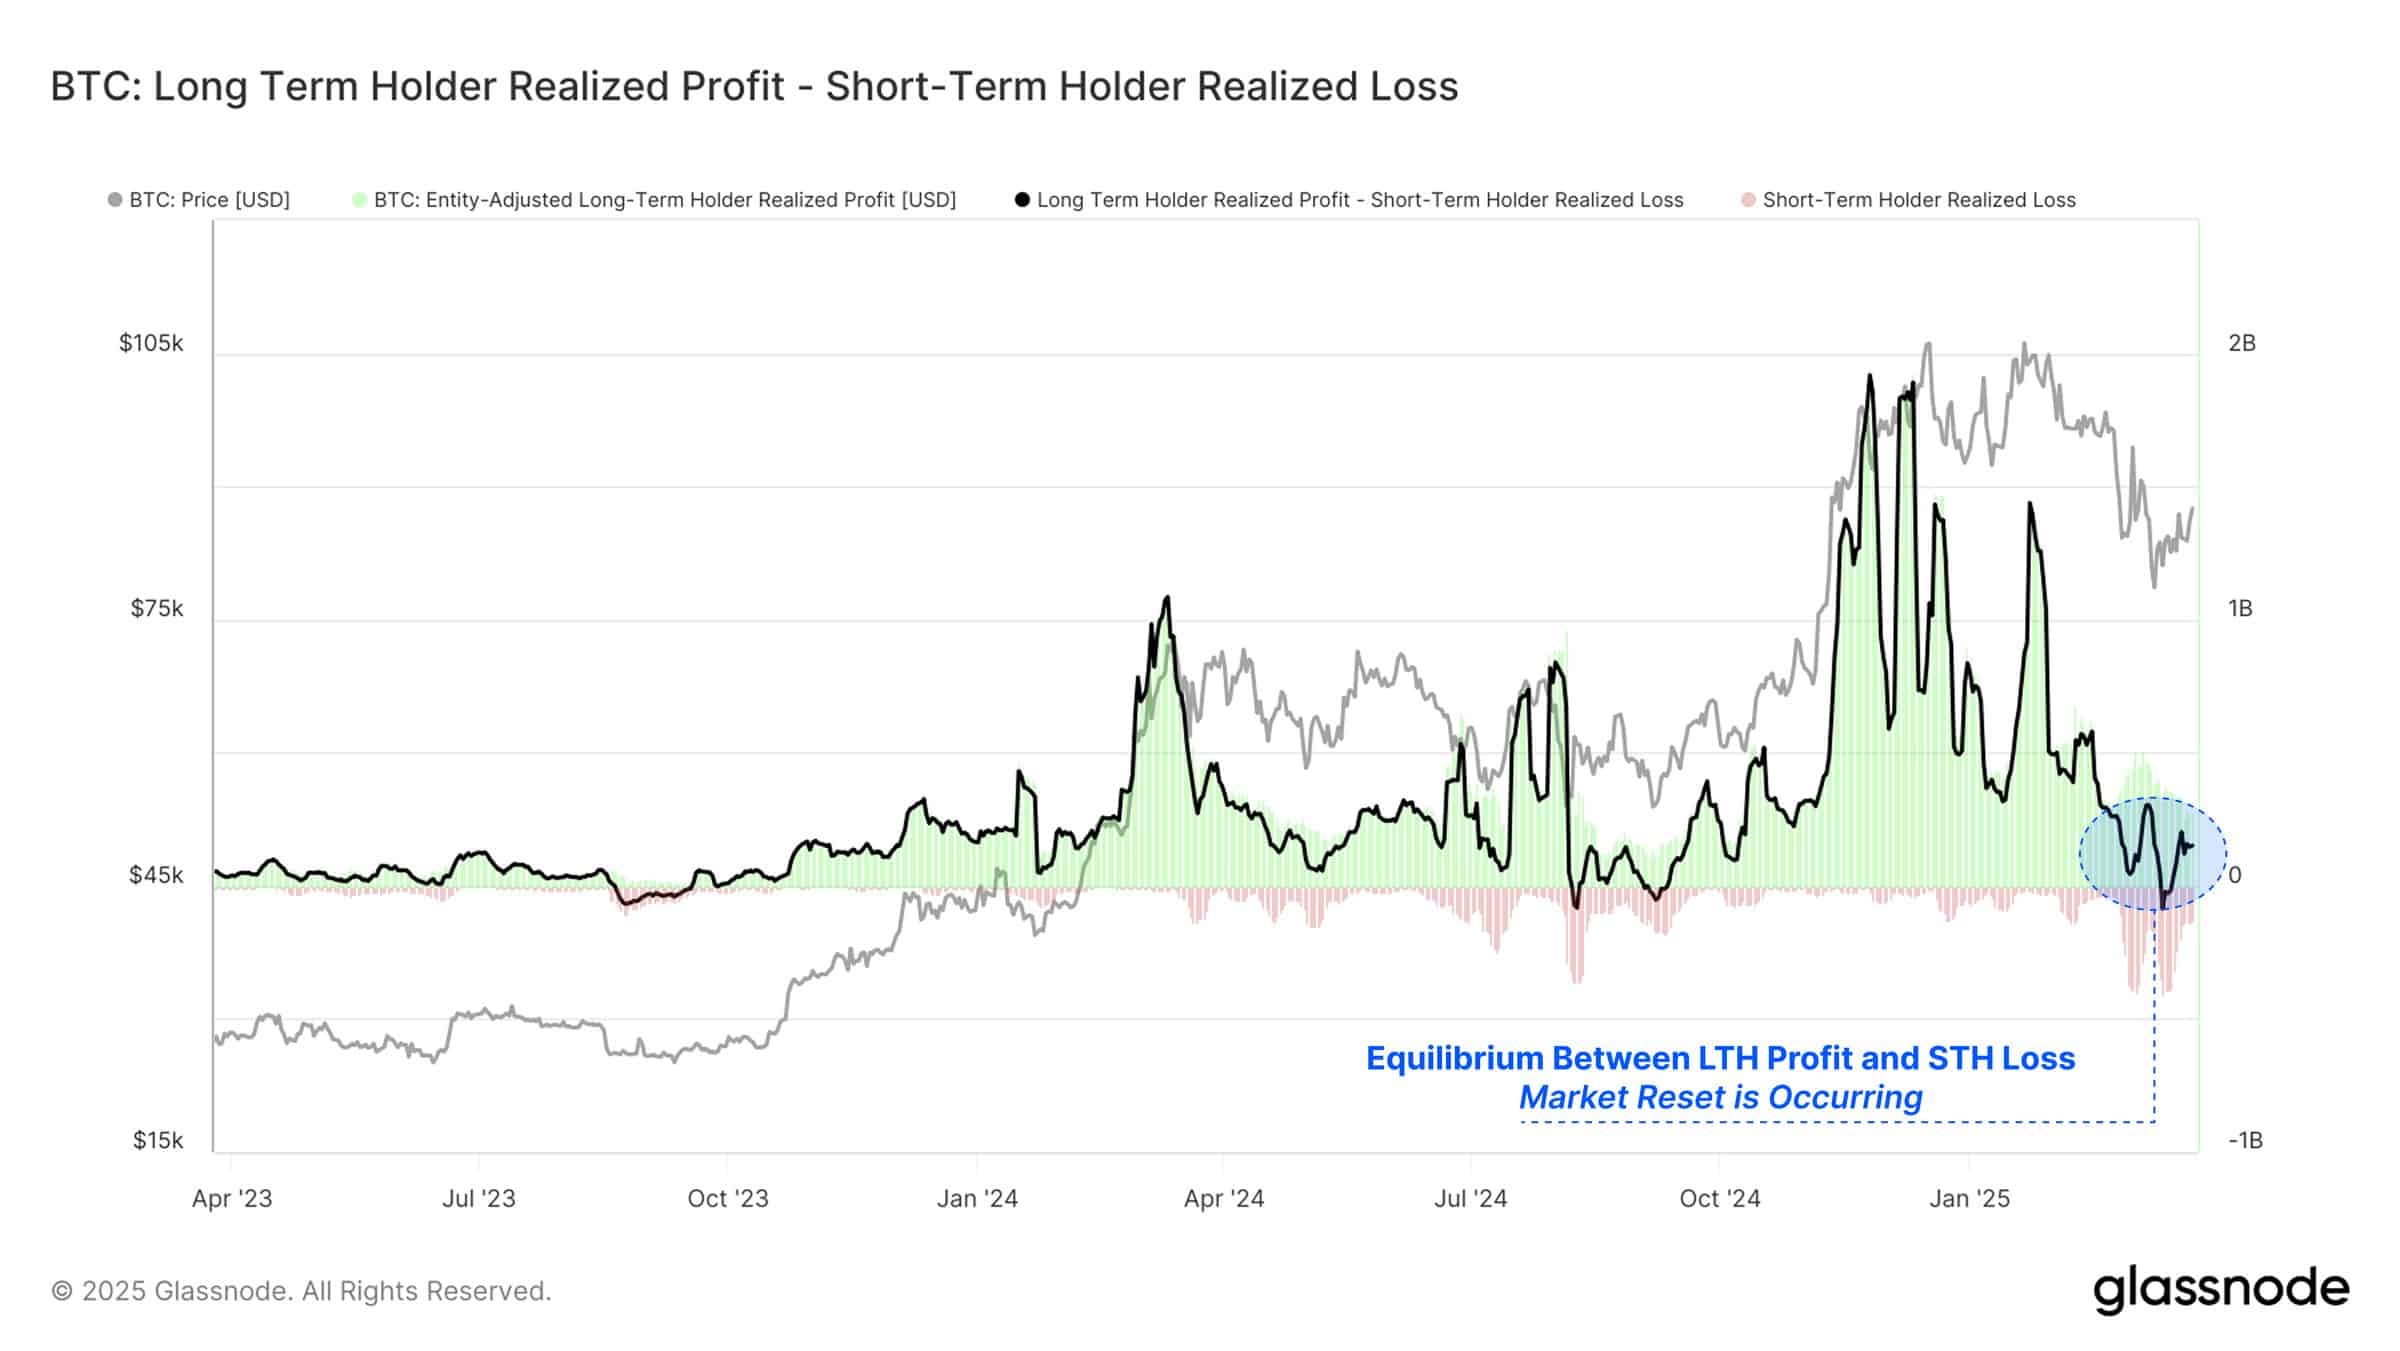
Source: Glassnode
This “profit-loss equilibrium” reflects a neutral zone where inflows cool, market demand slows down, and price momentum stalls.
Historically, such conditions have preceded consolidation phases or minor corrections on the charts.
Price action reflects sentiment shift in Bitcoin
On the 12-hour chart, Bitcoin slipped below the 50-day MA of $85,064, trading at $83,794 at press time.
The technical breach and weakening volume supported the on-chain story of waning bullish strength across the board.
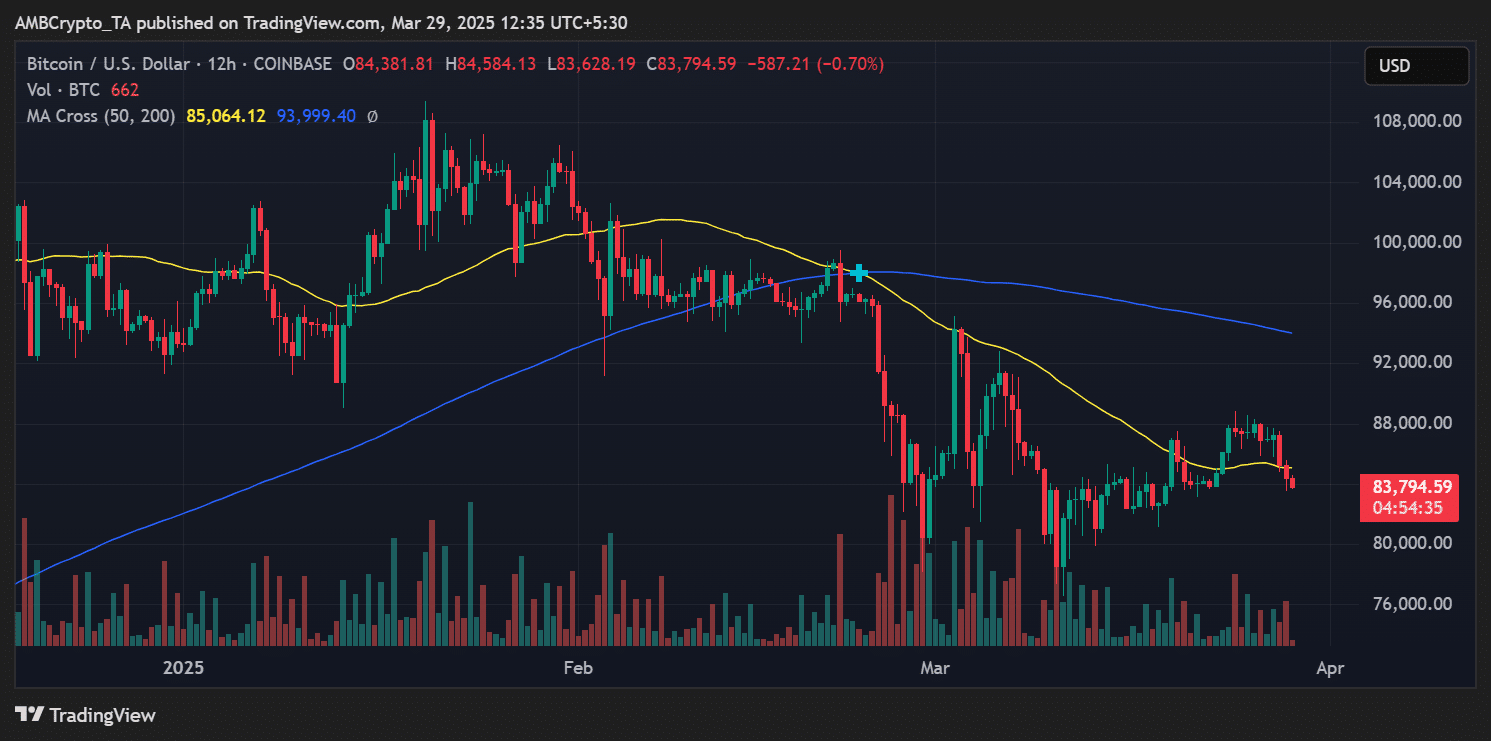
Source: TradingView
If the market continues to digest earlier gains with declining capital inflows, BTC may revisit the $80k support zone. However, if LTH profit-taking remains steady without sparking excessive selling, Bitcoin could stabilize before attempting a fresh move higher.
Conclusion
The prevailing dominance of short-term losses and the declining intensity of long-term profit-taking are signs of a transitional market phase for Bitcoin. While no sharp breakdown has occurred so far, the data alluded to a cooling cycle.
Hence, the market participants should exhibit some degree of caution and patience right now.