Bitcoin’s MVRV flashes red: Is a BTC correction on the horizon?

- BTC spot inflow/outflow data reveals that exchanges have seen a significant outflow of $860.52 million.
- BTC’s recent price action indicates that it could rise by 3% to reach the $99,588 level.
Bitcoin [BTC], the world’s biggest cryptocurrency by market capitalization, appears to be in a danger zone as reported by a crucial on-chain metric.
At press time, the overall market seems to be recovering after experiencing a modest price decline following South Korean president’s declaration of martial law.
Bitcoin MVRV metric sends a warning
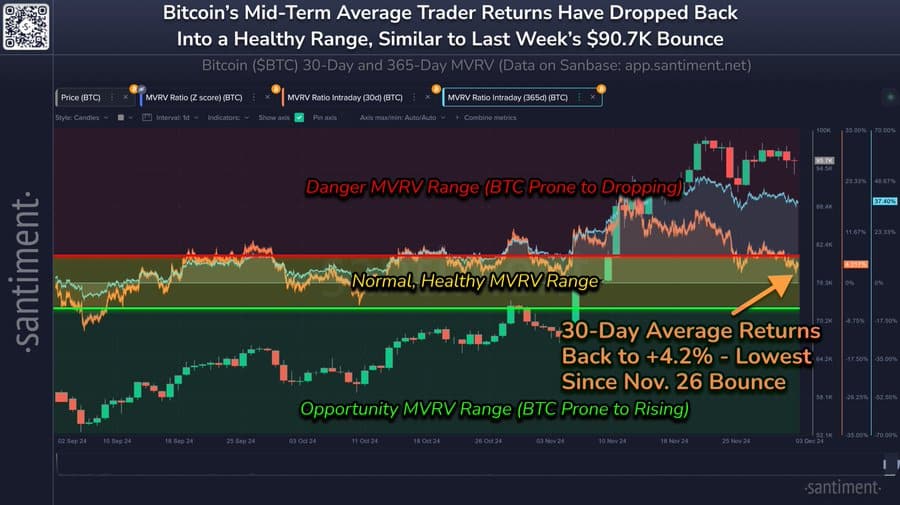
According to the on-chain analytics firm Santiment, the average returns of Bitcoin wallets active in the past 30 days have entered a danger zone.
This danger zone occurs when BTC’s MVRV approaches or exceeds +5%. As of this writing, the metric stands at +4.2%, indicating that the price is nearing a correction.
MVRV is a crucial on-chain metric that traders and investors use when building positions. If the MVRV is near +5%, it indicates a potential price correction.
Conversely, if the MVRV is close to -5%, it suggests a potential buying opportunity and signals that a price bounce may be imminent.
$860 million of outflow from exchanges
Despite BTC’s price being in the danger zone, whales and institutions have shown strong interest and confidence in the asset. Coinglass’s BTC spot inflow/outflow data reveals that exchanges have seen a significant outflow of $860.52 million over the past four days.
This substantial outflow suggests that whales or investors have withdrawn tokens from exchanges to their wallets, intending to hold them for the long term.
Exchange outflows also hint at a bullish sign, as they reduce the likelihood of selling pressure and attract new investors.
Bitcoin technical analysis and key level
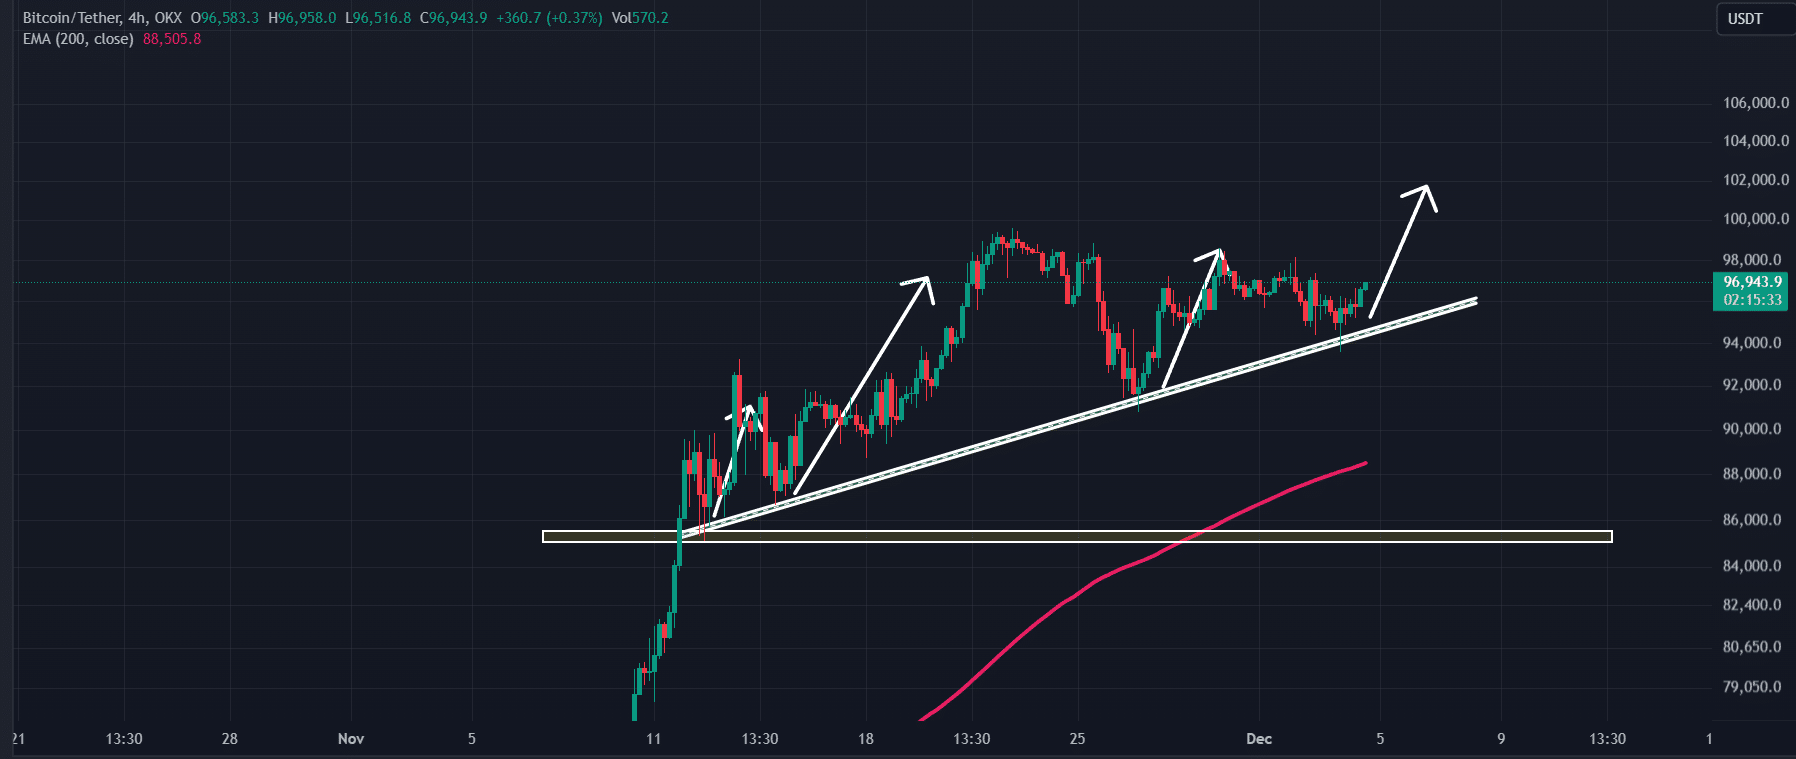
According to AMBCrypto’s technical analysis, BTC is in an uptrend. It has recently found support from an upward-sloping trendline and is now heading toward its all-time high near $100,000.
Based on recent price action, there is a strong possibility that it could rise by 3% to reach the $99,588 level in the coming days.
On the positive side, the asset’s Relative Strength Index (RSI) is at 55, which is below the overbought territory. This indicates that BTC still has enough room to rally in the coming days.
Read Bitcoin’s [BTC] Price Prediction 2024–2025
At press time, BTC was trading near $96,900 and has registered an upside momentum of 1.75% in the past 24 hours.
During the same period, its trading volume increased by 7.5%, indicating a modest rise in participation from traders and investors amid a bullish outlook.


