- Bitcoin hit its historical peak because of widespread bullish investor expectations
- Cryptocurrency began a downtrend after hitting its peak, settling below $85,000 at press time
In 2024, Bitcoin reached its historical peak because of widespread bullish investor expectations that emerged through the Bitcoin Sentiment Vote chart. In fact, Bitcoin’s price climbed above $100,000, while the Vote Up sentiment became very strong.
Once it achieved its peak, the market sentiment about its value started to decline rapidly. Market sentiment shifted to negative when traders alongside investors began voting down, resulting in lower sentiment values.
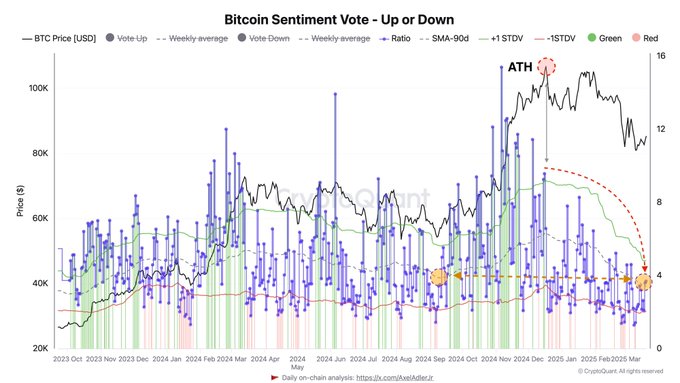
Source: CryptoQuant
The rally started by flashing positive expectations, but darkened with both fear along with traders selling to reduce their holdings after reaching its highest point. The price of BTC began a downtrend after hitting its peak, with the crypto settling below $85,000 by March 2025.
The difference in investor feeling is a sign of deepening market reluctance. Especially as sentiment stands equal to what it did during September 2024, right before the bullish period started.
Bitcoin’s sentiment levels mirror September 2024 trends
Bitcoin’s Sentiment Vote suggested that March 2025 marked the return of sentiment ratios identical to those in September 2024. The measurements throughout that period revealed neutral opinions as the ratio stayed close to 4 – Indicative of uncertain feelings.
The latest market trend demonstrated a major fall, compared to the previous all-time high levels above 12 which Bitcoin reached during its peak. These indicators highlighted a neutral-to-bearish outlook as “Vote Down” sentiment continued to rise in the 90-day moving average together with standard deviation.
The prevailing sentiment among traders matches previous market conditions before the rally, indicating that they remain hesitant about Bitcoin’s upcoming performance. The same situation as before Bitcoin’s previous major upward surge exists today as investors sense reluctance.
Long-term holders’ selling behavior and its market implications
Finally, Bitcoin’s STH/LTH Supply vs. ETF Flows vs. MicroStrategy chart highlighted sustained selling pressure from Long-Term Holders (LTH). Although the pace did slow down since Bitcoin surpassed $100,000, a 30-day LTH supply reduction of 89,738 BTC could be a sign of ongoing profit-taking.
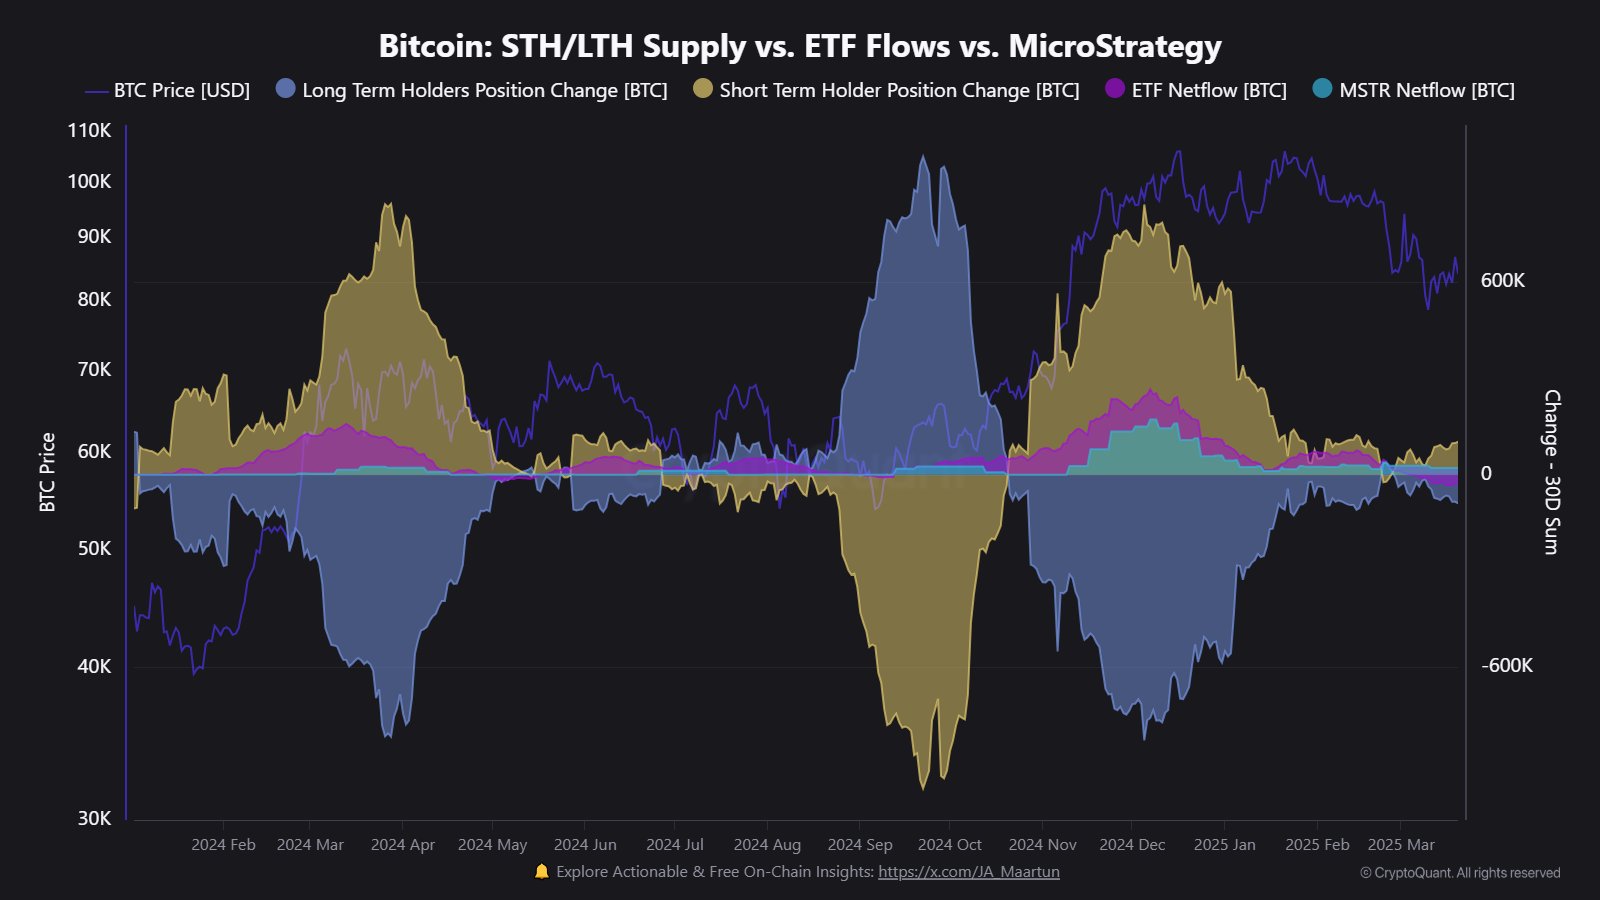
Souce: CryptoQuant
The chart’s downtrend in LTH position changes can be a sign of risk-off behavior, aligning with bearish sentiment from the first chart. The persistence of LTH selling, albeit at a reduced rate, hinted at a lack of confidence in Bitcoin’s immediate recovery.
This trend further supported the return of sentiment to September 2024 levels, reinforcing a cautious market outlook. As Bitcoin struggles to regain upward momentum, investor behavior will continue to reflect hesitation and uncertainty about its future trajectory.