Bitcoin

‘Bitcoin’s price can go parabolic and hike by 27% IF these levels…’ – Analyst
Posted:
Journalist

- One analyst believes BTC is positioned to revisit its all-time high
- Significant buying activity from large investors, other key indicators supported this trend
BTC’s recent recovery on the charts has been notable, wiping out previous losses on the charts. In fact, it’s now showing strength across all timeframes, with traders and investors seeing their portfolios turn positive following a 24-hour hike of 3.42%.
More growth could be on the horizon though, especially as further analysis seemed to highlight the potential for new ATHs.
Is $75,000 coming up next?
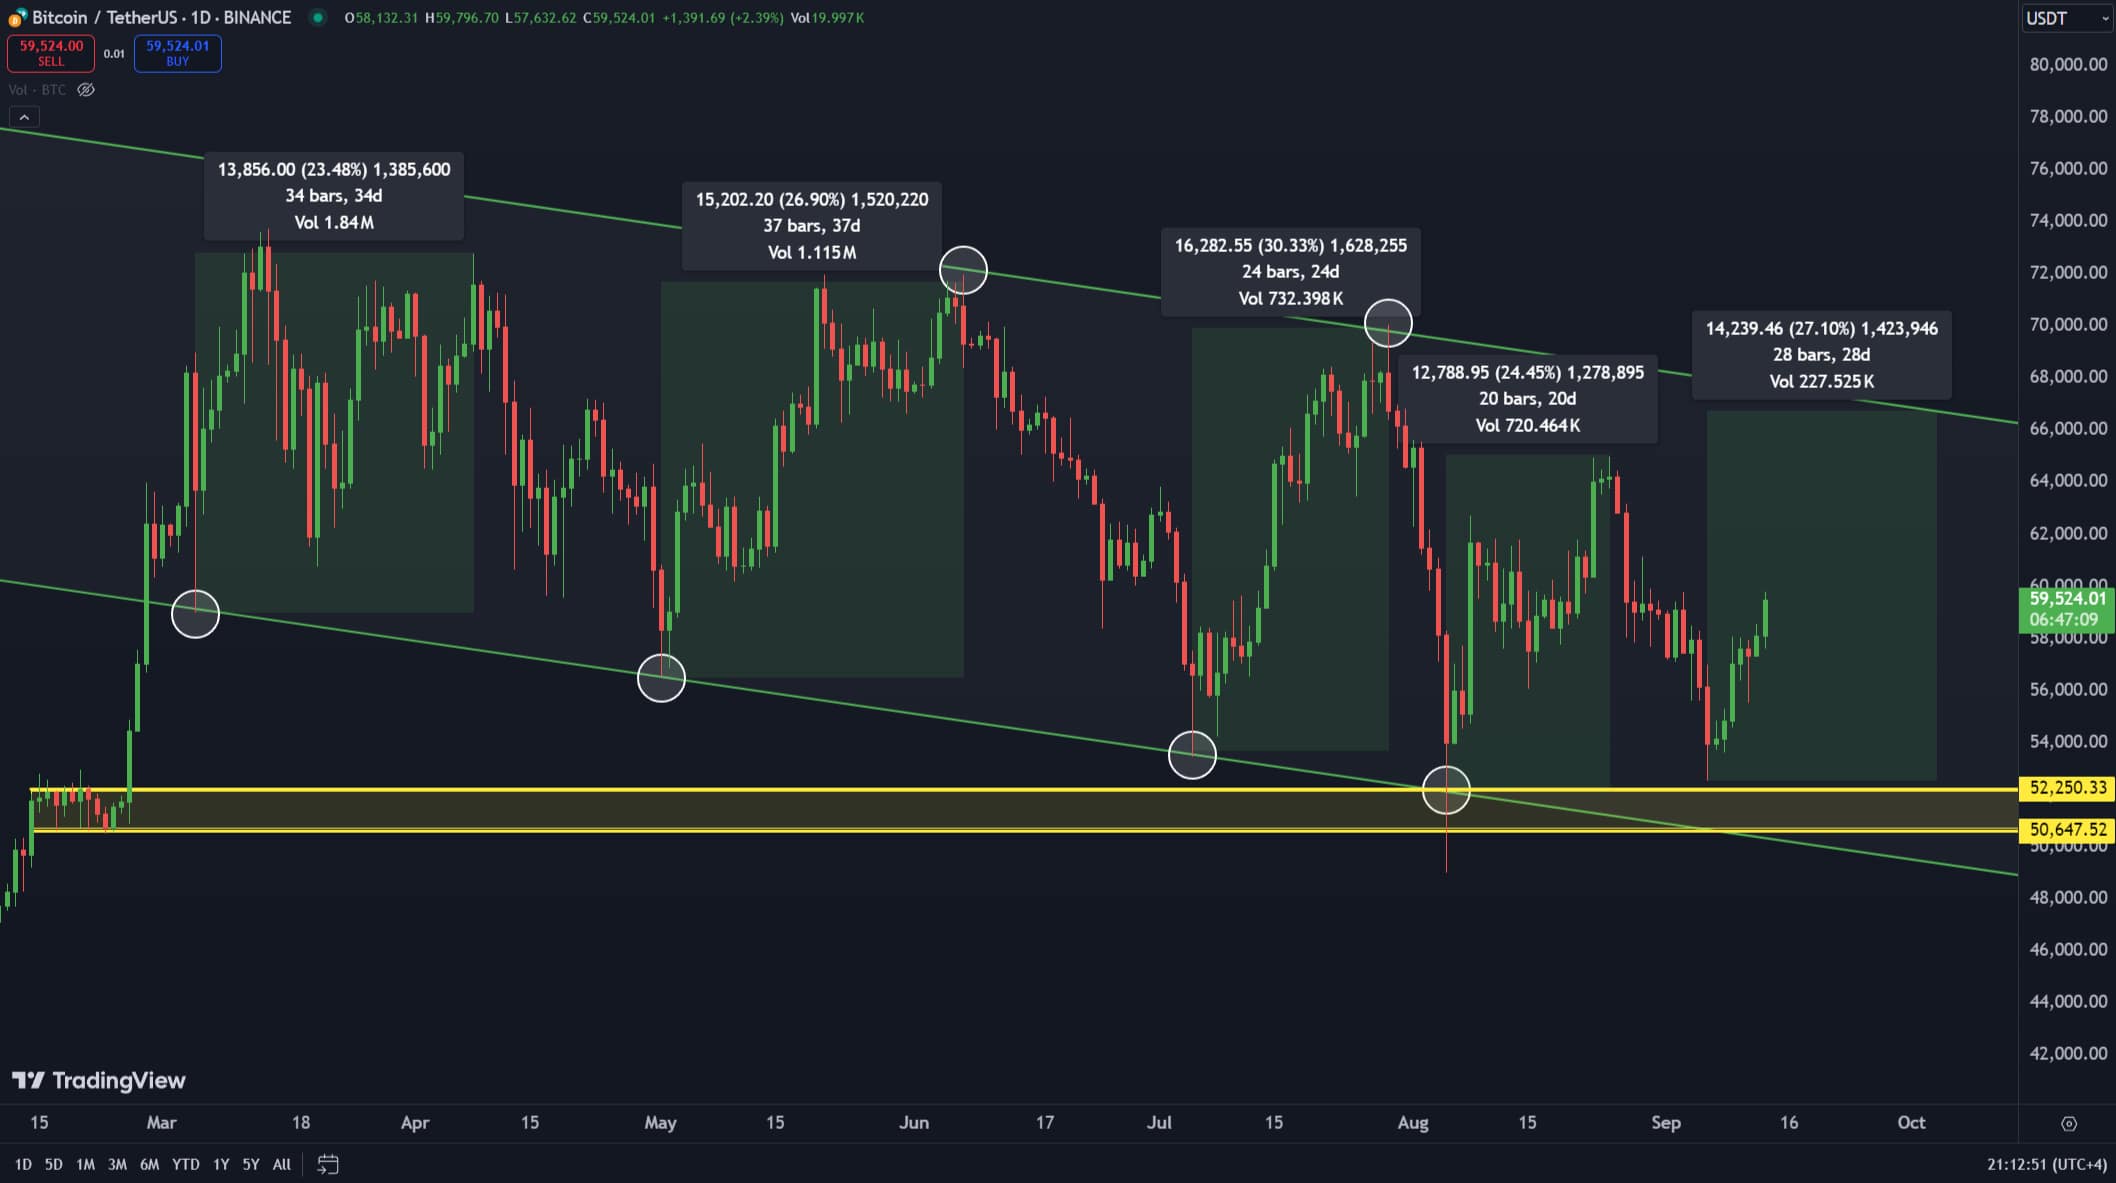
According to analyst Carl Runefelt’s chart, Bitcoin’s recent gains followed its rebound from a major support level between $52,250.33 and $50,647.52. This level is significant as it coincides with the bottom of the descending channel in which Bitcoin has been trading lately.
A descending channel on a price chart typically signals potential upward movement due to greater liquidity driving the asset’s price higher.
Source: X
According to Runefelt, the convergence of these levels could propel Bitcoin by 27.10%, reaching the upper edge of the descending channel around the $66,000-mark.
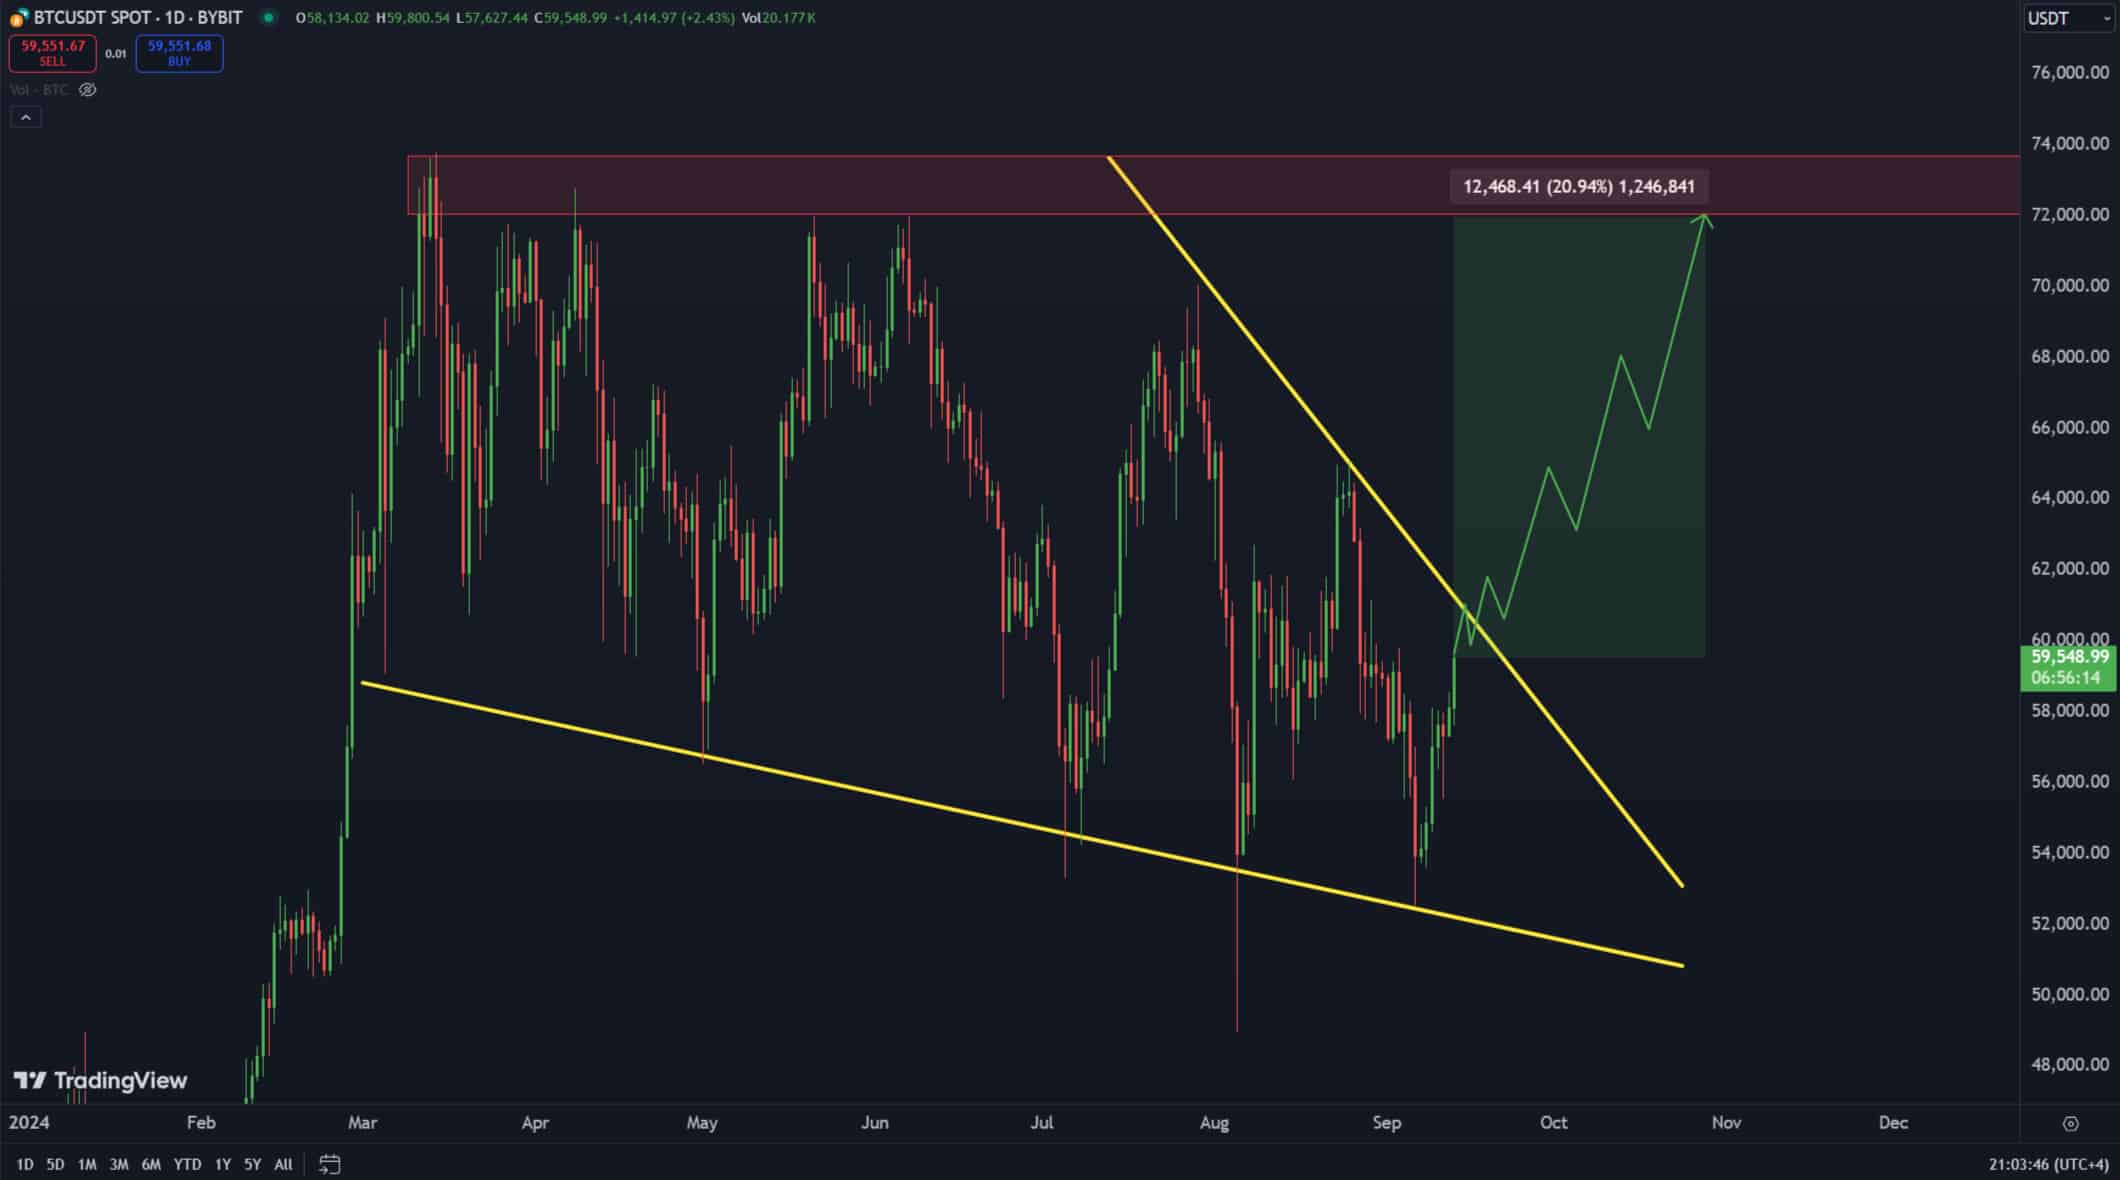
In another analysis by Runefelt, he observed that Bitcoin also formed a descending resistance line.
Breaking this line could lead to significant gains. Runefelt added,
“It [BTC] could go parabolic.”
Source: X
From the levels indicated on his chart, this breakout could push Bitcoin to the next major liquidity zones between $72,000 and $74,000. Or potentially even higher, depending on the market momentum.
A spike in whale activity bodes well for BTC
AMBCrypto also discovered a notable hike in whale activity, one characterized by significant fund inflows into the market. This can positively affect Bitcoin’s price on the charts.
A standout transaction was MicroStrategy’s acquisition of 18,300 BTC between 6 August and 12 September. The firm’s latest transactions brought its total holdings to 244,800 BTC – Meaning, unrealized gains of $4.71 billion.
Additionally, other whales have also been active. Recently, one such investor acquired 1,062 BTC, increasing their total holdings to 10,043 BTC worth $603.84 million.
Whale acquisition such as this is a sign of renewed confidence in the asset. Such confidence tends to increase the demand for the asset, in this case, BTC.
Moreover, there has been a surge in market liquidity through stablecoins. For instance, USDC’s Treasury recently minted 50 million USDC and transferred it to Coinbase, indicating rising demand as market participants look to acquire more.
During this period, there was also a significant transfer of $30,950,165 from Coinbase Institution to Coinbase – Another sign of the underlying demand for liquidity to purchase tokens.
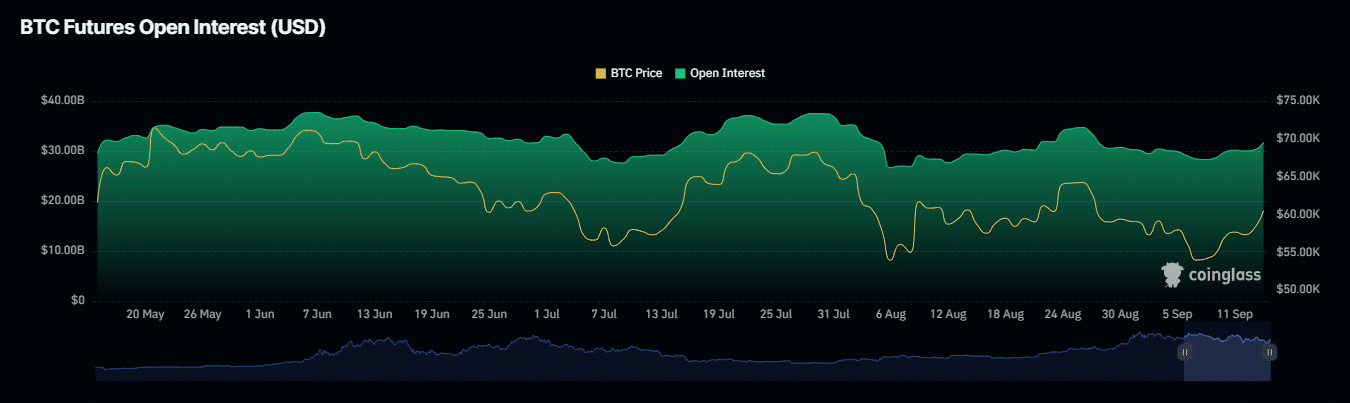
As whale activities persist, retail investors have begun to mirror these buying patterns. In fact, according to Coinglass, Open Interest in BTC had climbed by 5.22% to $31.72 billion at press time – Its highest level since early September.
Source: Coinglass
Should this trend continue, the likelihood of Bitcoin climbing to higher price levels will soon appear increasingly probable.
A new high is close for BTC
Finally, recent data from Coinglass on liquidations suggested that short traders, who bet on the price of BTC falling, have seen major losses.
In 24 hours alone, $48.81 million out of $55.1 million in short positions were forcibly closed as BTC surged past $60,000. This trend suggested that the market is currently favoring bull over bear traders.
Additionally, there has been a notable decline in BTC supply across various exchanges. In fact, according to IntoTheBlock, the Exchange Netflows for the past seven days revealed a reduction of 9.67k BTC and 4.55k BTC.
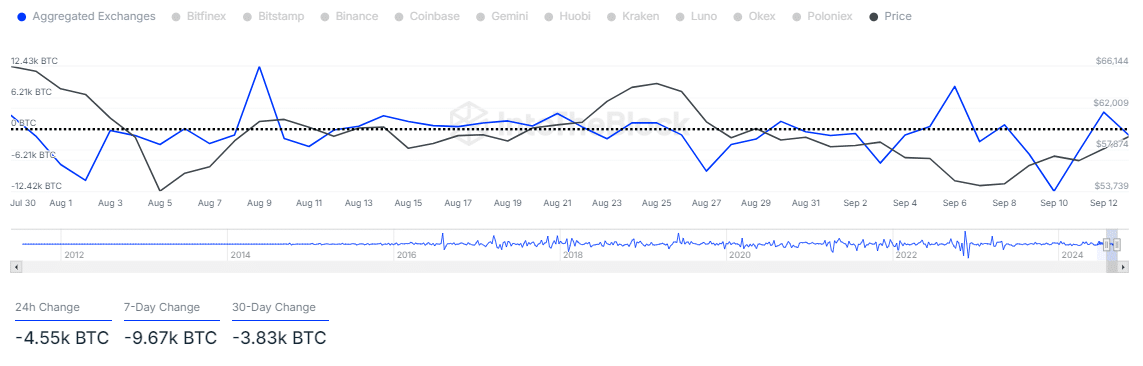
A fall in available BTC on exchanges often leads to a supply squeeze, which typically drives prices north.
If these metrics continue on their current path, it is likely that BTC will see further movement upwards on the charts.