Bitcoin’s rally comes to a halt – Examining the effects of this sell signal

- On-chain metrics revealed that selling sentiment was dominant across the market
- A key market indicator hinted at a trend reversal, but others remained bearish
Bitcoin’s [BTC] week-long bull rally came to a halt as its daily chart turned red over the last few hours. In fact, BTC lost some momentum between 16 and 17 May after a sell signal flashed on its price chart. Hence, it’s worth looking at Bitcoin’s state to see whether this trend is likely to continue in the near-term.
Bitcoin hits the pause button
According to CoinMarketCap, Bitcoin was having a comfortable weekly rally as its price hiked by more than 4%. The price uptrend allowed BTC to climb as high as $66k. However, the king coin soon hit a roadblock after the emergence of a sell signal.
Ali, a popular crypto analyst, shared a tweet highlighting this development. The tweet also mentioned that he expects one to four candlestick corrections for BTC.
The analysis turned out to be accurate, as the king of cryptos’ price did drop. BTC’s price declined by 0.71% and at the time of writing, the coin was trading at $65,464.76 with a market capitalization of over $1.29 trillion.
AMBCrypto then assessed CryptoQuant’s data to see whether this halt to BTC’s rally would last longer. As per our analysis, BTC’s aSORP was red, meaning that more investors are now selling at a profit. In the middle of a bull market, it can indicate a market top.
Also, its Net Unrealized Profit and Loss (NULP) revealed that investors are in a belief phase, one where they are currently in a state of high unrealized profits.
Will this trend last?
Upon closer inspection, AMBCrypto found that selling sentiment in general seemed dominant across the market. In fact, BTC’s net deposit on exchanges was high, compared to the last 7 days’ average.
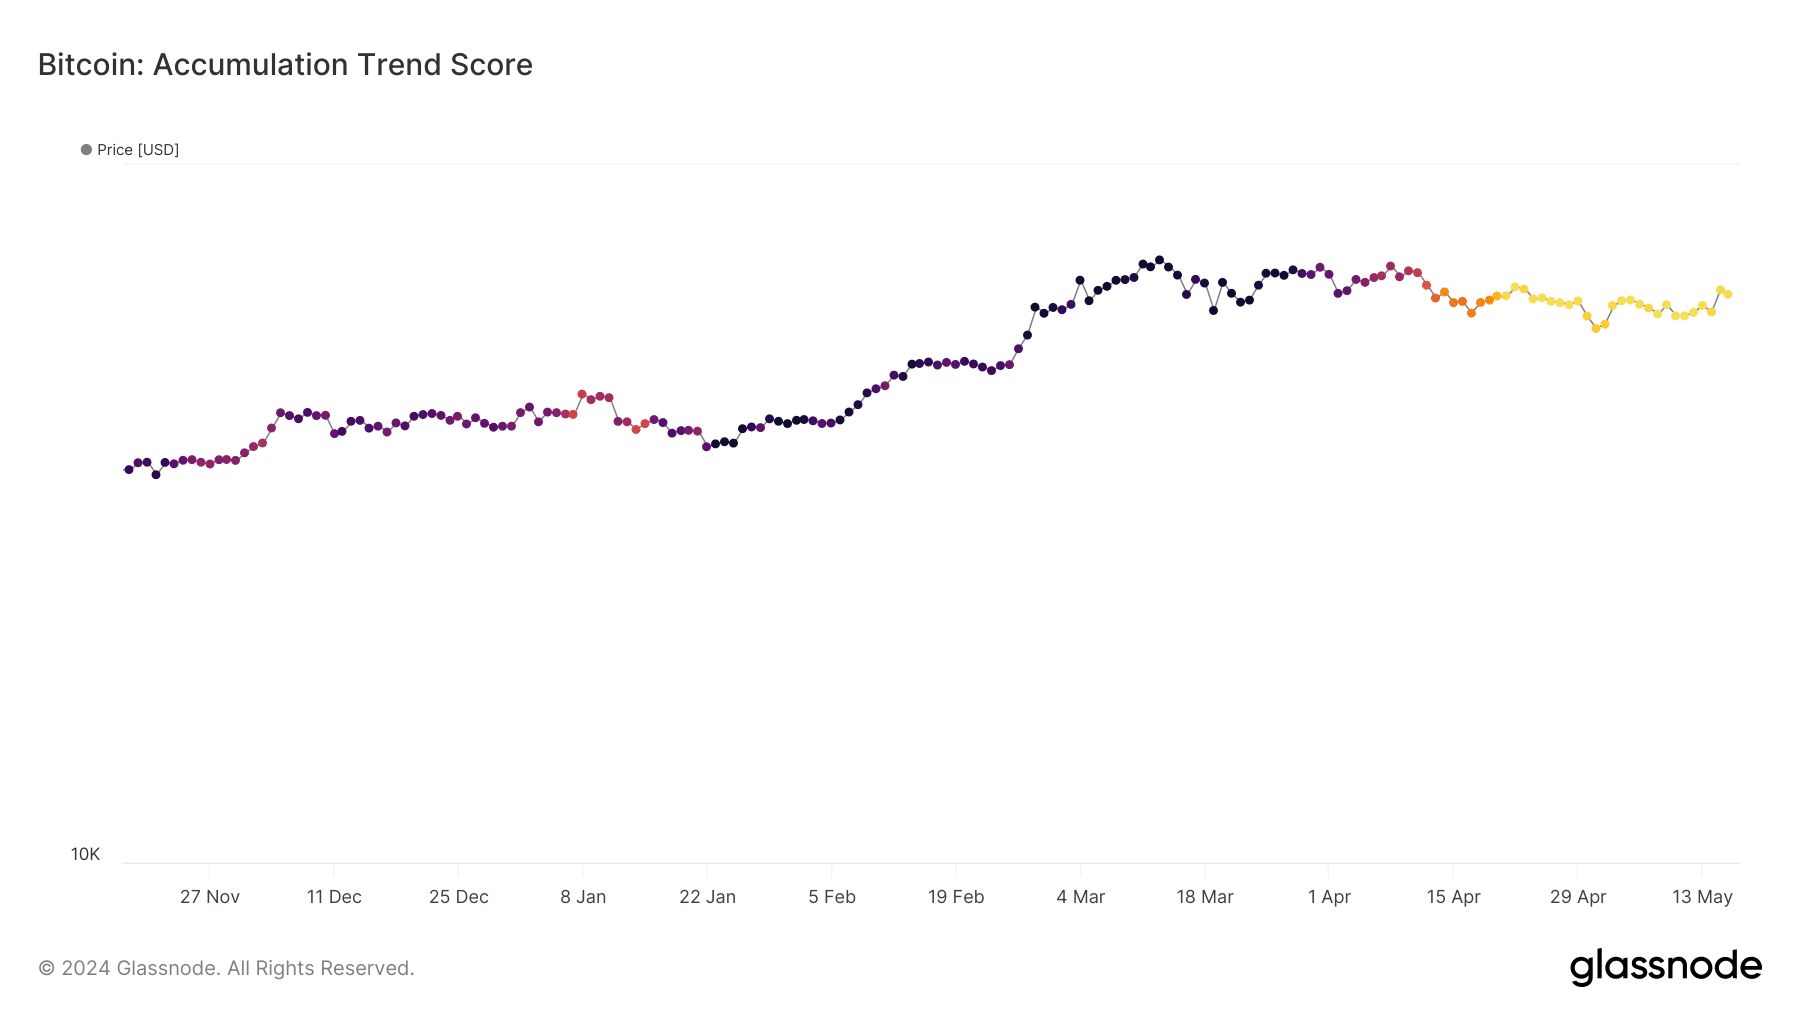
A look at Glassnode’s data revealed yet another bearish metric. Bitcoin’s accumulation trend score had a value of 0.0061 at press time, indicating that investors have not been stockpiling BTC.
For starters, the Accumulation Trend Score is an indicator that reflects the relative size of entities that are actively accumulating coins on-chain in terms of their BTC holdings. A value closer to 1 indicates high accumulation, and a value closer to 0 suggests investors are distributing or not accumulating.
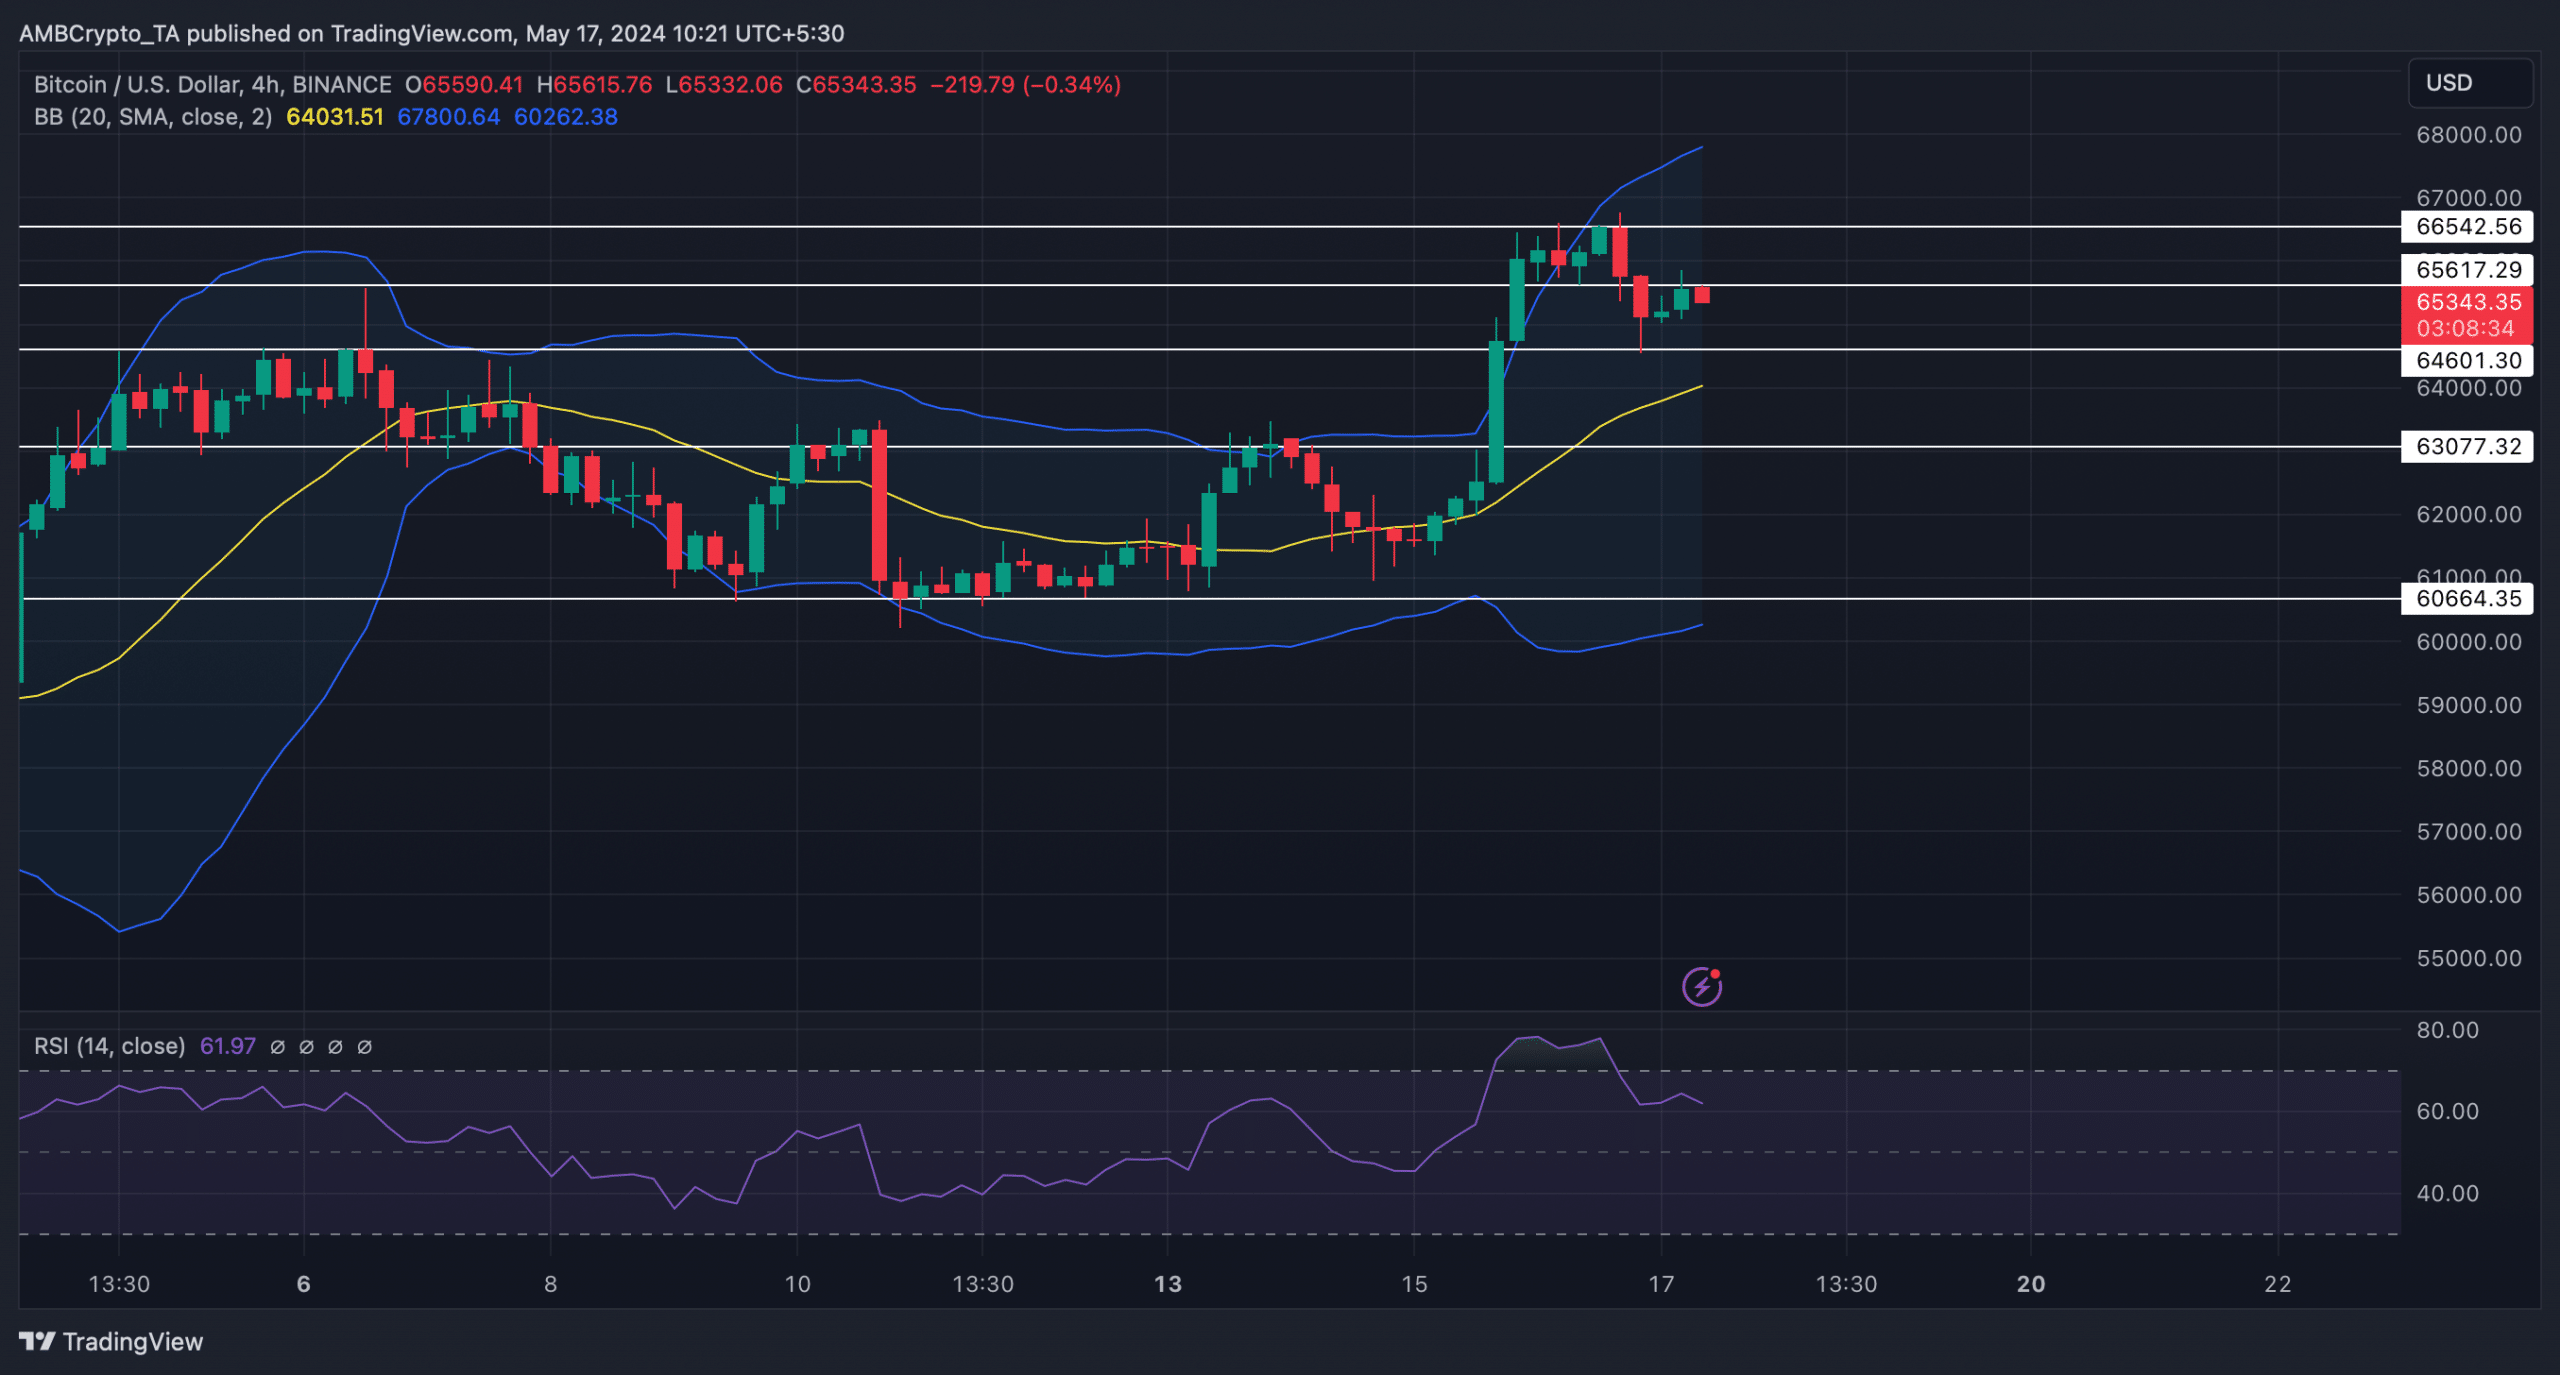
Finally, AMBCrypto analyzed BTC’s 4-hour chart to better understand the possibility of Bitcoin resuming its bull rally anytime soon. At the time of writing, BTC was testing its resistance at $65.6k. A successful breakout above that level would allow BTC to turn bullish again.
Is your portfolio green? Check the Bitcoin Profit Calculator
Also, the Bollinger Bands revealed that BTC was trading well above its 20-day simple moving average (SMA) – A bullish signal. However, the Relative Strength Index (RSI) registered a decline. This could be a sign that BTC might not manage to breach its resistance in the short term.


