
- BTC’s price has appreciated by over 6% as it approached $63k on the charts
- Most metrics and indicators flashed green too
Bitcoin’s [BTC] price action once again turned volatile as it swiftly approached $63k on the charts. In the meantime, however, a pattern seemed to be forming on the cryptocurrency’s price chart – A sign that BTC’s price might hit $75k in the coming weeks.
Bitcoin’s price action looks promising
According to CoinMarketCap, BTC has gained by more than 6% over the past week, with it appreciating by 3% in the last 24 hours alone. At the time of writing, BTC was trading at $62,998.95 with a market capitalization of over $1.24 trillion.
Despite its fall from its ATH, however, most market analysts remain positive about the crypto’s price action. In fact, AMBCrypto had previously reported that Ki Young Ju, CEO of analytics firm CryptoQuant, claimed that Bitcoin’s network fundamentals could support a market valuation “three times its current size.”
While BTC’s price action turned bullish, Titan of Cryptos, a popular crypto-analyst, pointed out in a tweet that an inverse head-and-shoulder pattern was forming on BTC’s price chart. As per the tweet, the pattern suggested that BTC’s price might soon cross its all-time high (ATH) and hit $75k in the coming weeks.
However, the tweet also mentioned the adverse scenario. If everything doesn’t fall into place, then BTC might drop down to $56k again. Hence, it’s worth taking a closer look at the cryptocurrency’s state to see which outcome is more likely.
What to expect from Bitcoin?
AMBCrypto’s analysis of CryptoQuant’s data revealed that Bitcoin’s exchange reserves have been dropping. This clearly meant that buying pressure was high, which can be inferred as a bullish signal.
Its binary CDD suggested that long-term holders’ movements in the last 7 days were lower than average, meaning that they have a motive to hold their coins. On top of that, BTC’s NVT ratio dropped last week, meaning that it was undervalued. These metrics backed the possibility of BTC touching or going above its ATH.
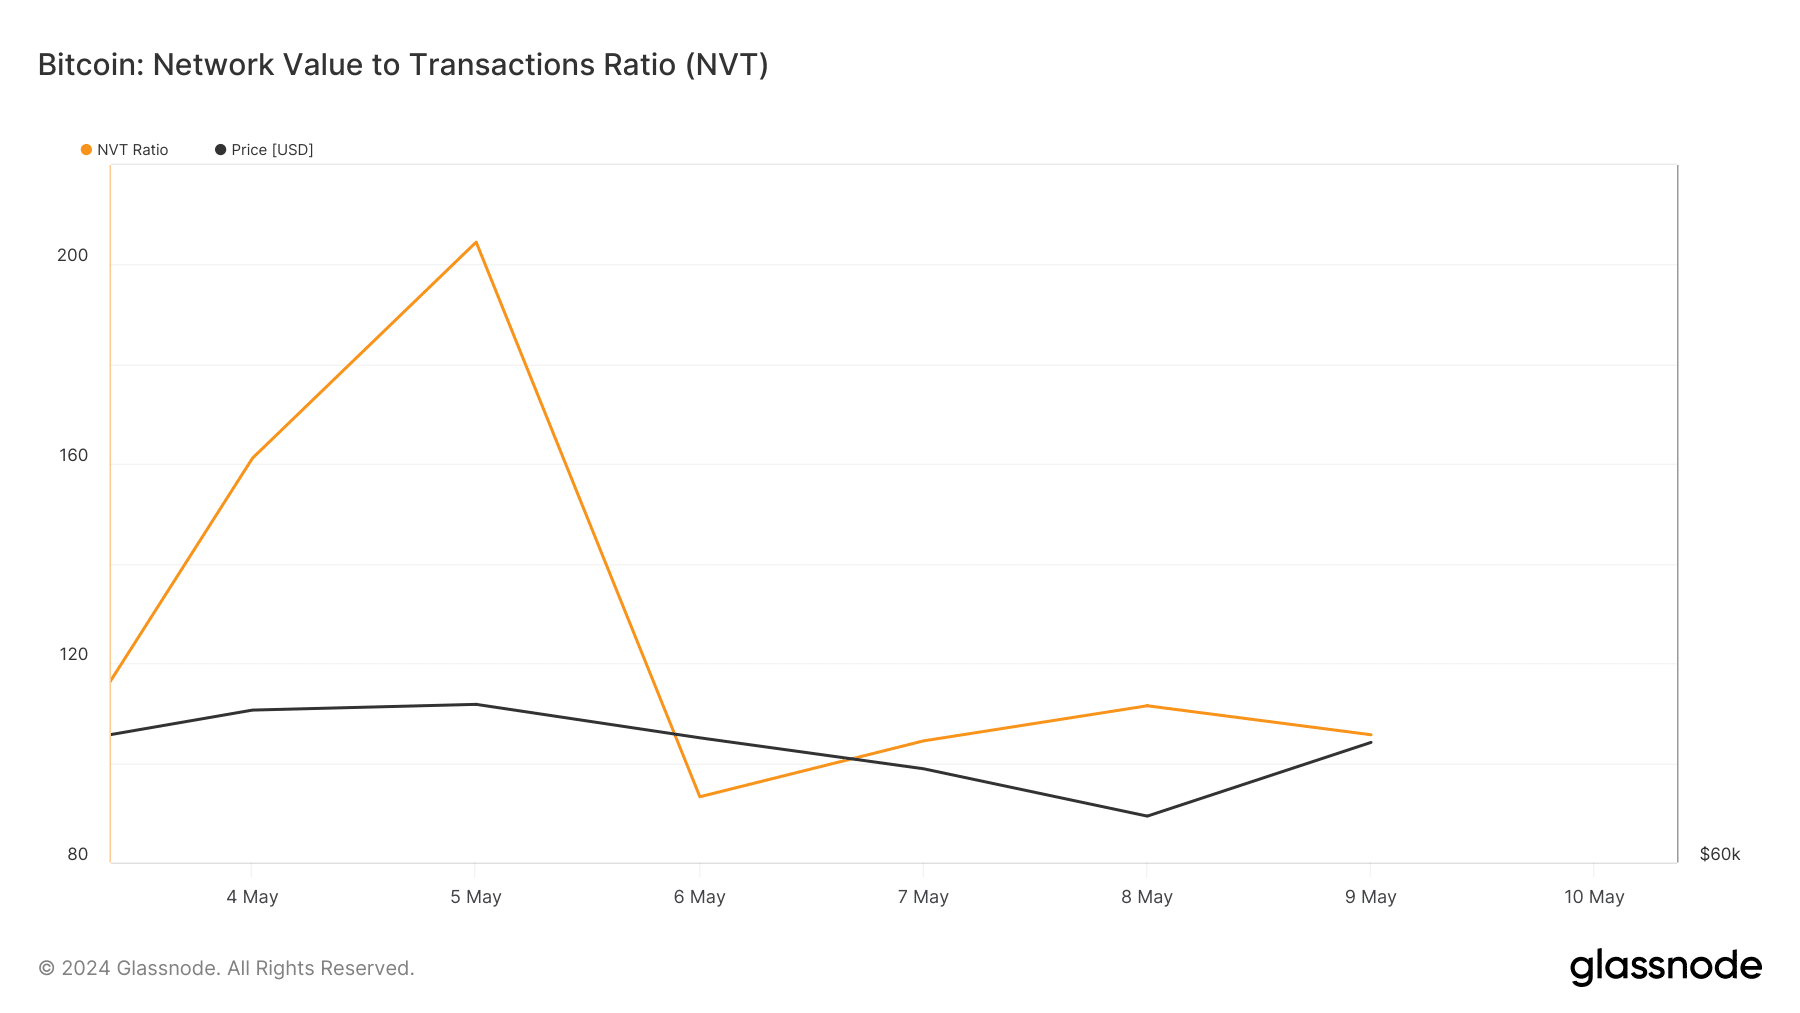
Source: Glassnode
However, its aSORP flashed opposing signals.
At press time, BTC’s aSORP was red, indicating that more investors have been selling at a profit. In the middle of a bull market, this can indicate a market top.

Source: CryptoQuant
To check whether the market has reached its top, AMBCrypto then analyzed BTC’s daily chart. As per our analysis, BTC was testing its 20-day exponential moving average (EMA) at the time. A successful breakout above it would ensure a sustained bull rally.
Read Bitcoin’s [BTC] Price Prediction 2024-25
Its Money Flow Index (MFI) also registered a sharp uptick.
On the contrary, the Chaikin Money Flow (CMF) looked bearish. This was a sign that BTC’s price might start to decline, which could push its value down to $56k on the charts.

Source: TradingView