Bitcoin’s RSI hits oversold, rebounds – Is the worst over for BTC?
The 24-hour liquidation heatmap showed that the $97.5k and $94k were the immediate targets.

- The Bitcoin 4-hour RSI dived to levels not seen since last August.
- The quick reaction to jump above $100k was good for scalp traders.
According to Bybit CEO Ben Zhou, the whole crypto market likely saw a real total liquidation of around $10 billion. Bitcoin [BTC] saw a 6.6% price drop on the 3rd of February, nuking the entire crypto market cap by 11.7%.
Trump’s trade tariffs rattled financial markets and the fearful investor sentiment rocked the crypto world. However, BTC has since bounced by just over 8%, reclaiming a key support level.
Bitcoin’s RSI could be the clue for…
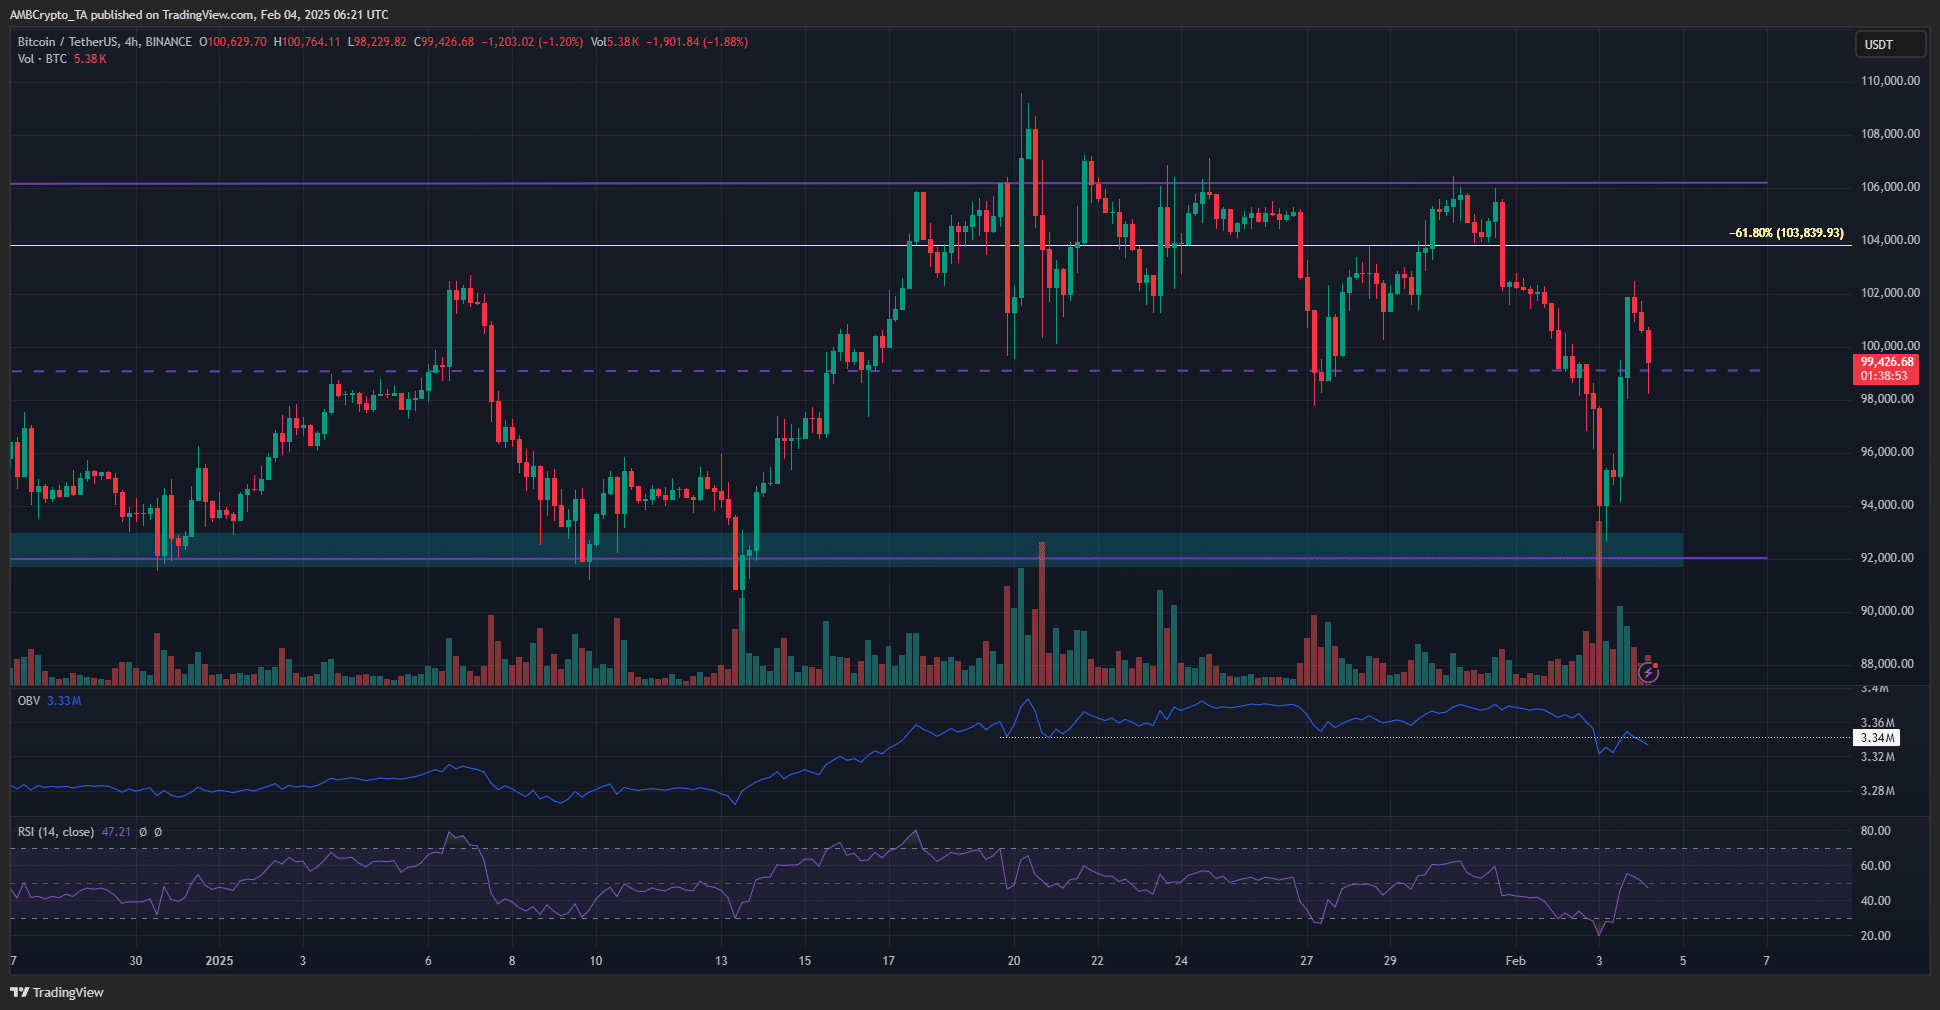
The Relative Strength Index (RSI) measures the momentum of an asset over the past 14 trading sessions. An RSI above 70 indicates overbought conditions, while below 30 means oversold.
On the 3rd of January, the 4-hour RSI plummeted to 19.76. Previously, the reading dropped below 25 in December and to 16 in early August after BTC fell from just below $60k to $49k.
Bitcoin’s reaction in the past 24 hours was encouraging. The range formation of the past two months between $92k and $106.2k was respected. At press time, the mid-range level at $99.1k acted as support.
After dropping to test the $92k support zone, Bitcoin quickly bounced higher and touched $102.5k. The RSI moved back above neutral 50. In the past few hours, it has dipped 3% but remains above the mid-range level.
Read Bitcoin’s [BTC] Price Prediction 2025-26
While the price action remained above key support zones, the OBV has made a new lower low compared to the past month.
This showed that the increased selling volume over the past 36 hours has shifted the bias in favor of the bears.
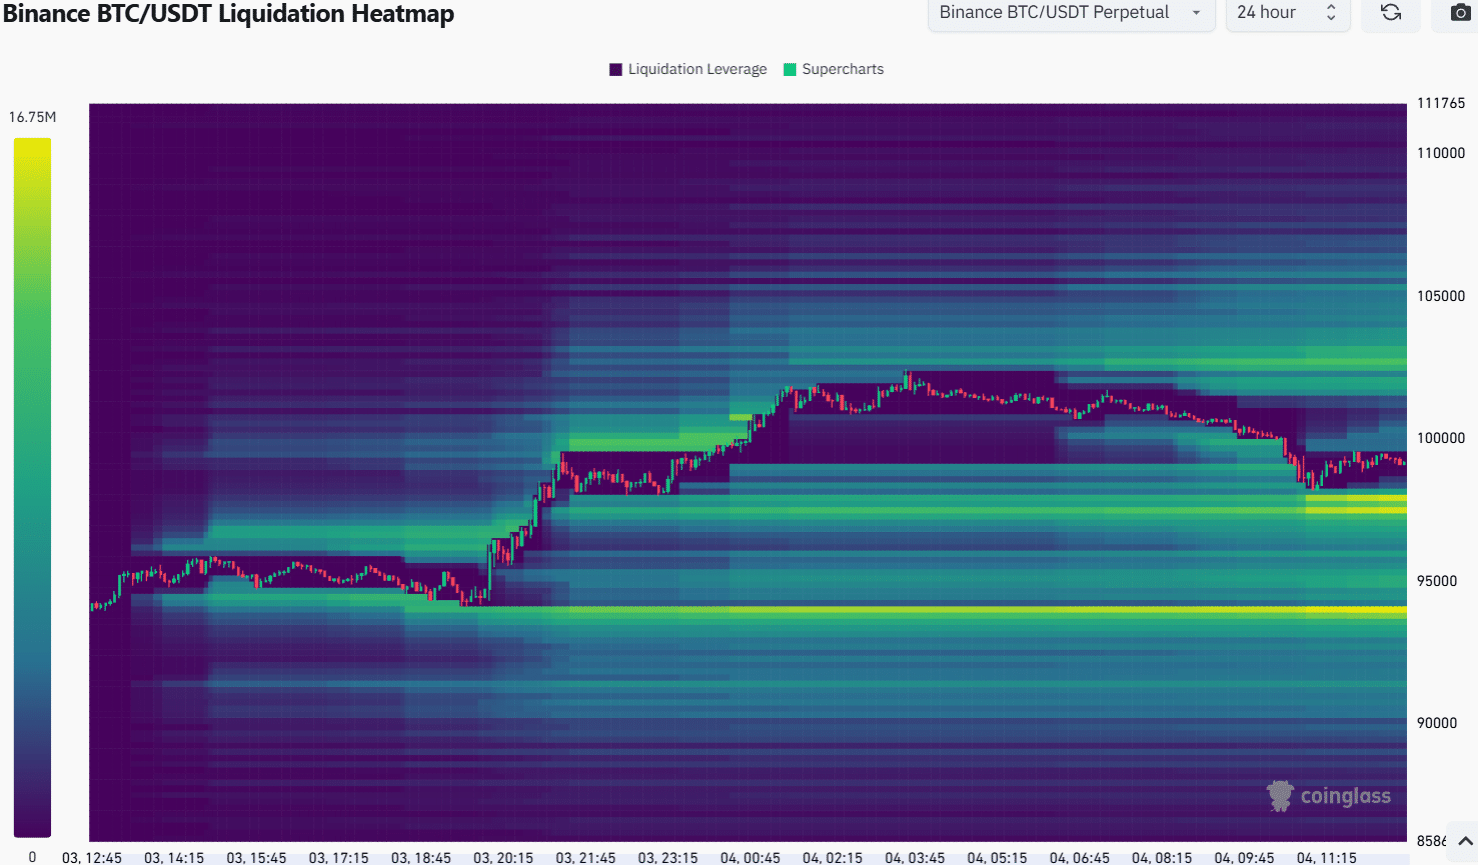
The 24-hour liquidation heatmap showed that the $97.5k and $94k were the immediate targets. Overall, the quick bullish reaction from Bitcoin was a positive sign for investors.
Yet, another drop to $94k-$95k was possible and traders should be prepared.
Disclaimer: The information presented does not constitute financial, investment, trading, or other types of advice and is solely the writer’s opinion


