Bitcoin’s slow pace: Are long-term holders to blame?

- As per the latest analysis, the profit-taking trend might continue further.
- However, a bullish pattern appeared on BTC’s 12-hour chart.
Bitcoin [BTC] momentum remained low as it continued to consolidate near the $96k mark. The latest analysis revealed a possible reason behind this trend. In fact, the analysis also revealed that the ongoing trend might continue further.
Bitcoin long-term holders’ plan
After touching $97k on the 2nd of December, Bitcoin’s price plummeted to $94k. However, the king coin gained slight bullish momentum as it once again crossed $96k.
This price movement indicated a consolidation phase within this range, as it was failing to meet investors’ expectation of reaching $100k.
Meanwhile, Alphractal, a data analytics platform, posted a tweet pointing out how long-term holders’ actions might be influencing BTC’s price.
As per the tweet, LTHs have distributed a significant amount of BTC at a profit, increasing short-term selling pressure. This trend is clearly reflected in the Long Term Holders SOPR indicator.
Furthermore, since late 2023, the addresses of these holders have continued to be at extremely profitable levels, according to the Long Term Holders NUPL Heatmap.
This indicated that LTHs might take more profit, possibly causing a further rise in selling pressure. If that’s true, then this factor could be causing BTC’s price to consolidate. In fact, a similar trend was seen during BTC’s previous cycles.
The tweet mentioned,
“It’s important to note that this distribution phase by Long-Term Holders can extend over several months, as observed in all previous cycles. This underscores their strategy of capitalizing on bullish cycles to move and realize profits from BTC held inactive for over 155 days.”
Will BTC continue to consolidate?
Since the aforementioned analysis suggested the possibility of continued profit taking, AMBCrypto checked other datasets to find whether they also suggest a similar future, which could restrict BTC from moving up.
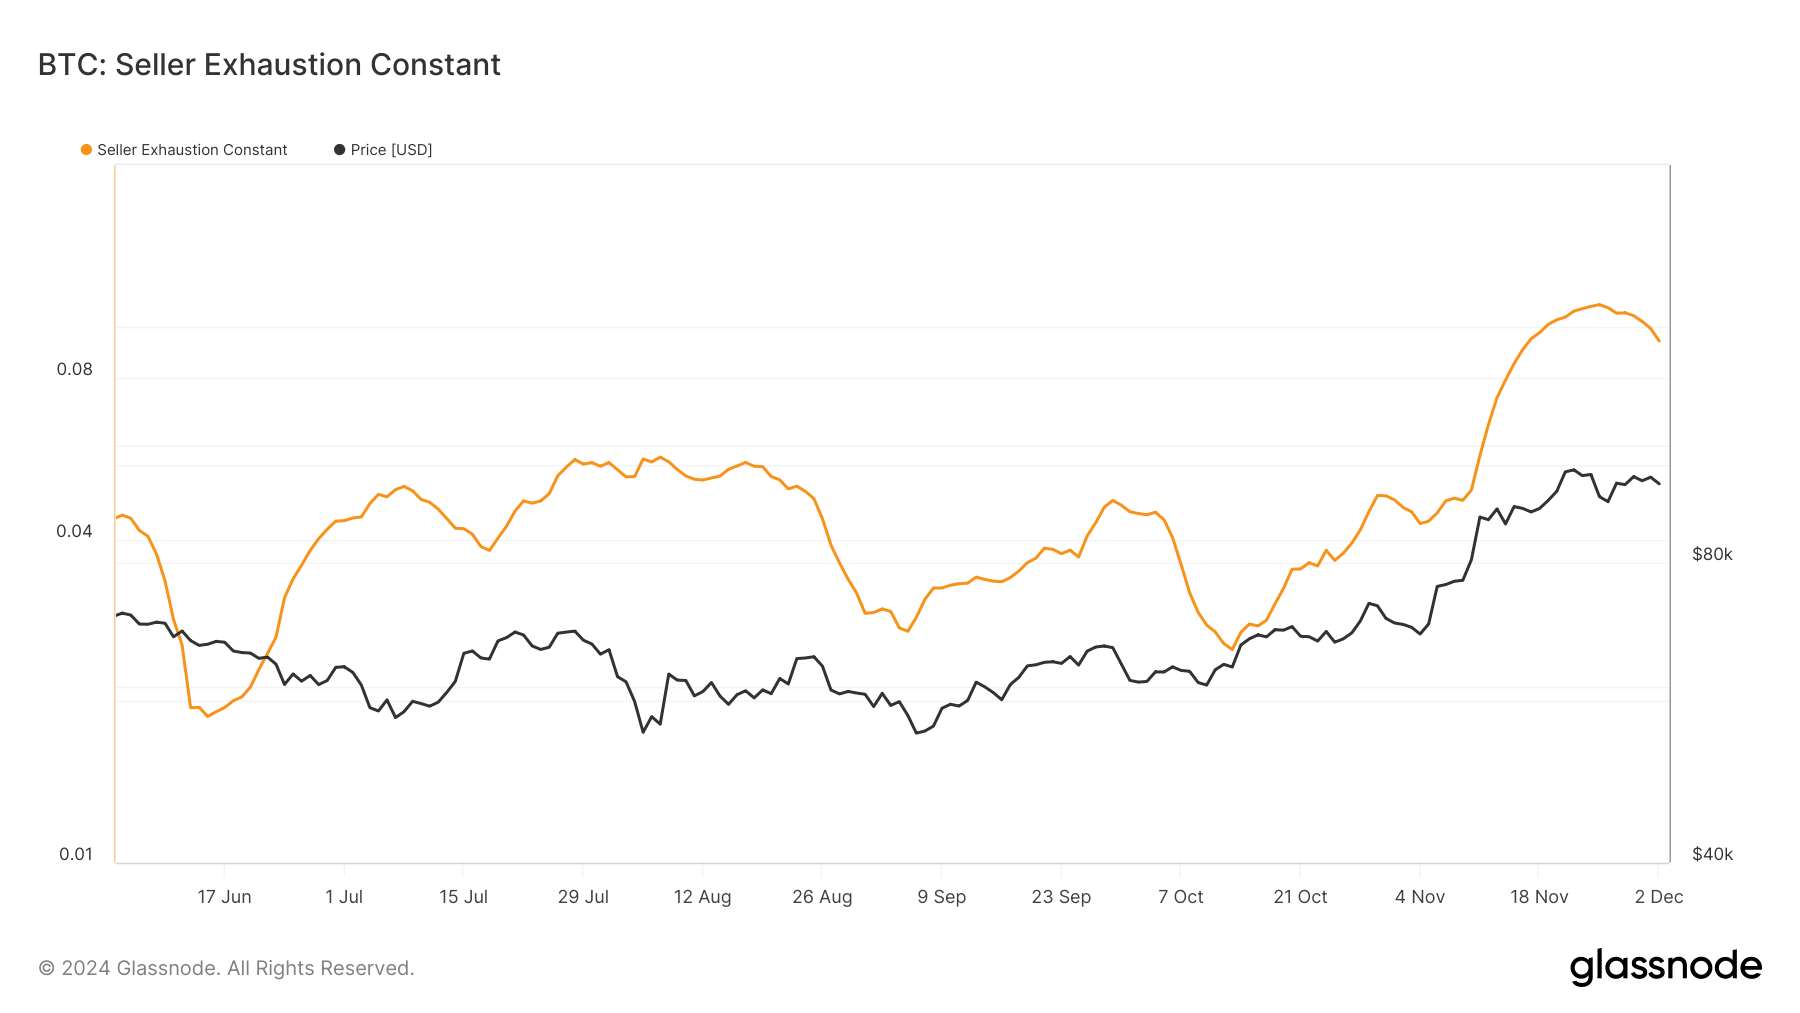
Glassnode’s data revealed that BTC’s seller exhaustion constant started to decline after reaching a peak. On quite a few occasions, when the metric dropped, it was followed by slight price upticks.
The Pi Cycle Top indicator pointed out that BTC has a market top of over $124k. Therefore, if profit taking declines and buying pressure rises, then it won’t be too ambitious to expect BTC touching $100k in the coming weeks.
Read Bitcoin’s [BTC] Price Prediction 2024–2025
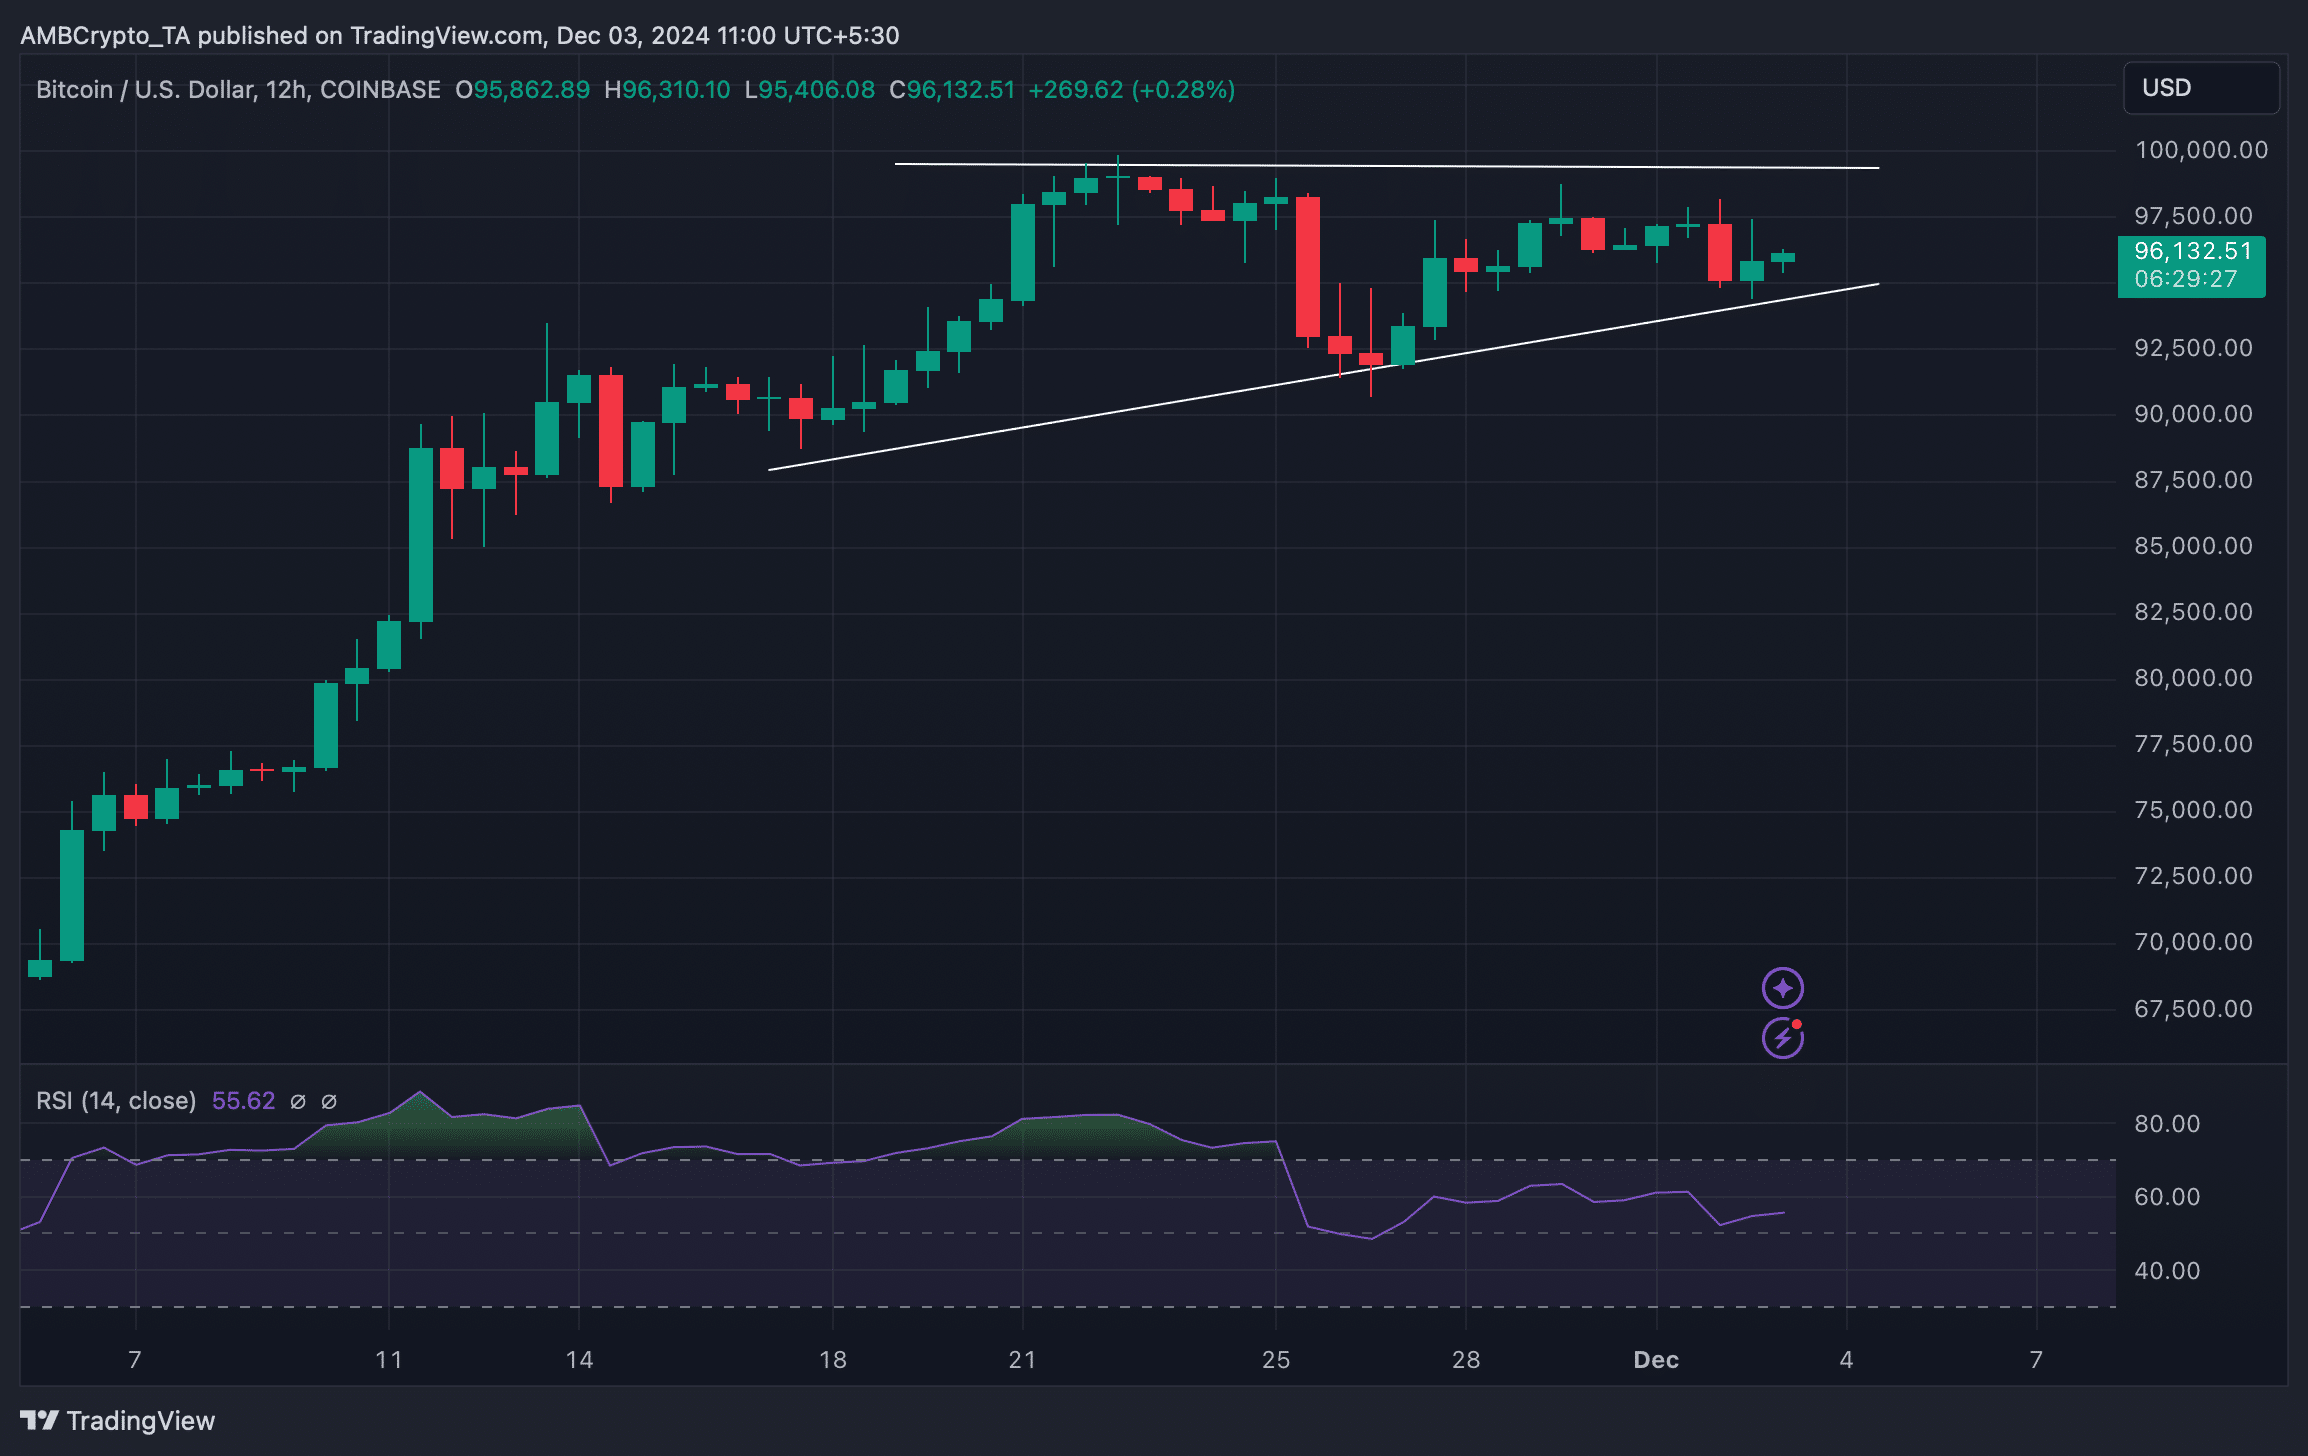
Additionally, we found that BTC’s price was moving inside a bullish ascending triangle pattern. A successful breakout above that mark could trigger a fresh bull rally.
The odds of that happening were decent, as the Relative Strength Index (RSI) registered an uptick. This meant that buying pressure was rising, which has the potential to push BTC’s price up.


