
- Bitcoin’s long-term holder SOPR hit 1, indicating average sells at break-even
- Analysis of BTC’s key metrics and patterns suggested the bull run is still on.
Bitcoin’s [BTC] recent price action and on-chain metrics are crucial for understanding market sentiment, given its position as the cryptocurrency with the largest market cap.
The Long-term Holder SOPR that tracks Bitcoin transactions by those who’ve held BTC for over 155 days is a key metric. When the SOPR’s value is above 1, it indicates profits, while a value below 1 signals losses.
After the most recent Bitcoin price drop, the SOPR hit 1, meaning many traders sold at break-even – A sign of market caution.
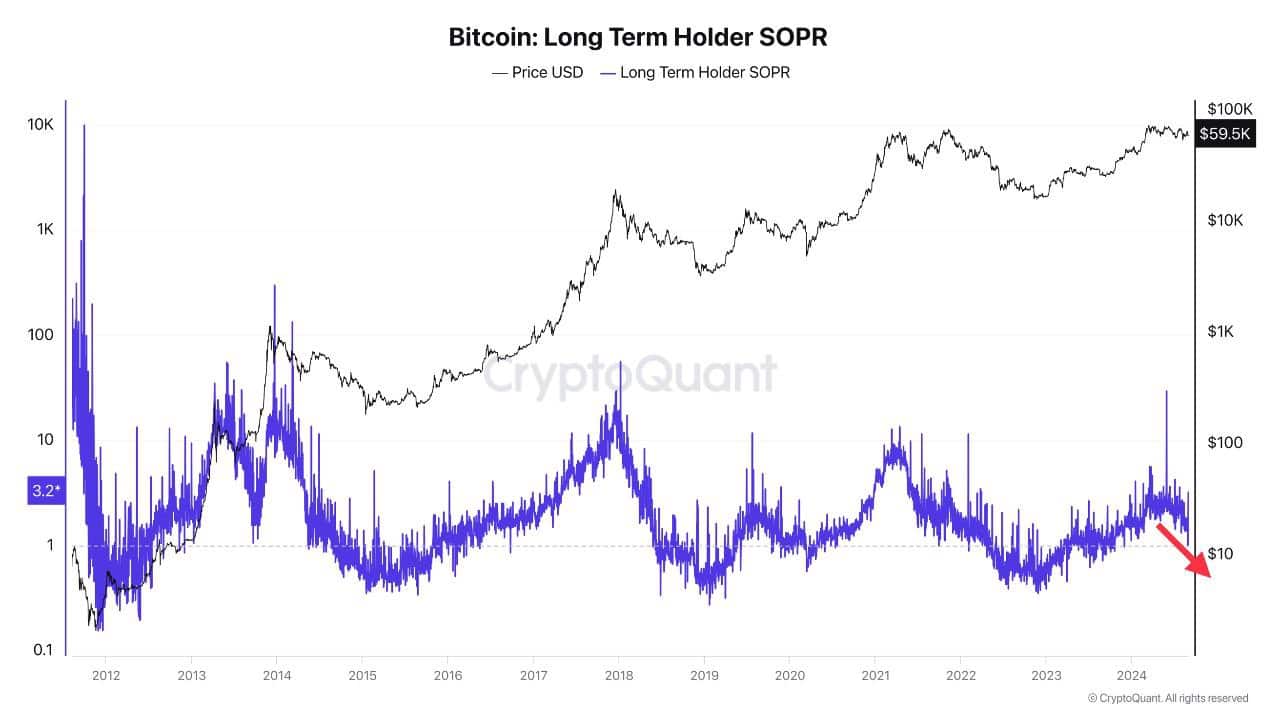
Source: CryptoQuant
Bitcoin [BTC], which had previously surged to $62k, is now trading below this level due to massive liquidations around the aforementioned level.
BTC’s broadening wedge at critical support level
Right now, Bitcoin’s price action in the BTC/USDT pair is advancing within a broadening wedge pattern. This is typically a consolidation phase, signaling the calm before a potential market move.
This pattern is sitting at a critical support level, with accumulation continuing as traders remain skeptical about Bitcoin’s potential for an upward projection.
Now, there is potential for Bitcoin to slip to the $53k price level before a possible upturn, likely in Q4 2024. The price stalling around $59k adds to the uncertainty surrounding this critical period.
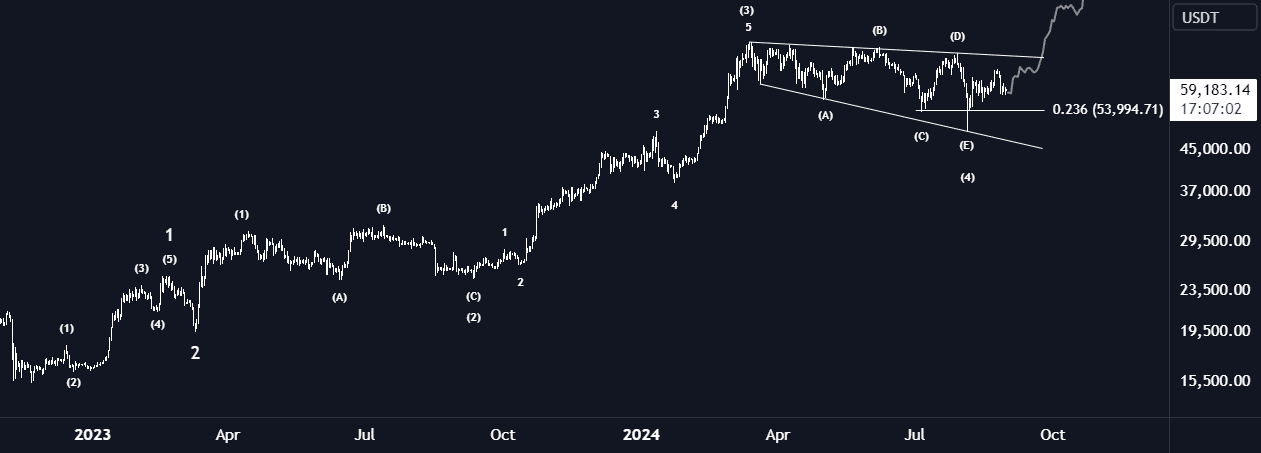
Source: TradingView
Further analysis of funding rates from Coinglass revealed little change over the past month. This, despite the massive market flush on 5 August triggered by Japan’s stock market crash due to rate hikes.
Since then, while funding rates have stabilized, they’ve remained relatively low. This supports the idea that Bitcoin is in an accumulation phase.
BTC RSI breakout pointed to a rebound
Moreover, Bitcoin’s Relative Strength Index (RSI) recently recorded its second significant breakout during this bull cycle, which could be setting the stage for another rally.
If Bitcoin [BTC] dips further below the $53k level, it might trigger panic selling, potentially leading to a rebound.
The RSI breakout, similar to a previous instance that led to a major bullish rally, suggested that BTC might be gearing up for another northbound surge.
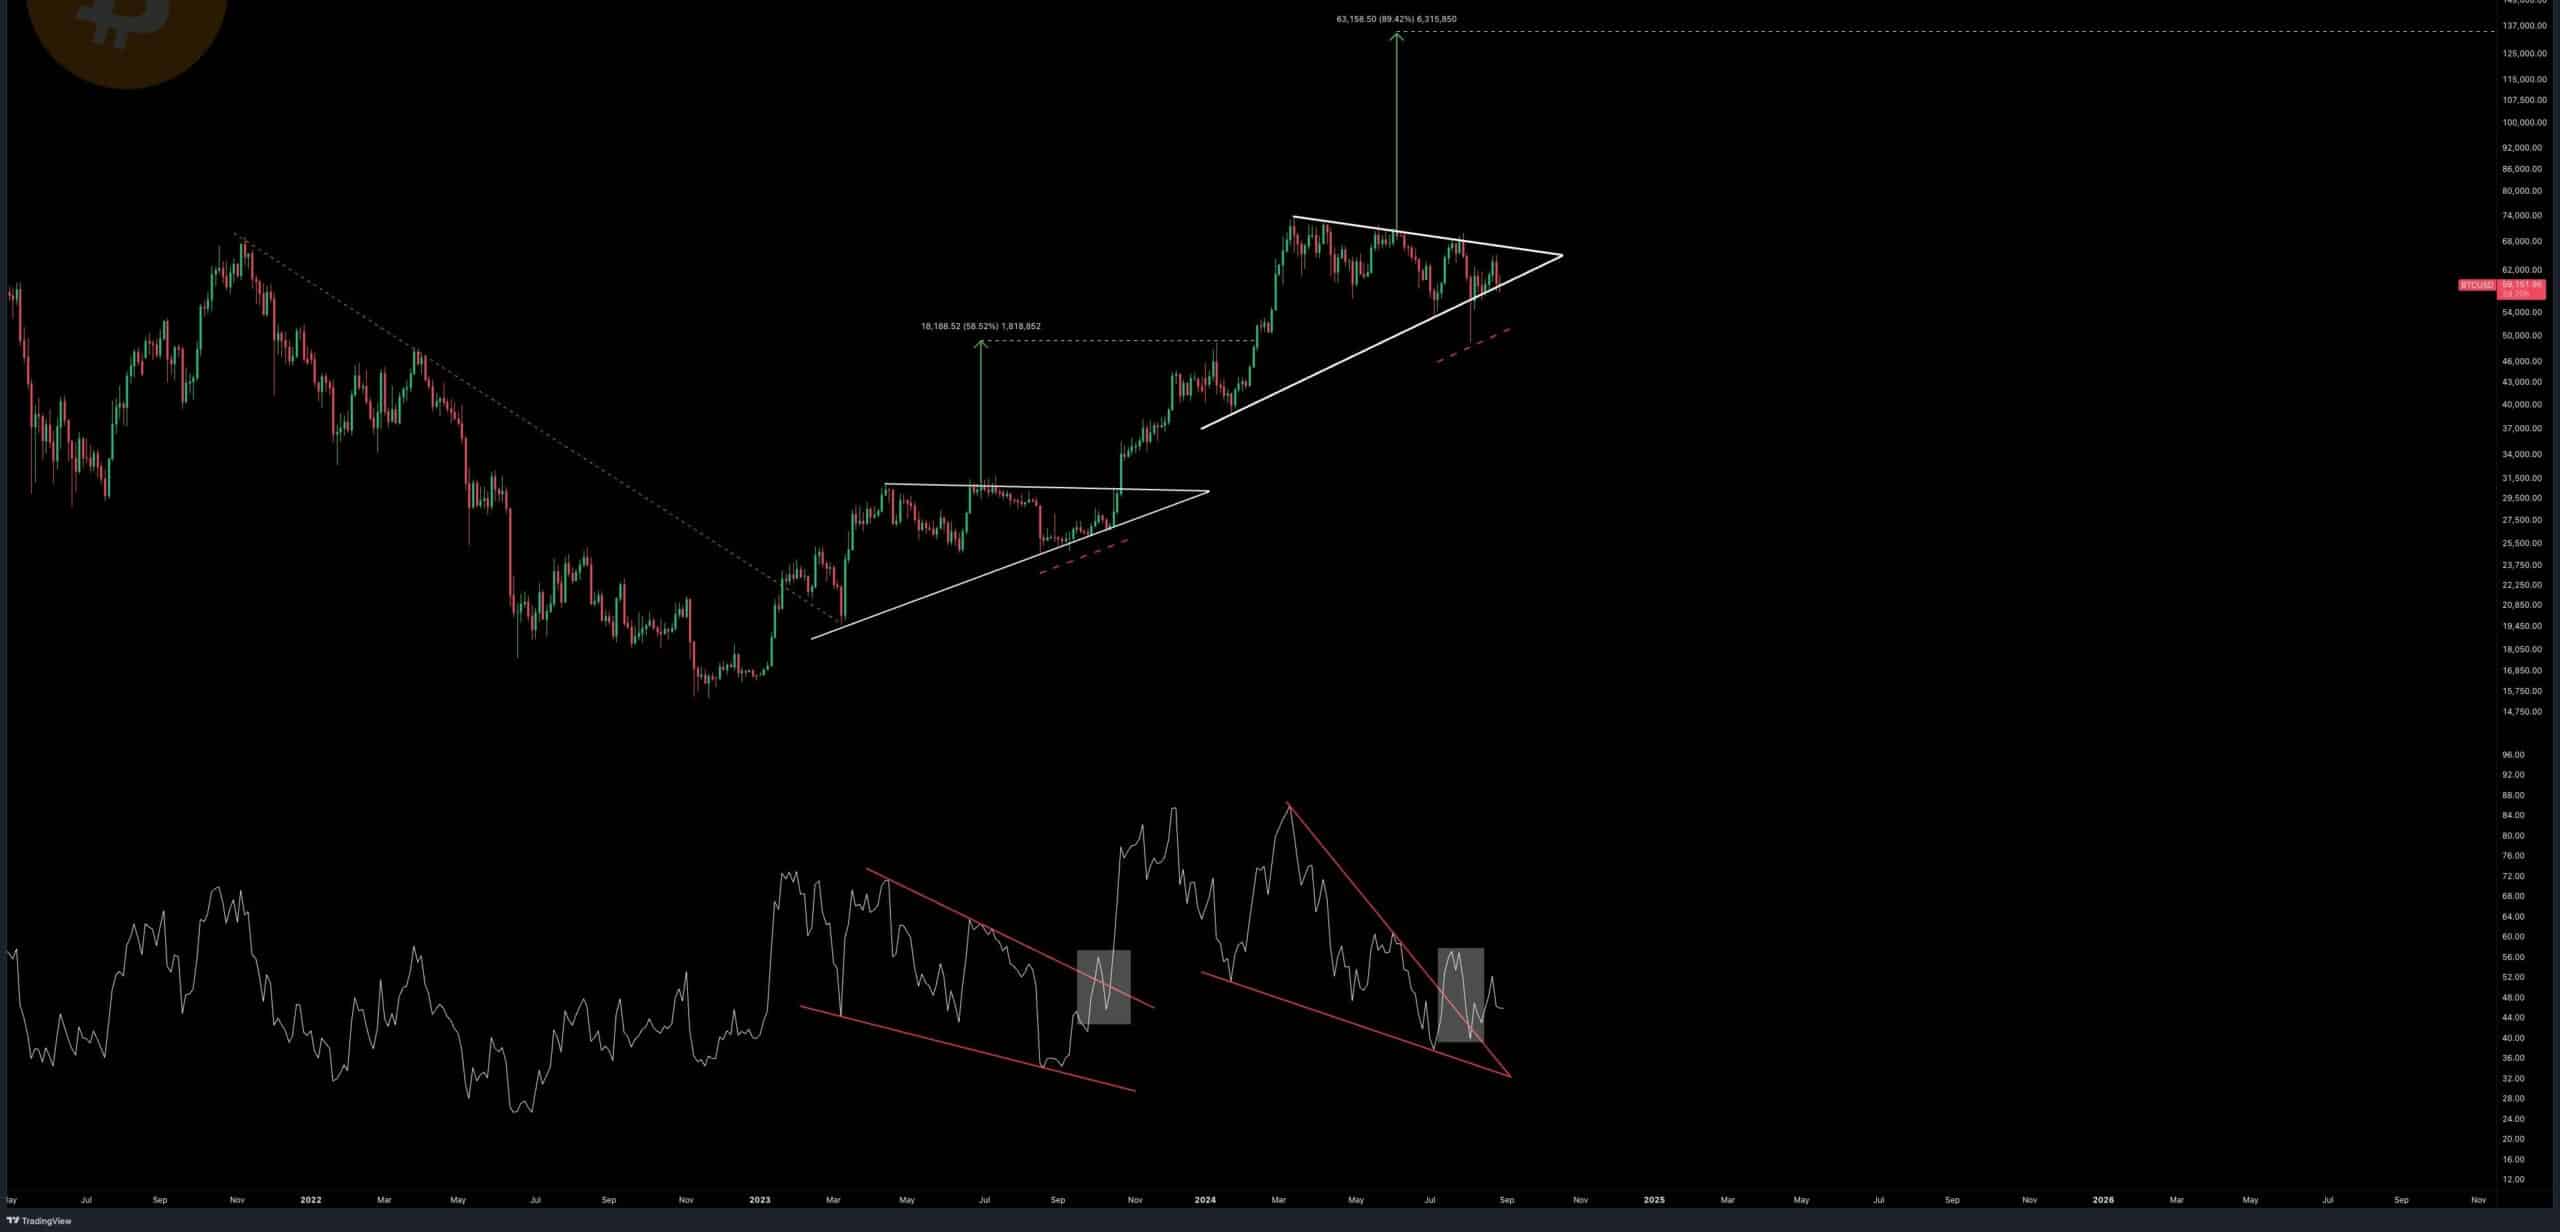
Source: TradingView
History of last quarter’s post-halving
Historically, the last quarter of the year following a Bitcoin [BTC] halving has been bullish. This trend might continue in 2024.
Despite a frustrating and stagnant summer market, Bitcoin investors and traders should remain patient, as the market has a history of rewarding those who hold on during such periods.
This could be an opportune time to accumulate more BTC, anticipating a potential rally in the final quarter of the year.
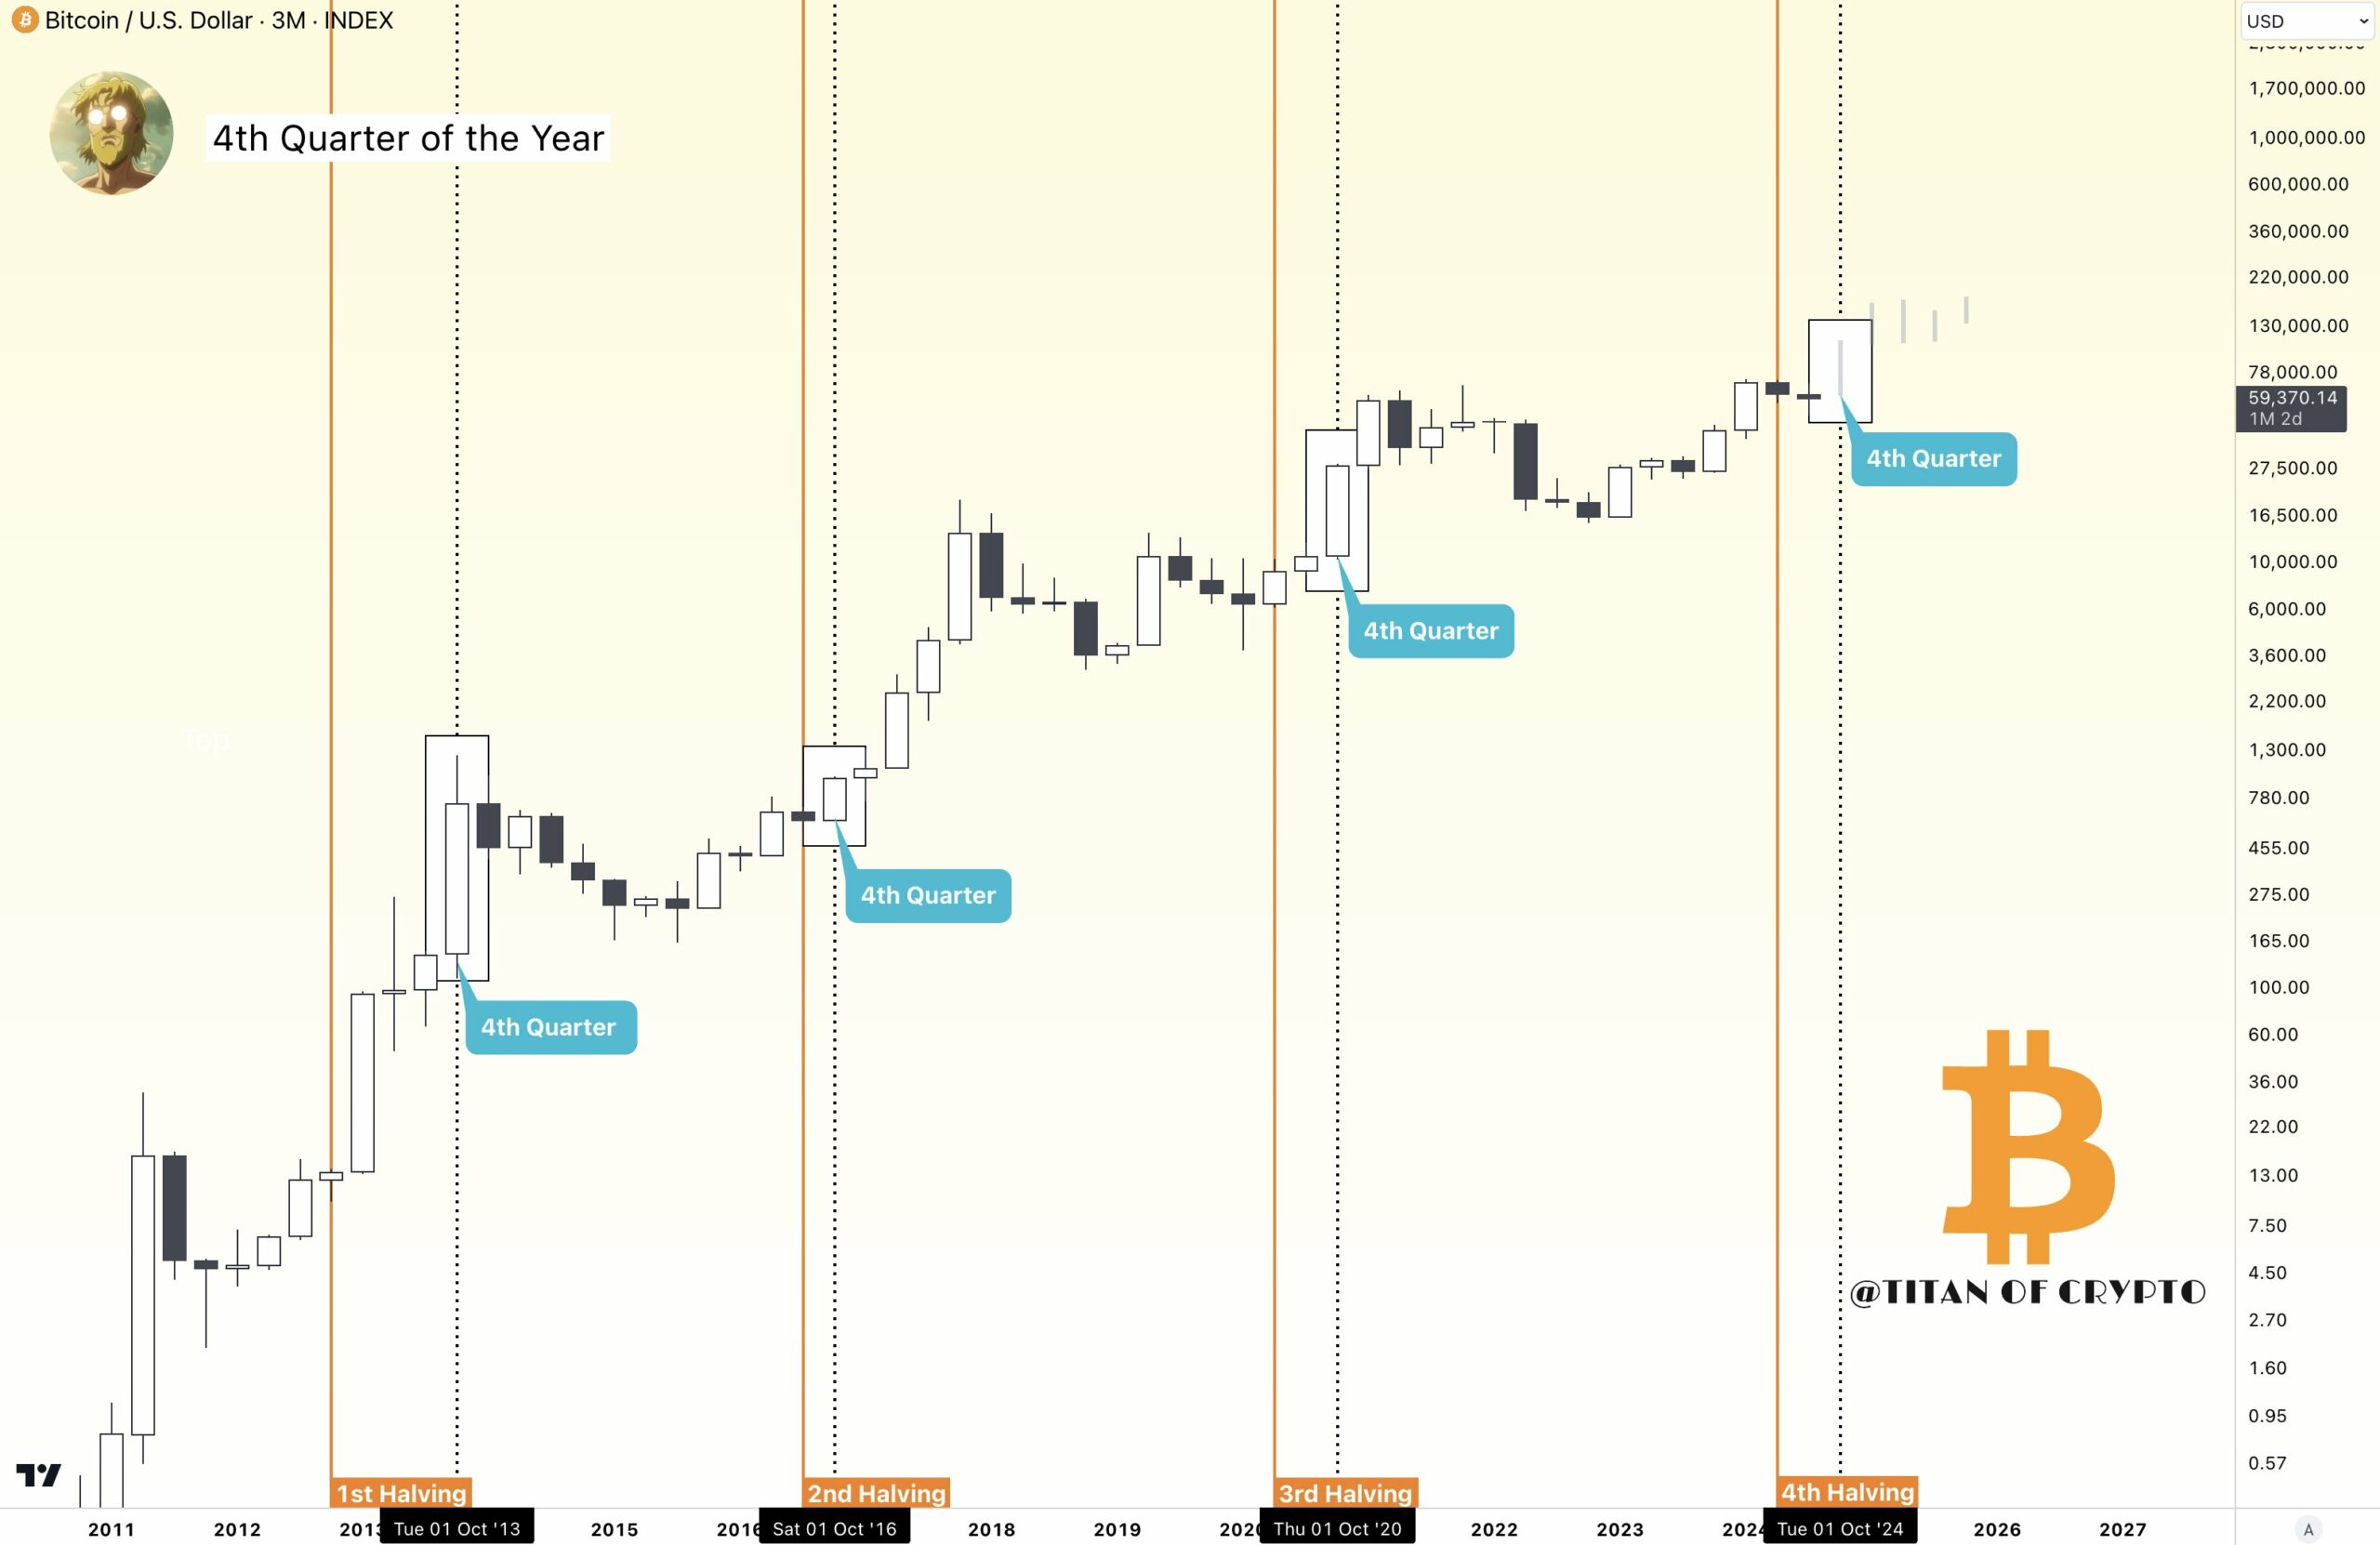
Source: Titan of Crypto/X