


- Bitcoin’s current trend is similar to 2019 where it progressed to highs but eventually reverted to a yearly bottom.
- Search and discussion around BTC continue to increase.
The Bitcoin [BTC] price floated for most of the week but the trend was not without attempts to break the $30,000 barrier of yield to correction. On a few occasions, the king coin tapped a local top of $29,000. However, these periods were met with almost instant rejection.
Is your portfolio green? Check the Bitcoin Profit Calculator
Digging into the old days
Following the events, Santiment pointed out that the current trend echoes a similar pattern to 2019. The on-chain analytic platform based its opinion on the Market Value to Realized Value (MVRV) Long/Short difference.
This phenomenon helps to identify the bottom of a bear cycle and the top of a bull run. At press time, the metric had crossed 0%. Historically, this has repeatedly proven to be the end of a bear cycle, and BTC usually experiences growth once this occurs.
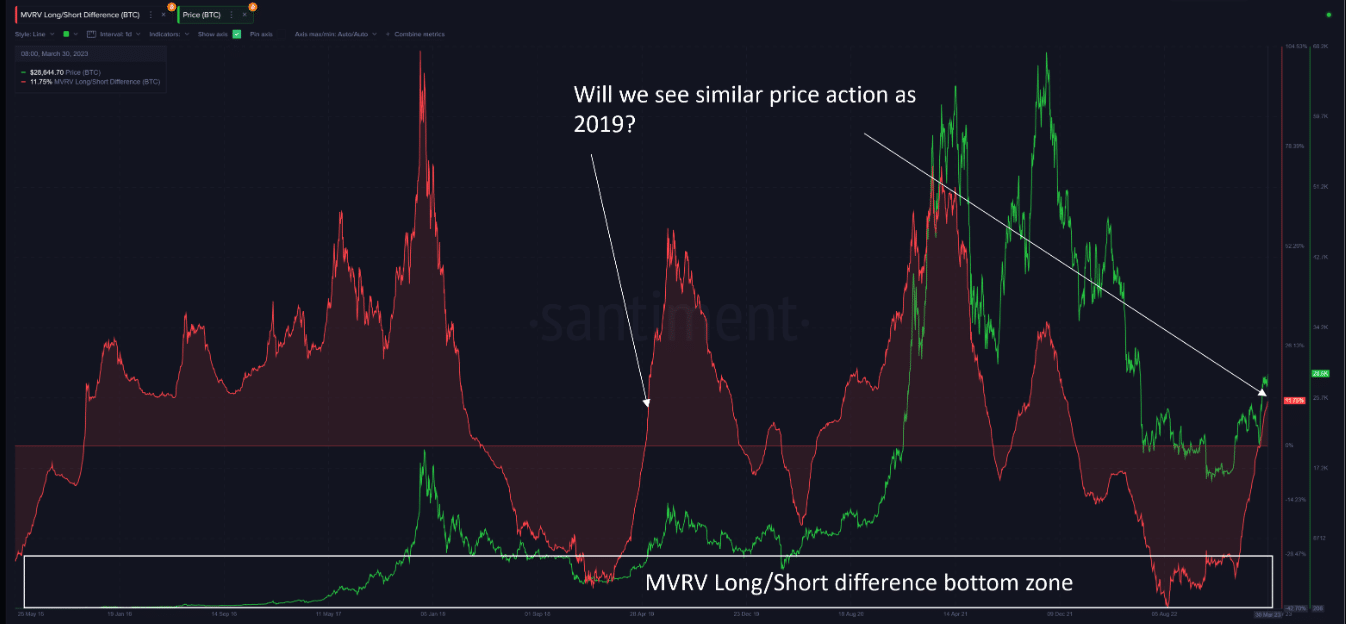
However, the 2019 condition was an exception. At the time, the price action followed the norm to hit highs. But months later, BTC returned to a yearly low as the MVRV L/S difference fell to the negative region.
Still, the macroeconomic condition of the said year and now was not the same. So, there was no solid strength behind the recurrence even though it was not out of possibility. Nonetheless, excitement remained alive in the market as indicated by the social volume and dominance.
Glee in the land
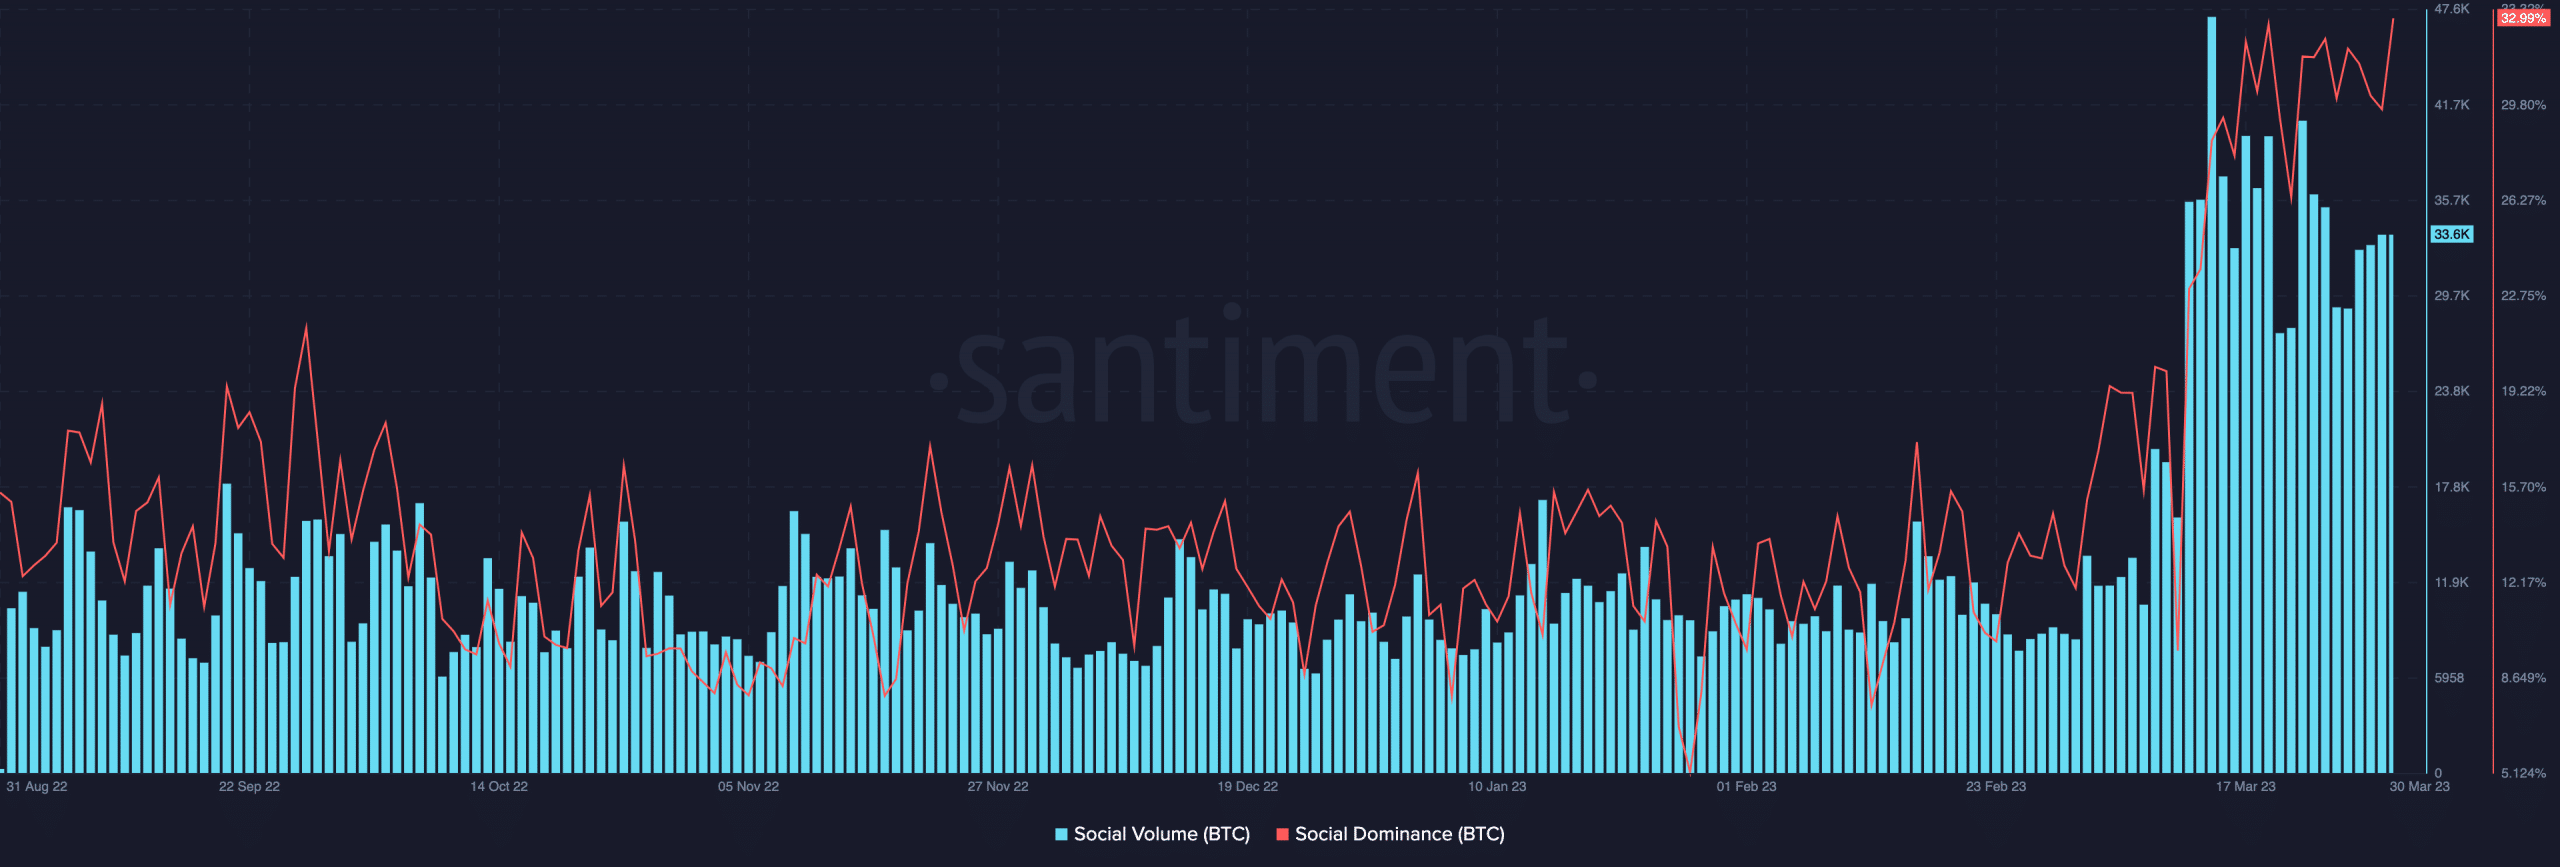
While social dominance measures discussion around an asset, the social volume puts into account the search rate of the same asset. Both of these metrics of BTC reached long-period highs, with the dominance and volume at 32.99% and 33,600 respectively.
Furthermore, several other metrics centered around Bitcoin have been reaching the All-Time High (ATHs). For instance, Glassnode data showed that the percentage supply of the last five years has consistently, reached new ATHs. The recent one was a hike to 28.486%.
📈 #Bitcoin $BTC Percent Supply Last Active 5+ Years just reached an ATH of 28.487%
Previous ATH of 28.486% was observed on 30 March 2023
View metric:https://t.co/90CEGcXoYk pic.twitter.com/jYlhA3494Z
— glassnode alerts (@glassnodealerts) March 31, 2023
This metric measures the percentage of circulating supply that has not moved in five years. Hence, the rise indicates long-term holders’ resolve to stick to their holding irrespective of the bull or bear cycle.
Read Bitcoin’s [BTC] Price Prediction 2023-2024
Meanwhile, BTC has been pretty irrepressible as the crypto community remains ardent for $30,000. However, the coin would need to overcome the resistance that has been prompting the pullbacks.
Whether it archives this or not, would largely depend on investors’ willpower to contribute to selling pressure. However, BTC’S intraday trading price was $28,005 at press time. And further profit-taking action could lead it below the region it had been holding on to.