Bitcoin’s volatility increases in October: The start of something new?
According to a report by crypto trading platform Bitfinex, Bitcoin's historical 24-hour volatility has spiked since the start of October.

- Bitcoin was more volatile since the start of October than it had been in the past 200 days.
- The king coin decoupled from the equities market.
Bitcoin’s [BTC] volatility has been a hot subject of discussion in 2023. With values plummeting to historically low levels, a dramatic shift in investors’ sentiment has been observed for an asset that was known outside crypto circles for its wild swings.
Is your portfolio green? Check out the BTC Profit Calculator
The last month of September proved to be no exception, as the king coin remained suppressed throughout the period.
Volatility spike in October
However, things changed quite dramatically since the onset of October. According to a report by crypto trading platform Bitfinex, Bitcoin’s historical 24-hour volatility more than quadrupled on 2 October.
In fact, as indicated below, the daily historical volatility held above a 200-day exponential moving average. This basically meant that the king coin has been more volatile since the start of October than it had been in the past 200 days.

Interestingly, the implied or forward-looking volatility was higher than the historical volatility. At the time the report was published, the implied volatility was found to be 37.8% while the historical volatility stood at 32.4%
For the uninitiated, historical volatility reflects the past price movements of a particular asset, while implied volatility gauges future expectations of price movements based on the prices of options contracts.
Drawing from this, Bitfinex analysts predicted that the current trend of increased volatility would last throughout October.

Bitcoin and stocks move in opposite directions
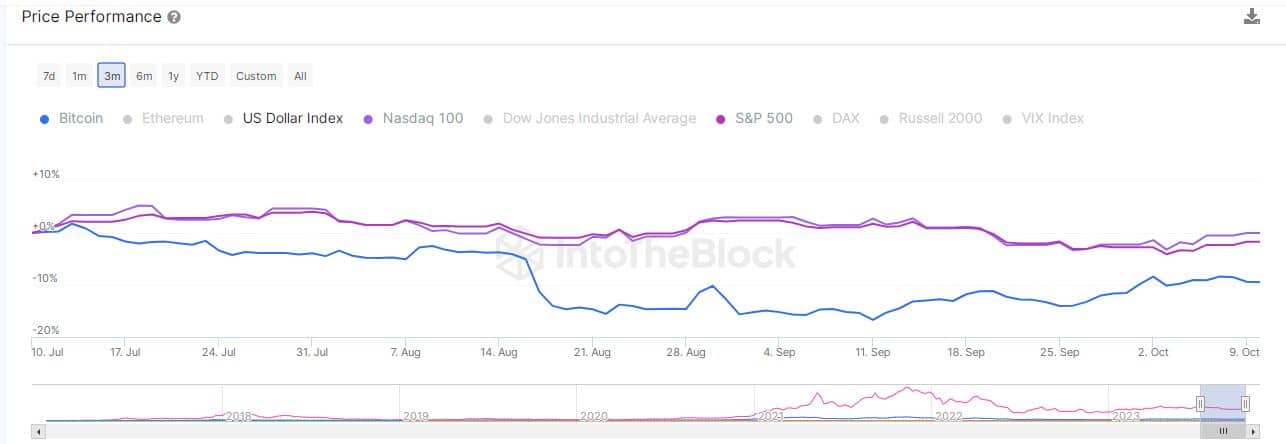
Another notable aspect of Bitcoin’s price movement in October was its decoupling from the equities market.
According to IntoTheBlock, the 30-day correlation coefficient between Bitcoin and major stock indices like the Nasdaq 100 and S&P 500 dropped to -0.3 and -0.5. Put simply, the stock market and the Bitcoin market moved in opposite directions.

These findings were aptly reflected in the price trajectory of the assets in the question. For much of the last two months, Bitcoin experienced more pronounced drops as compared to the U.S. stock market.
Read Bitcoin’s [BTC] Price Prediction 2023-24
Moreover, BTC hit the bottom of its range earlier than the S&P 500 index. Historically, the two financial instruments moved in the same wavelength.
At the time of writing, Bitcoin exchanged hands at $27,591, up 0.5% in the last 24 hours, data from CoinMarketCap showed. The world’s largest asset by market cap recorded a jump of 16.41% in its 24-hour trading volume.


