Analysis

Bittensor [TAO] crypto looks to reach $240, but will bears take control?
Posted:
Journalist

- TAO has the potential to bounce to $240, but is unlikely to go any higher.
- The CMF disagreed with the other technical indicators and suggested bulls have the upper hand now.
Bittensor [TAO] fell below the $216 level on the 6th of April, and reached $167 on the 7th of April. Since then, it bounced nearly 30% to retest $216 — a key horizontal level in the past month.

Source: TAO/USDT on TradingView
The 1-day chart of Bittensor showed that the downtrend has been in play since the final week of January. That was when the $416 level, the previous swing low, was broken.
In subsequent weeks, the $434-$450 region was changed from support to resistance. This was evident toward the end of February.
Over the past six weeks, the OBV has been in a steady decline as TAO prices slumped from $470 to $180. In recent days, the $216 level was also flipped from support to resistance.
Further losses were expected, and a price move toward $140-$150 appeared likely in April.
Surprisingly, while the Bittensor 1-day OBV saw a slight uptick in the past couple of days, the CMF surged higher over the past week by a considerably larger margin.
At press time, it was at +0.05, a level that some analysts use to denote sizable capital inflows.
While the buying pressure saw a noticeable increase on the CMF, the market structure and momentum were bearish.
TAO was trading below its 20-day moving average (blue) and the Bollinger Bands showed volatility was rising, and more losses were likely since the price gravitated toward the lower band.
How traders can position themselves
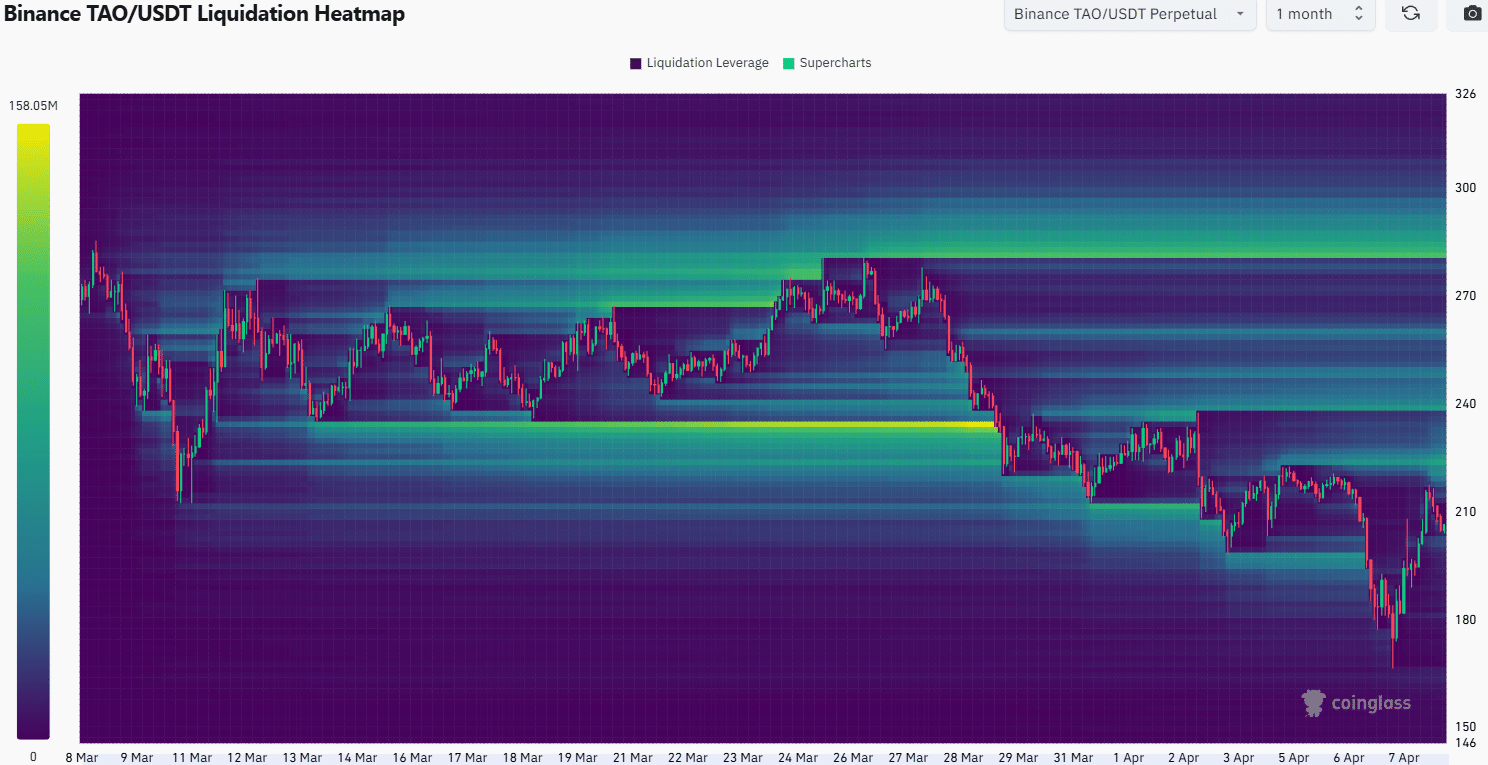
Source: Coinglass
The 1-month liquidation heatmap showed a collection of liquidity at $240 and also at $220. Hence, these levels were the short-term price targets as they are notable magnetic zones close to the price.

Source: Coinglass
Zooming into the 1-week liquidation heatmap, the $220 map popped out much more sharply.
The liquidity cluster in this region was sizable over the past week, once again underlining the high likelihood that TAO prices will drift higher to sweep the $220 area.
Once this occurs, a bearish reversal would become a feasible possibility. It was more difficult to be certain if $220 would see a bearish reversal or whether TAO could climb to $240. Traders should be prepared for both possibilities.
Alternatively, if the momentum shifts and TAO climbs above $240, traders should be even more cautious, as it would make a $280-$300 price bounce likely. Until $240 is flipped to support in the short term, traders can remain bearishly biased.
Disclaimer: The information presented does not constitute financial, investment, trading, or other types of advice and is solely the writer’s opinion