
FLOKI’s next move hinges on THIS bearish pattern – Here’s what to watch

- BNB’s price declined by more than 10% in the last seven days.
- A few metrics hinted at a trend reversal.
Binance Coin [BNB] bears dominated in the last week as the coin’s price dropped by double digits. However, BNB was testing a crucial resistance level at press time. A breakout above could result in a bull rally.
Let’s take a closer look at what’s going on.
BNB tests a crucial resistance
CoinMarketCap’s data revealed that BNB’s price had dropped by more than 10% in the last seven days. The declining trend continued in the last 24 hours as the coin’s moved down marginally.
At the time of writing, BNB was trading at $604 with a market capitalization of over $89 billion.
The declining price action made BNB a topic of discussion in the crypto space, which was evident from the rise in its social volume.
But its Weighted Sentiment dropped sharply, meaning that bearish sentiment around the coin was dominant in the market.
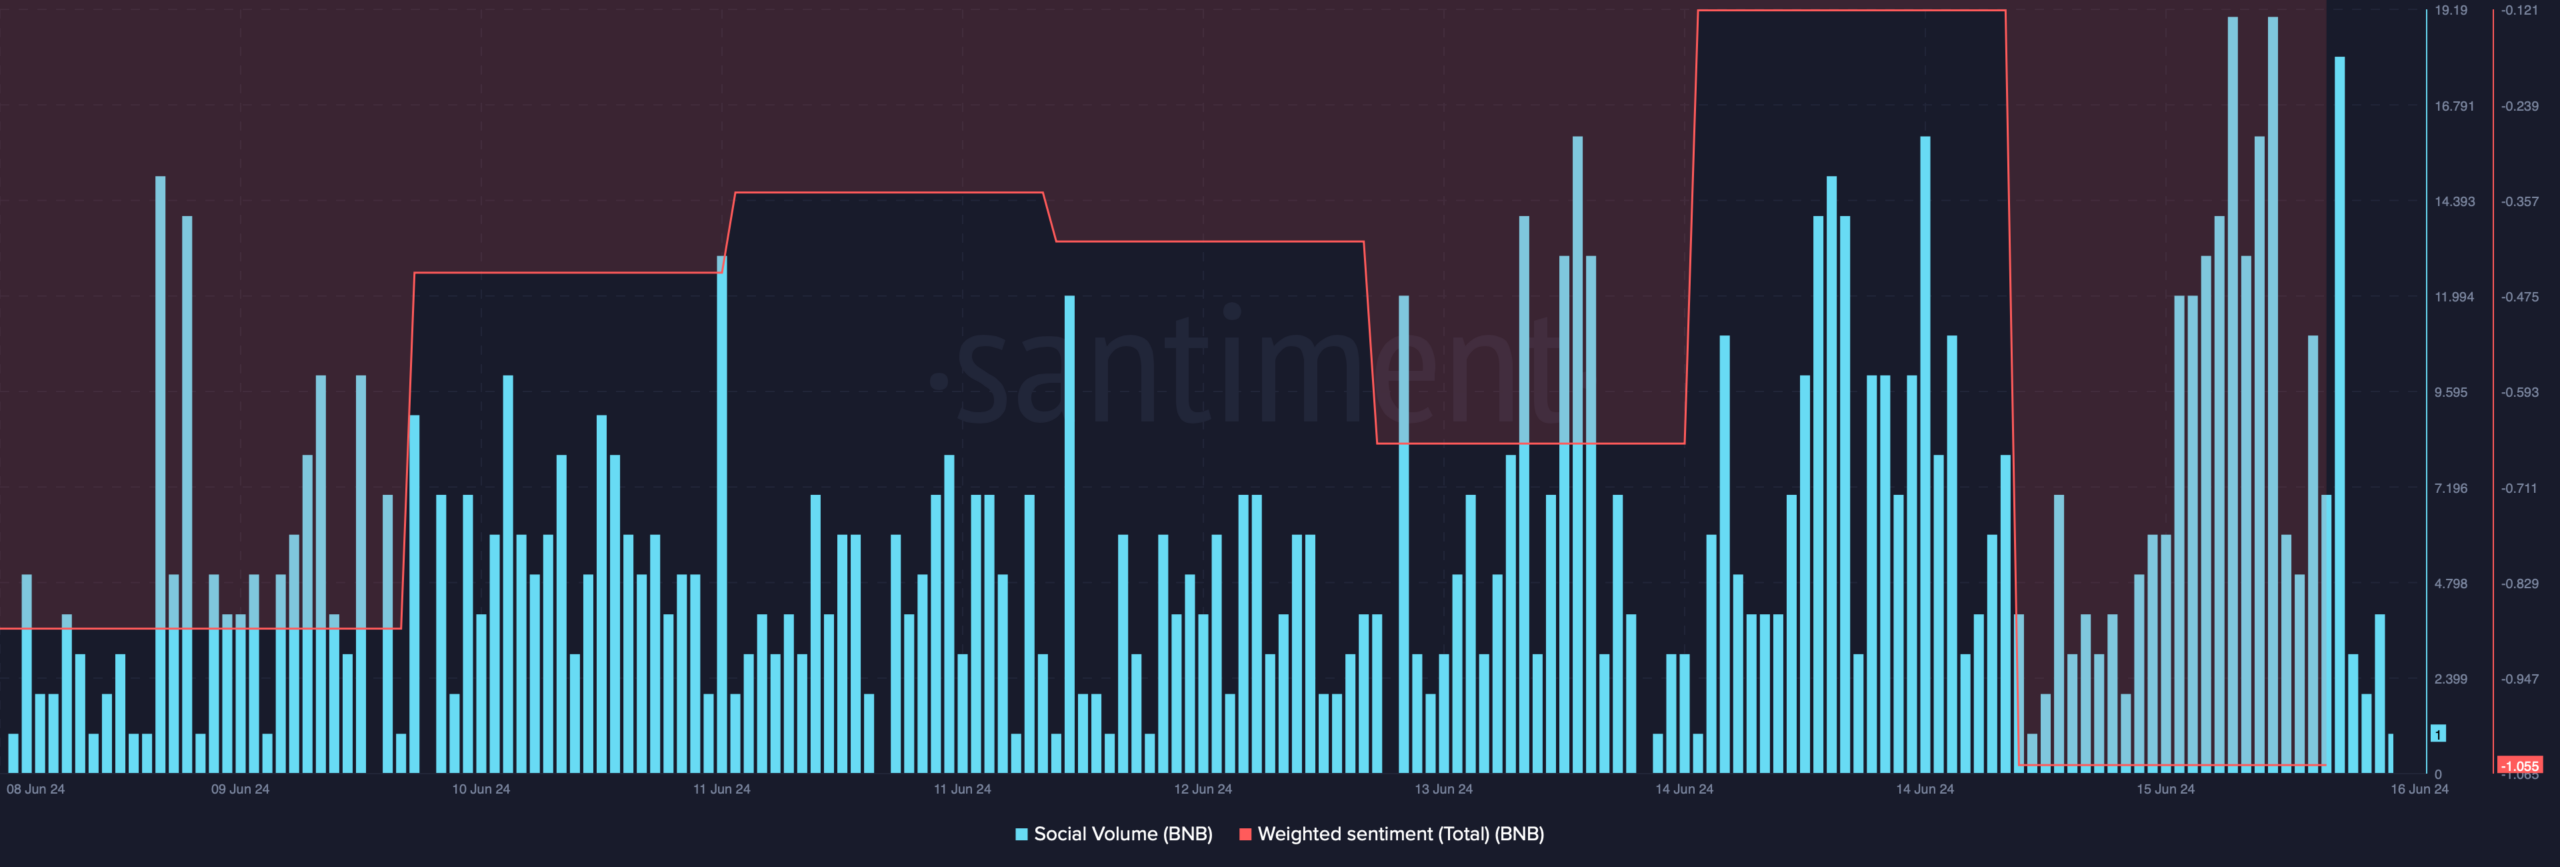
Source: Santiment
However, things can take a U-turn in the coming days as the coin is testing a crucial resistance level.
AMBCrypto’s analysis of BNB’s daily chart revealed that the coin was testing its 50-day Exponential Moving Average (EMA). Generally, the 50-day EMA acts as a support and resistance level.
Therefore, a breakout above that level usually results in a bull rally.
On this occasion, if BNB manages to break out, then investors might witness a massive price increase. This might allow BNB to reclaim $710 again.
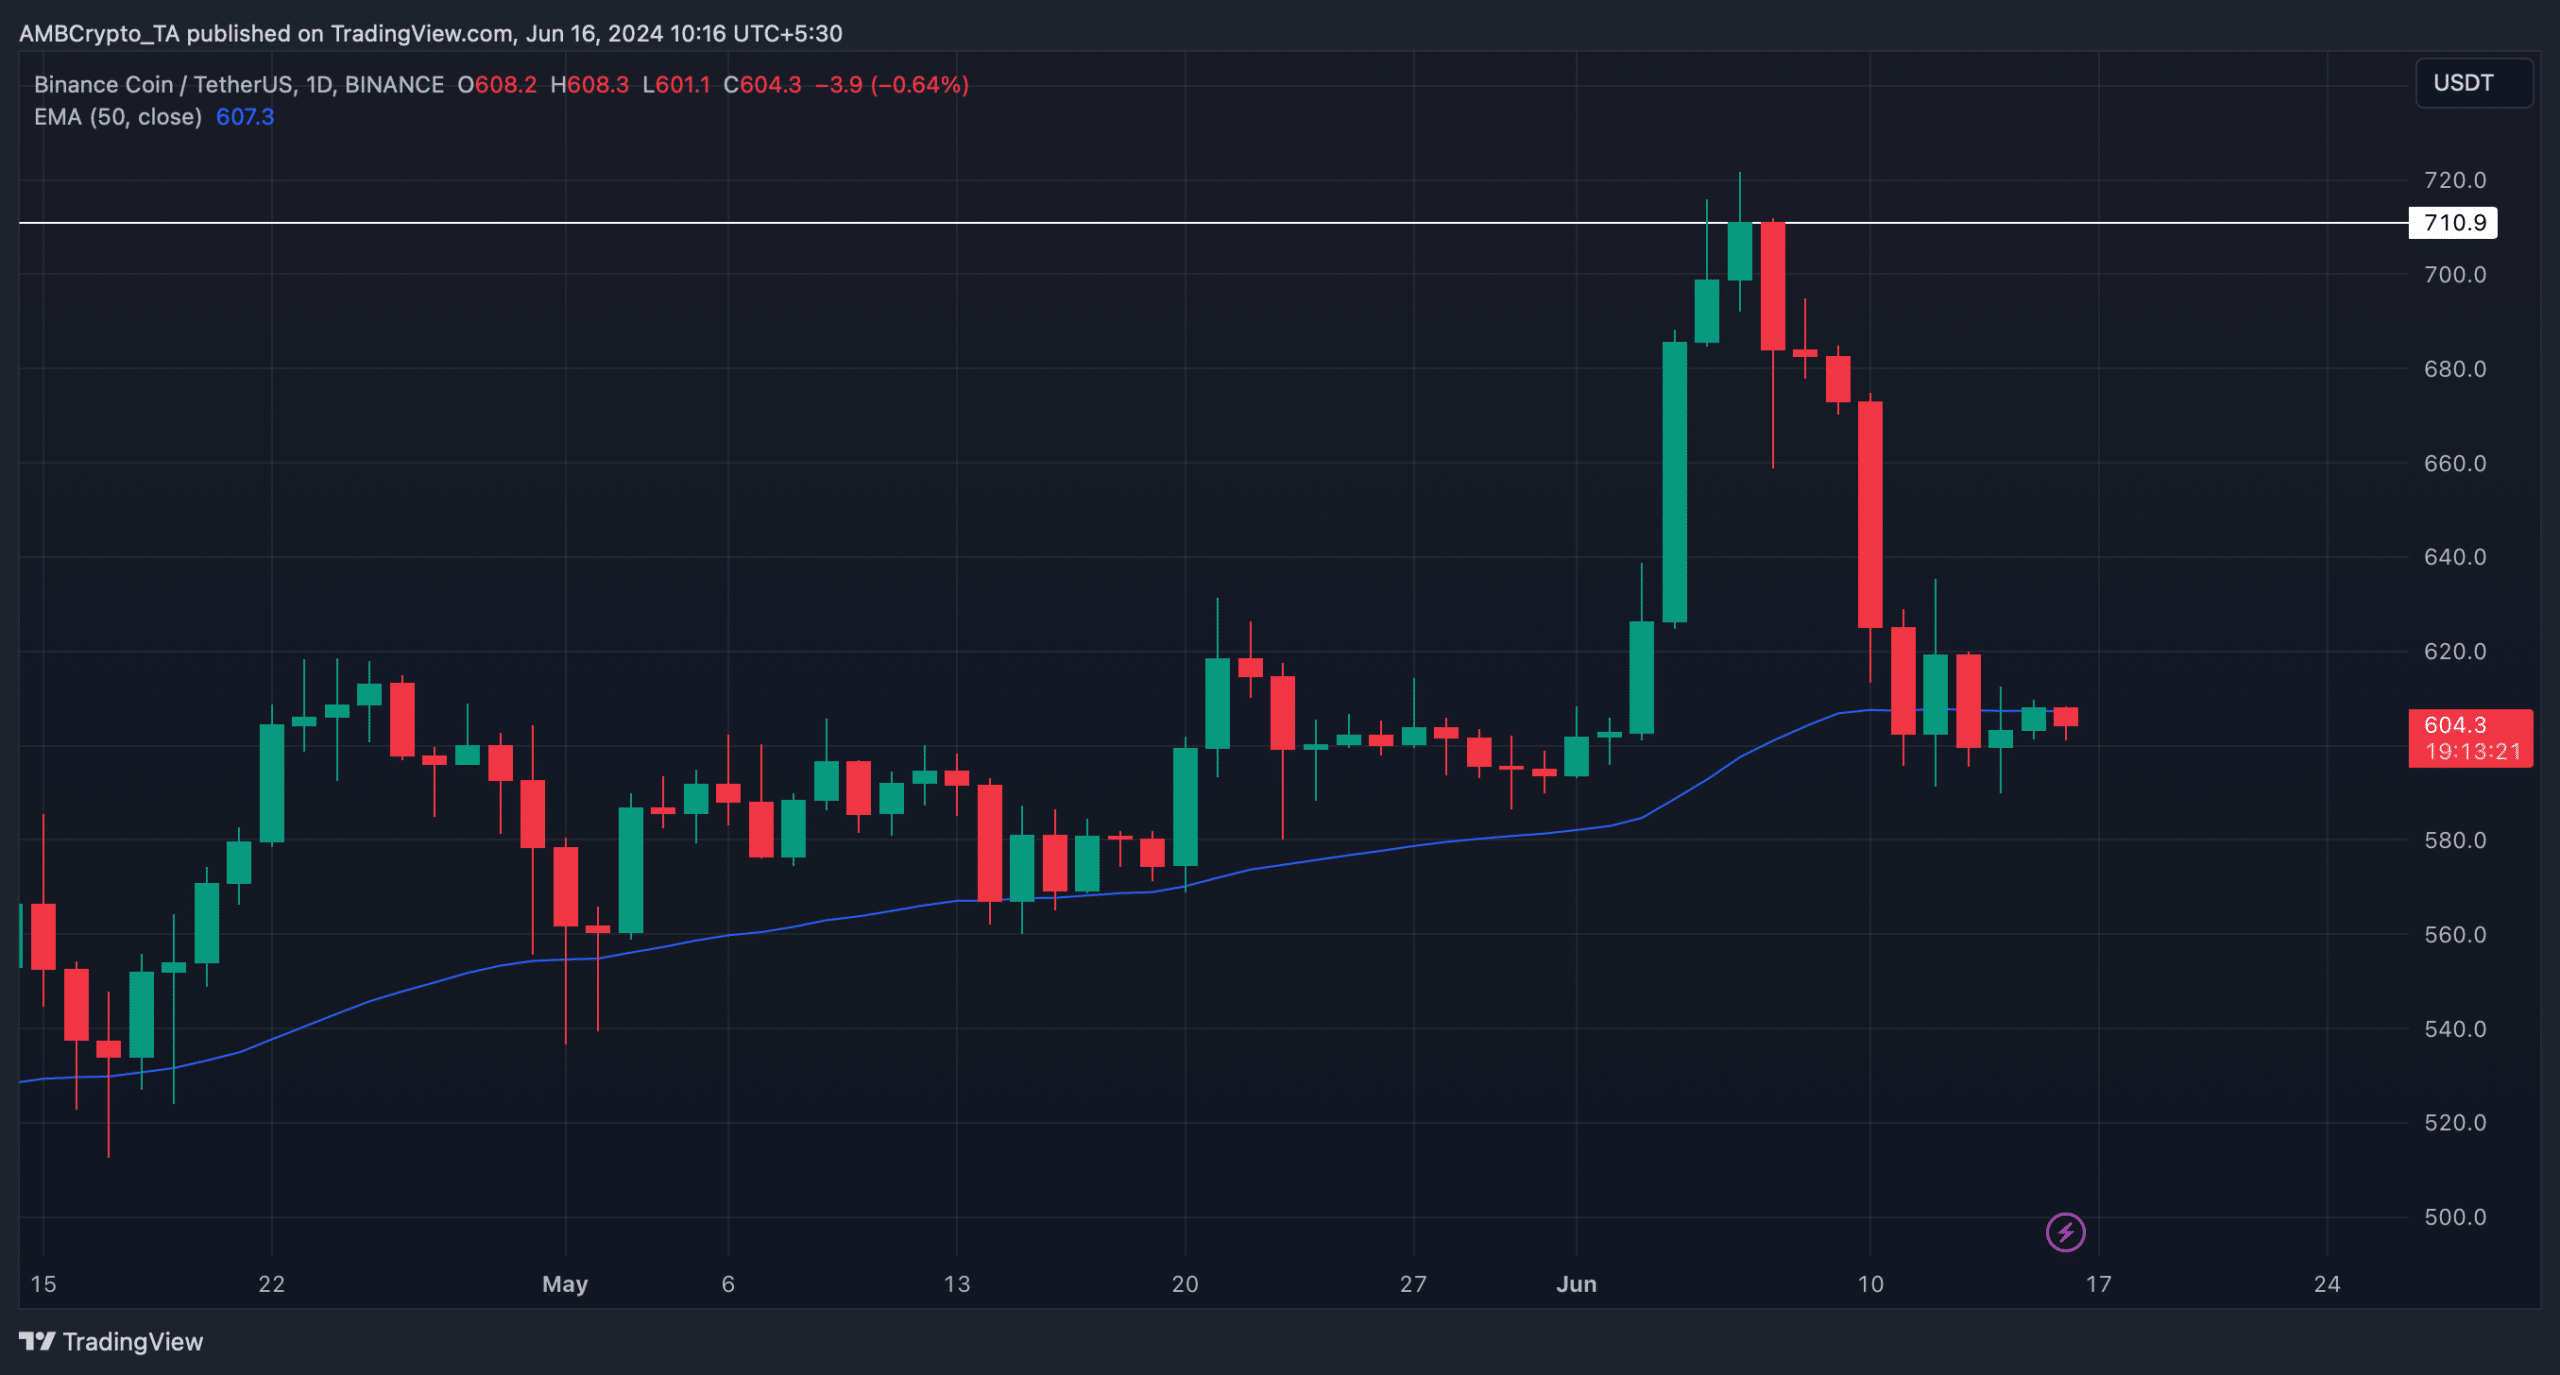
Source: TradingView
Is a bullish breakout possible?
Since there was a chance of a trend reversal, AMBCrypto analyzed Santiment’s data to see whether metrics supported that possibility. We found that BNB’s Open Interest dropped along with its price.
A decline in the metric suggests that the possibility of the ongoing price trend changing is high. Moreover, BNB’s volume also declined, which hinted at a trend reversal soon.
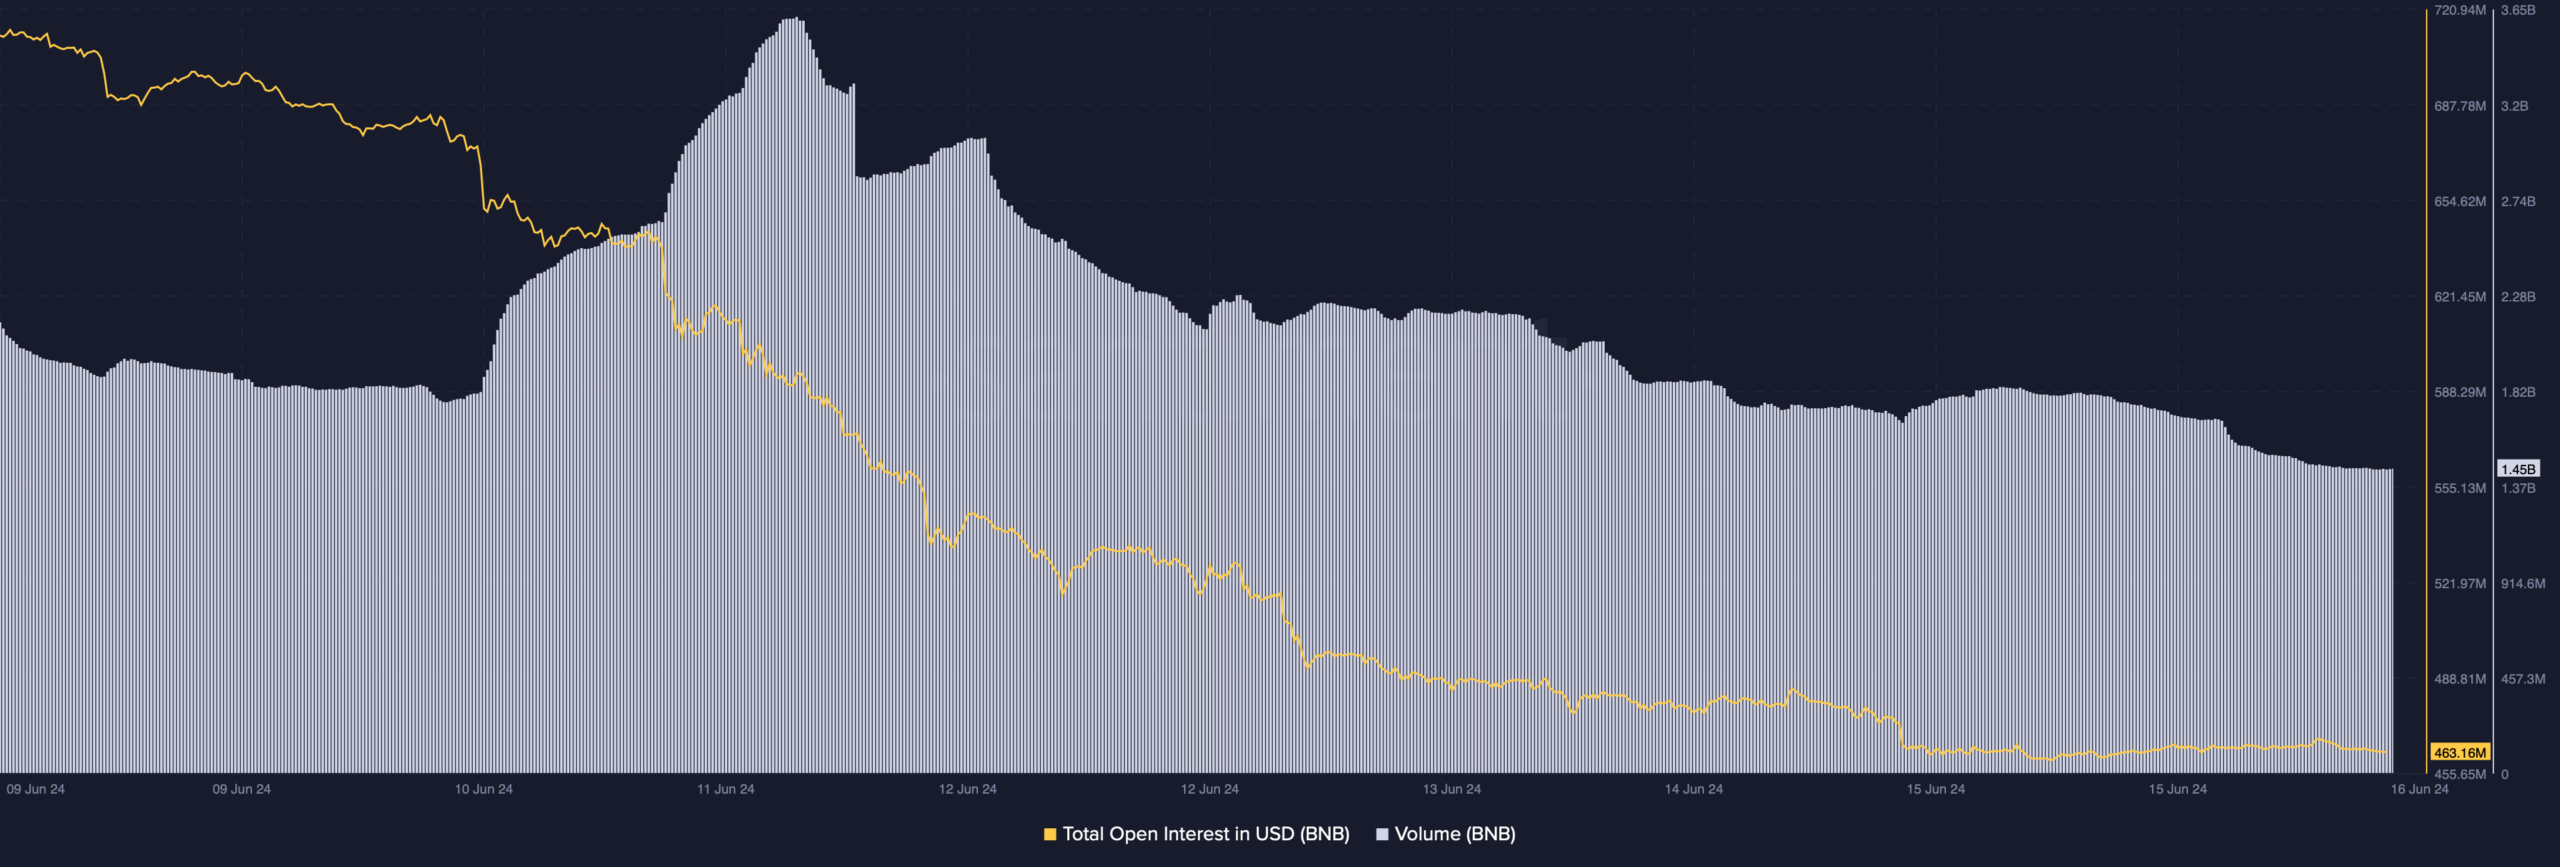
Source: Santiment
Interestingly, the coin’s Chaikin Money Flow (CMF) also registered an uptick and was headed above the neutral mark at press time. This hinted at a possible price increase.
Nonetheless, the rest of the indicators were bearish.
For instance, the MACD displayed a bearish advantage in the market. The Relative Strength Index (RSI) continued to rest under the neutral mark, hinting at a continued price decline.
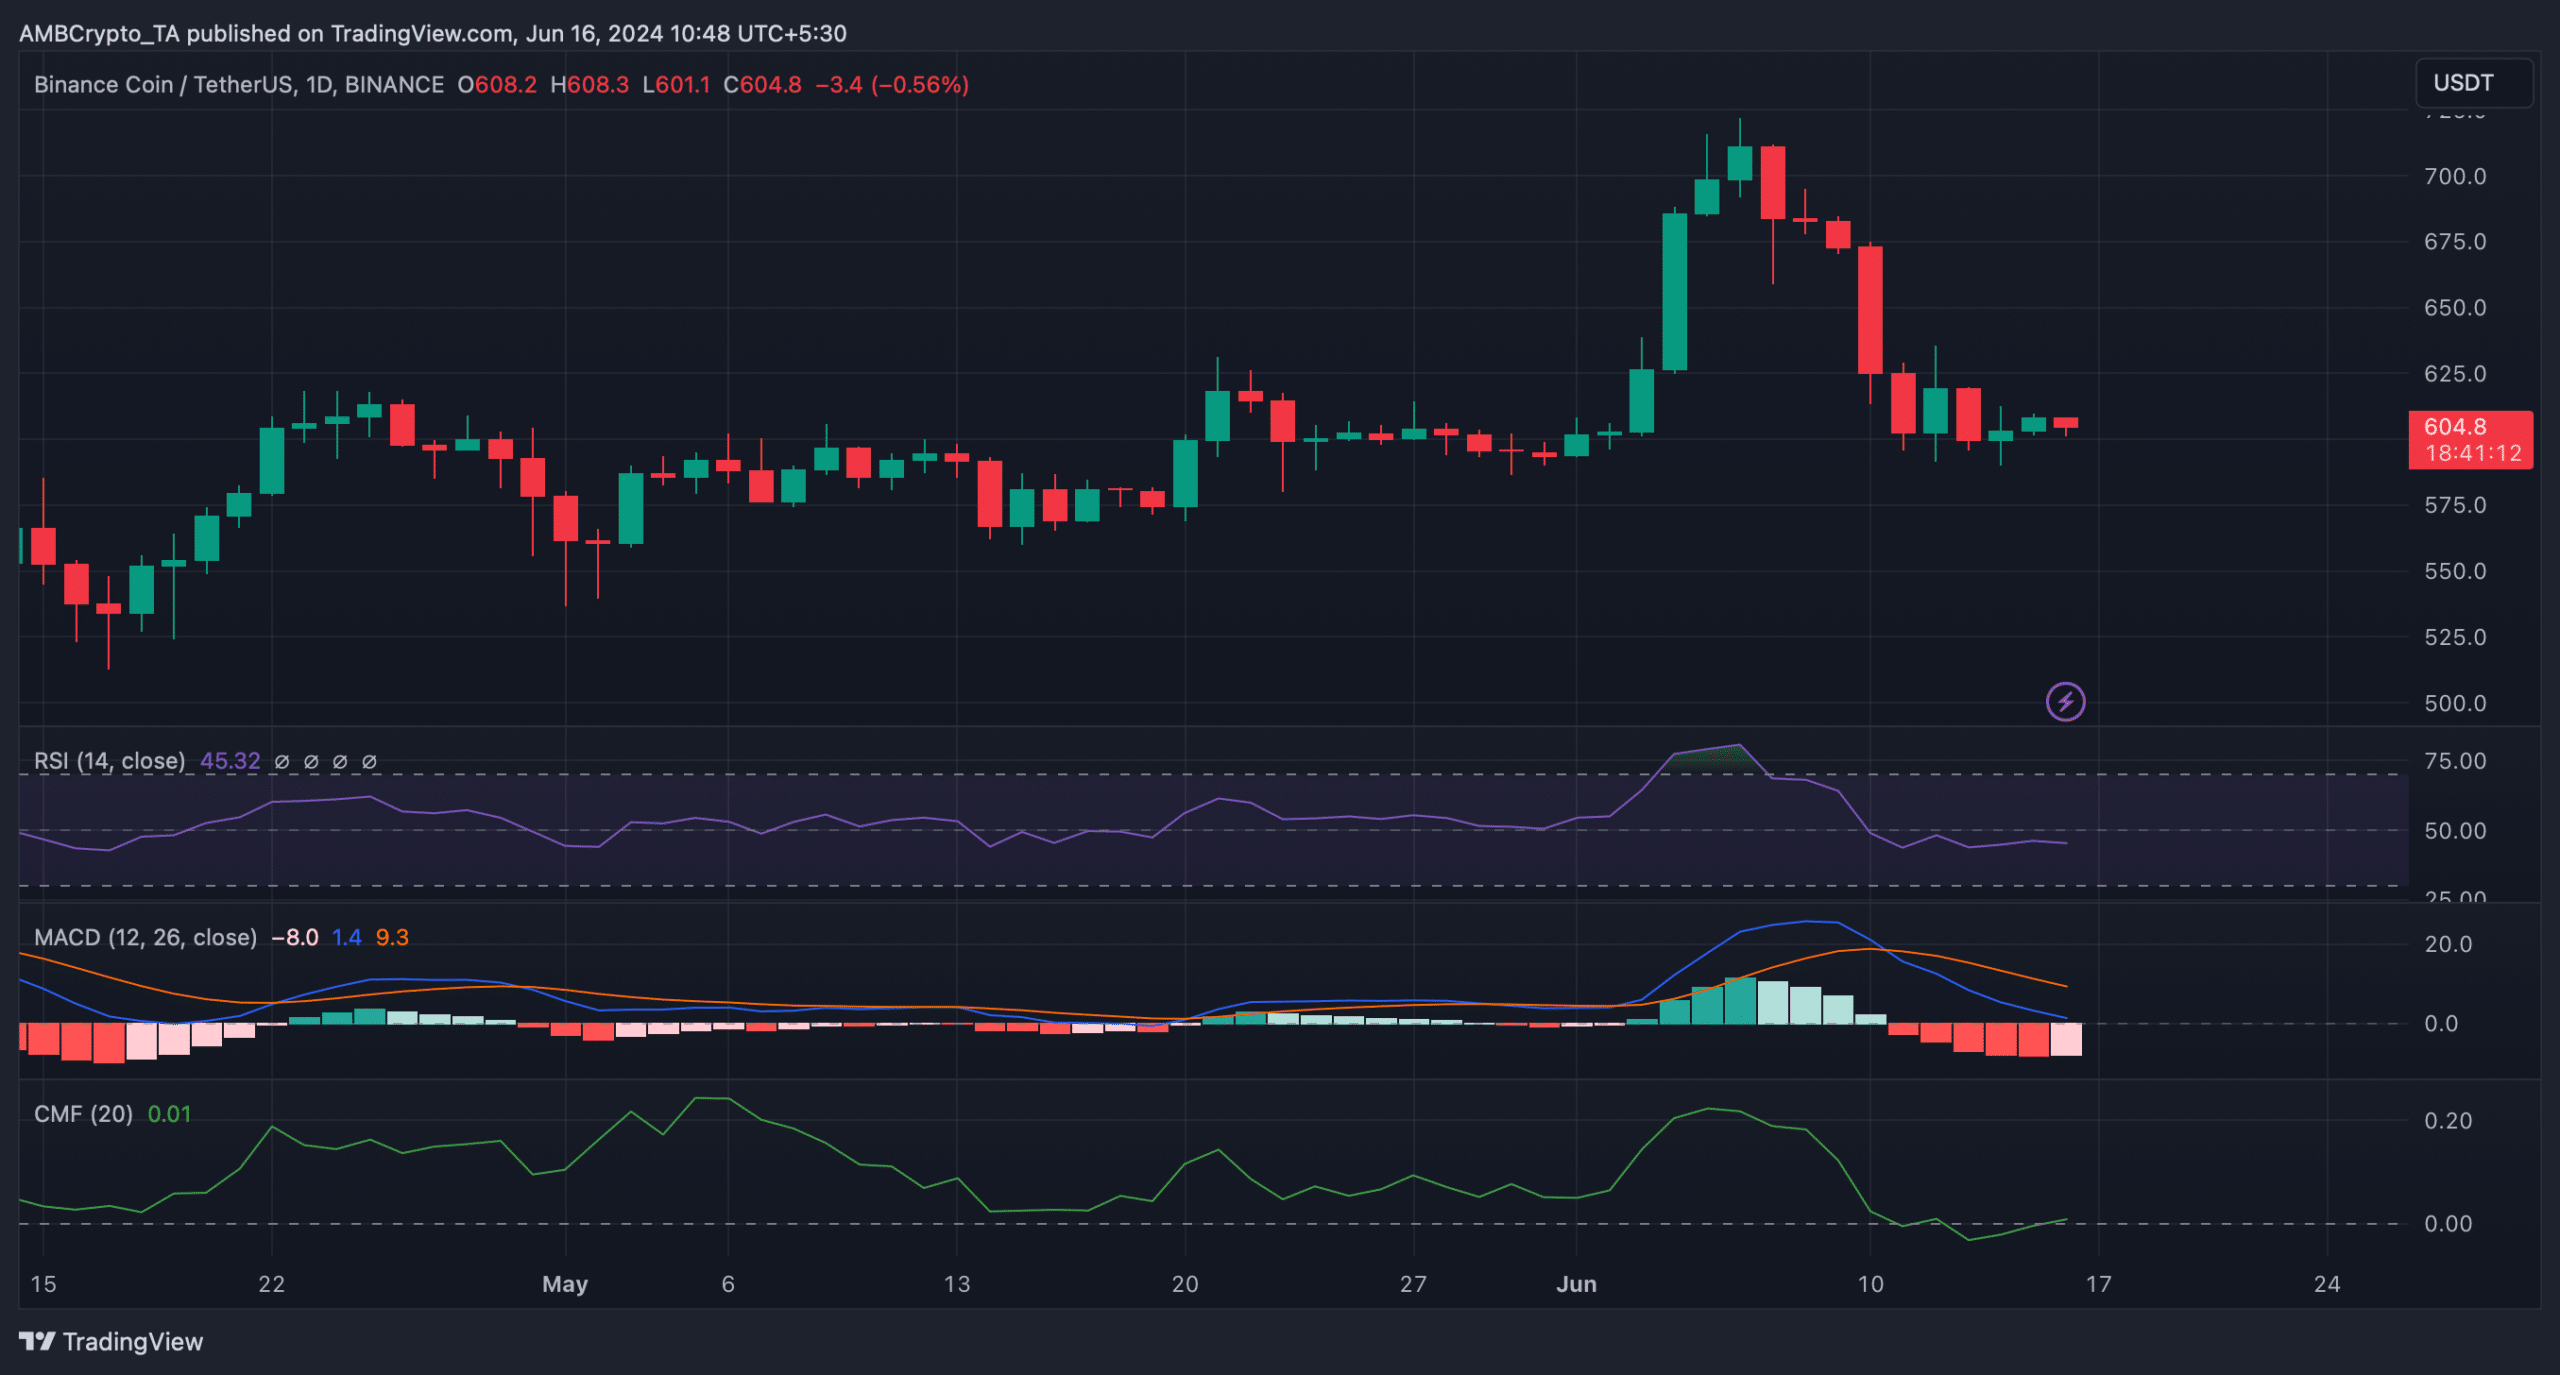
Source: TradingView
Realistic or not, here’s BNB’s market cap in BTC terms
If BNB manages to initiate a bull rally by going above its 50-day EMA, the coin would witness high liquidation near $617. High liquidation often results in short-term price corrections.
A breakout above that level might allow the coin to touch $637 in the upcoming week. However, if the bearish trend lasts, then BNB might drop to $603.

Source: Hyblock Capital


