- More traders have taken short positions in BNB
- BNB, at press time, had declined by over 2% in the last 24 hours
Binance Coin (BNB) has also been affected by the recent decline of the broader cryptocurrency market over the past few weeks. Despite this downturn, however, BNB has managed to maintain a significant market capitalization.
It has stayed ahead of many other assets in terms of market value. And yet, trading activities for BNB have been subdued, as indicated by its low funding rate.
Binance maintains top spot
At the time of writing, Binance Coin (BNB) held a market capitalization of approximately $75.8 billion, making it the third-largest cryptocurrency behind Bitcoin and Ethereum, excluding Tether USDT. This is particularly notable, given the broader market decline over the past seven days.
In fact, according to CoinMarketCap, the top ten cryptocurrencies, including BNB, have all recorded significant declines over the past week, with each asset falling by over 5%. And yet, BNB was able to hold its position on the charts.
A look at the price charts
Binance Coin’s (BNB) daily chart recently flashed a death cross. It is a bearish signal that occurs when a short-term moving average crosses below a long-term moving average.
However, at the time of writing, this death cross was not yet fully pronounced. It first appeared on 30 August when BNB’s price dropped to around $535, following a 0.24% decline.
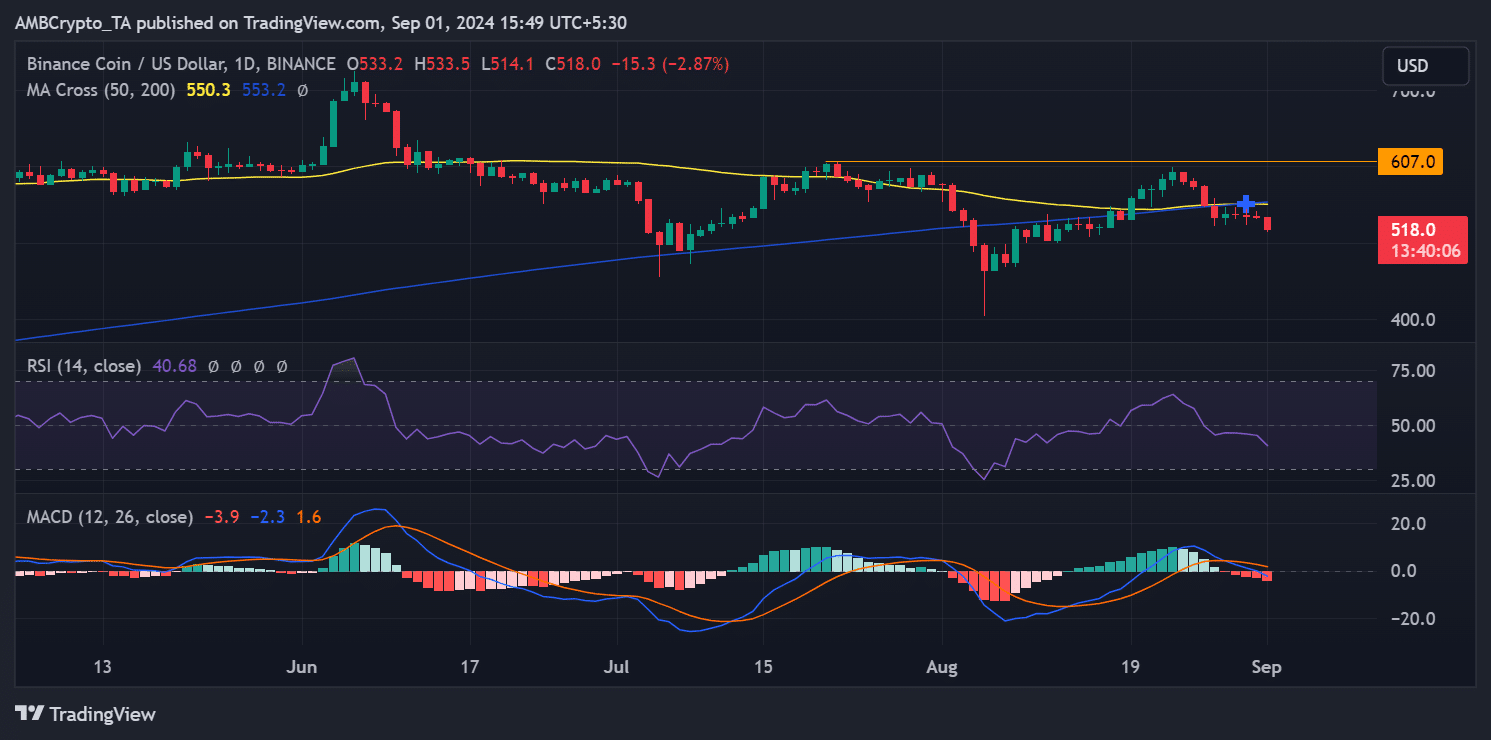
Source: TradingView
Since this death cross first took shape, BNB’s price has continued to decline. At press time, it was trading at approximately $517, following an additional decline of nearly 3%.
The moving averages, which now act as resistance levels, seemed to be positioned around $550. On the contrary, a more significant resistance zone can be found between $590 and $600.
Further analysis using the Relative Strength Index (RSI) and Moving Average Convergence Divergence (MACD) indicators supported the bearish outlook for BNB.
The RSI indicated that BNB has been trending towards oversold territory, reinforcing the altcoin’s downward momentum. Meanwhile, the MACD’s positioning and behavior seemed consistent with a bear trend – A sign that the bearish pressure on BNB could persist.
Sellers take charge of a subdued trade
Finally, an analysis of Binance Coin’s (BNB) funding rate revealed that trading activities have been relatively subdued over the past few weeks, with only a few notable spikes. At press time, the funding rate had dipped slightly below zero to approximately -0.0020%.
– Read Binance (BNB) Price Prediction 2024-25
Here, a negative funding rate suggests that sellers dominate the limited trading volume. In other words, more traders have been taking short positions, anticipating that BNB’s price will continue to fall.
The trend of a negative funding rate generally indicates bearish sentiment in the market as traders expect further price drops. By extension, they are willing to pay to maintain their short positions.