BNB Chain: Impacted by the market downturn, this is how BNB faired in Q3

Leading chain BNB Chain ended October by reaching an important milestone as it clinched an all-time high of 200 million unique addresses on the network. This milestone was reached despite the decline in network usage that plagued the chain in Q3, as reported by Messari in a new report.
BNB Chain registers an industry first, with an incredible 200 Million Unique Addresses 🎉
Community is everything in #Web3. pic.twitter.com/iEM8HHhmPP
— BNB Chain (@BNBCHAIN) October 25, 2022
____________________________________________________________________________________
Here’s AMBCrypto’s price prediction for BNB [BNB] for 2023-2024
____________________________________________________________________________________
In a new report, cryptocurrency research platform Messari assessed BNB Chain’s performance in Q3 2022. Titled “State of BNB Chain Q3 2022,” Messari found that the impact of the bearishness of the general cryptocurrency market on BNB. The bear market of 2022 resulted in a series of declines for BNB Chain.
Let’s have a closer look.
BNB Chain in Q3
Within the three-month period under review, the count of average active daily addresses totaled 889,280. This represented a 15% decline from the 1,042,120 registered as average active daily addresses in Q2. However, Messari opined that despite the decline in the count, daily active addresses on the network stabilized in Q3. This pointed “toward a foundational user base.”

Also witnessing a decline on the network in Q3 was the count of daily transactions completed. As reported by Messari, average daily transactions on BNB Chain in Q3 fell by 27%. In the 90-day period under review, the average daily transactions count stood at 3,396,009. In Q2, this was 4,653,114. The average fees paid to process transactions also fell by 19% in Q3.
The fall in daily transactions and the drop in transaction fees on BNB Chain resulted in a decline in total revenue made by the network within the three-month period. As found by Messari, the total revenue made by BNB Chain in Q3 was $66,832,327. This was a 41% decline from the $113,792,960 made in Q2 and a 62% decline from the $177,142,768 made in Q1.

Interestingly, while the total value locked (TVL) across DeFi platforms within Ethereum failed to see any significant growth in Q3, Messari found that the TVL of the 464 DeFi protocols housed on BNB Chain “grew roughly 11% in USD terms but declined 15% in BNB terms.” According to Messari,
“This difference suggests that the USD price appreciation of BNB drove the increase in TVL and that assets besides BNB were used across DeFi. A significant component contributing to the USD increase in TVL was Wrapped BNB (WBNB) and several liquid staking solutions.”

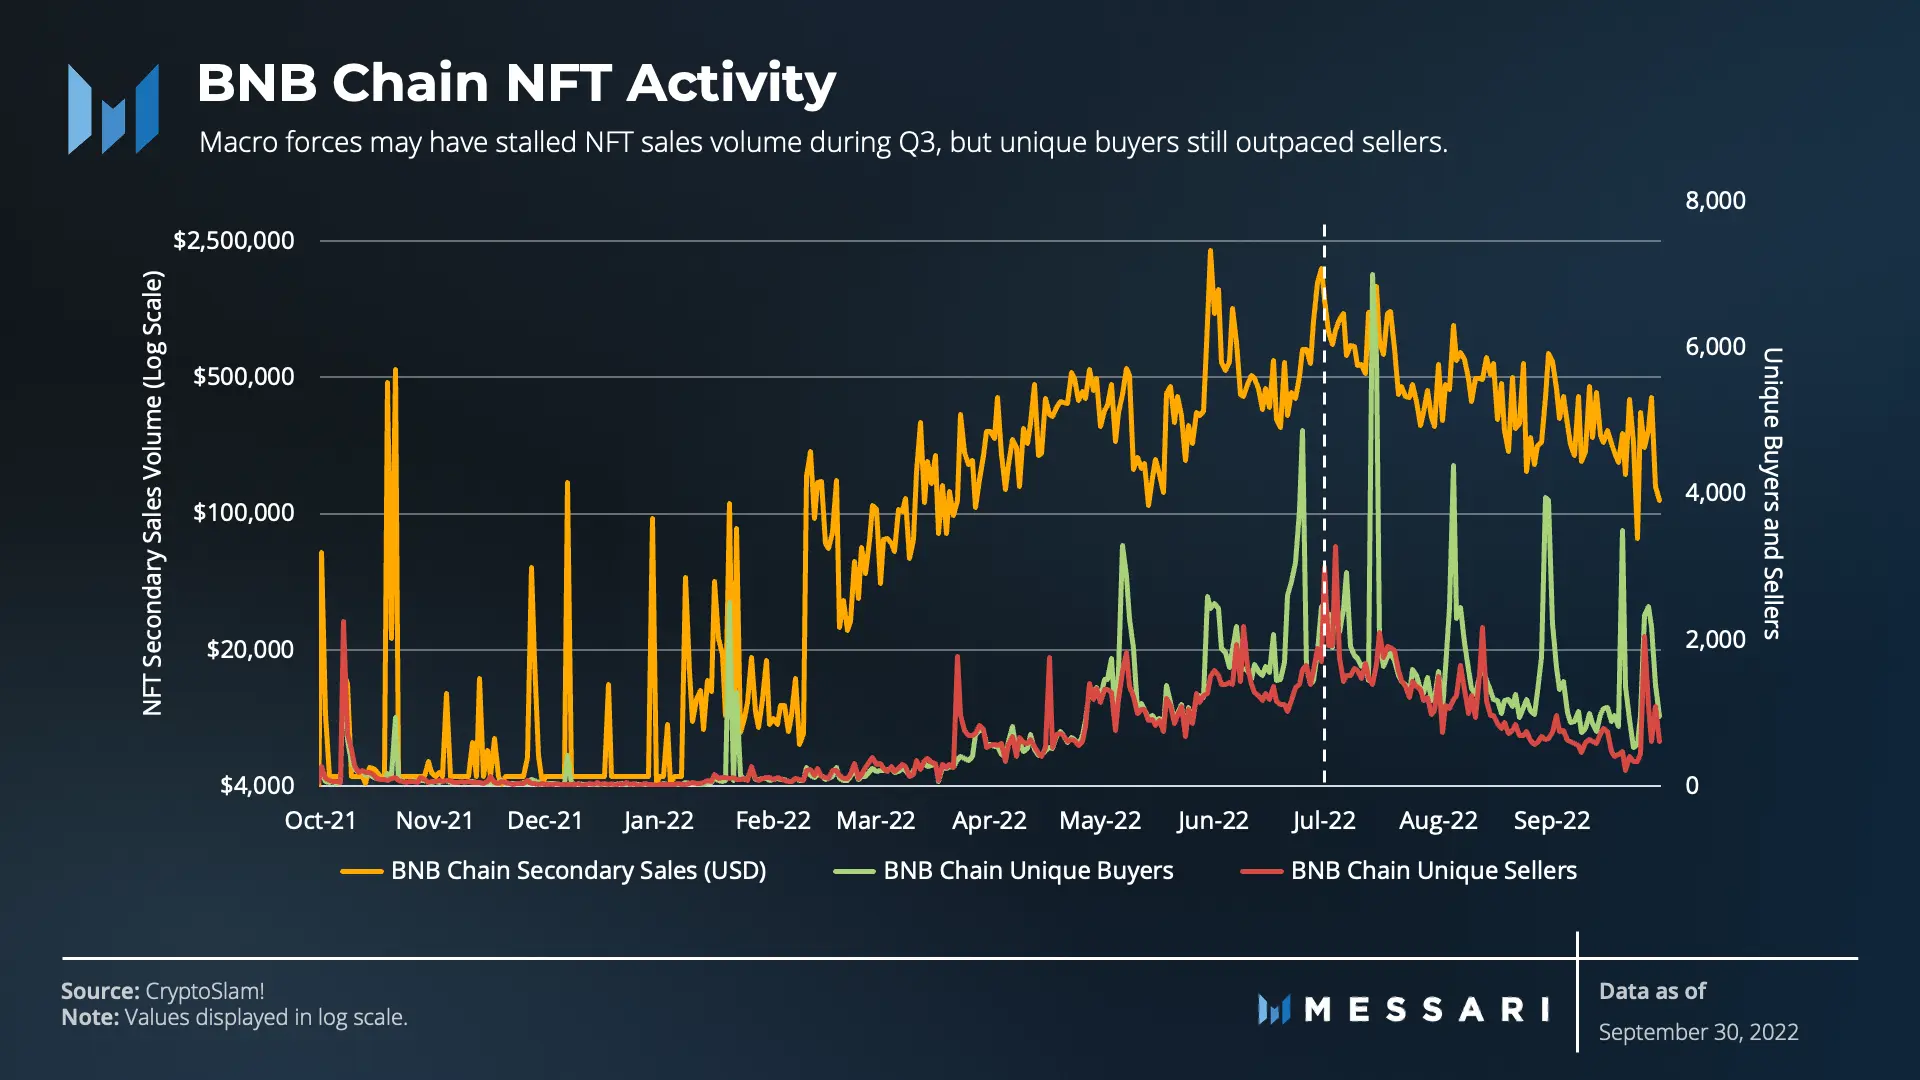
Lastly, as for NFTs on the chain, Messari found that total NFT secondary sales volume increased by 6% in Q3. While noting that macro factors such as tightening financial markets and the general decline in interest in PFP NFTs “may have stalled sales volume during Q3,” Messari noted that unique buyers still outpaced sellers within that period.