BNB Chain’s 70% growth in Q1 means what exactly for Q2?
BNB Chain’s income and market capitalization increased substantially in Q1, but things could change as we enter Q2.

- The total number of BNB holders exceeded 113 billion in Q1.
- BNB Chain’s revenue and fees started to decline in Q2.
The first quarter of 2024 was optimistic for the entire crypto market, as several coins, including BNB, registered massive gains. In its Q1 report, BNB Chain has highlighted the blockchain’s performance on multiple fronts.
BNB’s revenue spiked sharply
Coin98 Analytics, a data analytics platform, posted a tweet highlighting BNB Chain’s key network stats from Q1. As per the report, the blockchain’s income in Q1 showed impressive growth of over 70% compared to the previous quarter.
To be precise, its fees reached $66.8 million, which was a 70% hike over the previous quarter. Thanks to that, the blockchain’s revenue also grew by 77% and touched $6.62 million in Q1.
Things in terms of price action also looked optimistic for BNB, which can be attributed to the bullish market sentiment. The coin’s circulating market capitalization increased by 65% and reached $60 billion in Q1, which was a 30% year-on-year hike.
BNB’s trading volume also increased by 2.3 times QoQ and 2.8 times YoY. Additionally, the token’s total number of holders exceeded 113 billion in Q1, which was an 80.7% YoY hike.
Revenue drops in Q2
Though the aforementioned statistics suggested that BNB Chain ended Q1 on a good note, things started to change in Q2.
AMBCrypto’s analysis of Artemis’ data revealed that during the last seven days, the blockchain’s fees declined. Consequently, its revenue also went down during the same period.

However, despite the drop in captured value, the blockchain’s network activity remained high. This was evident from the fact that both its daily active addresses and transaction graphs gained upward momentum in the last seven days.
BNB bears are here
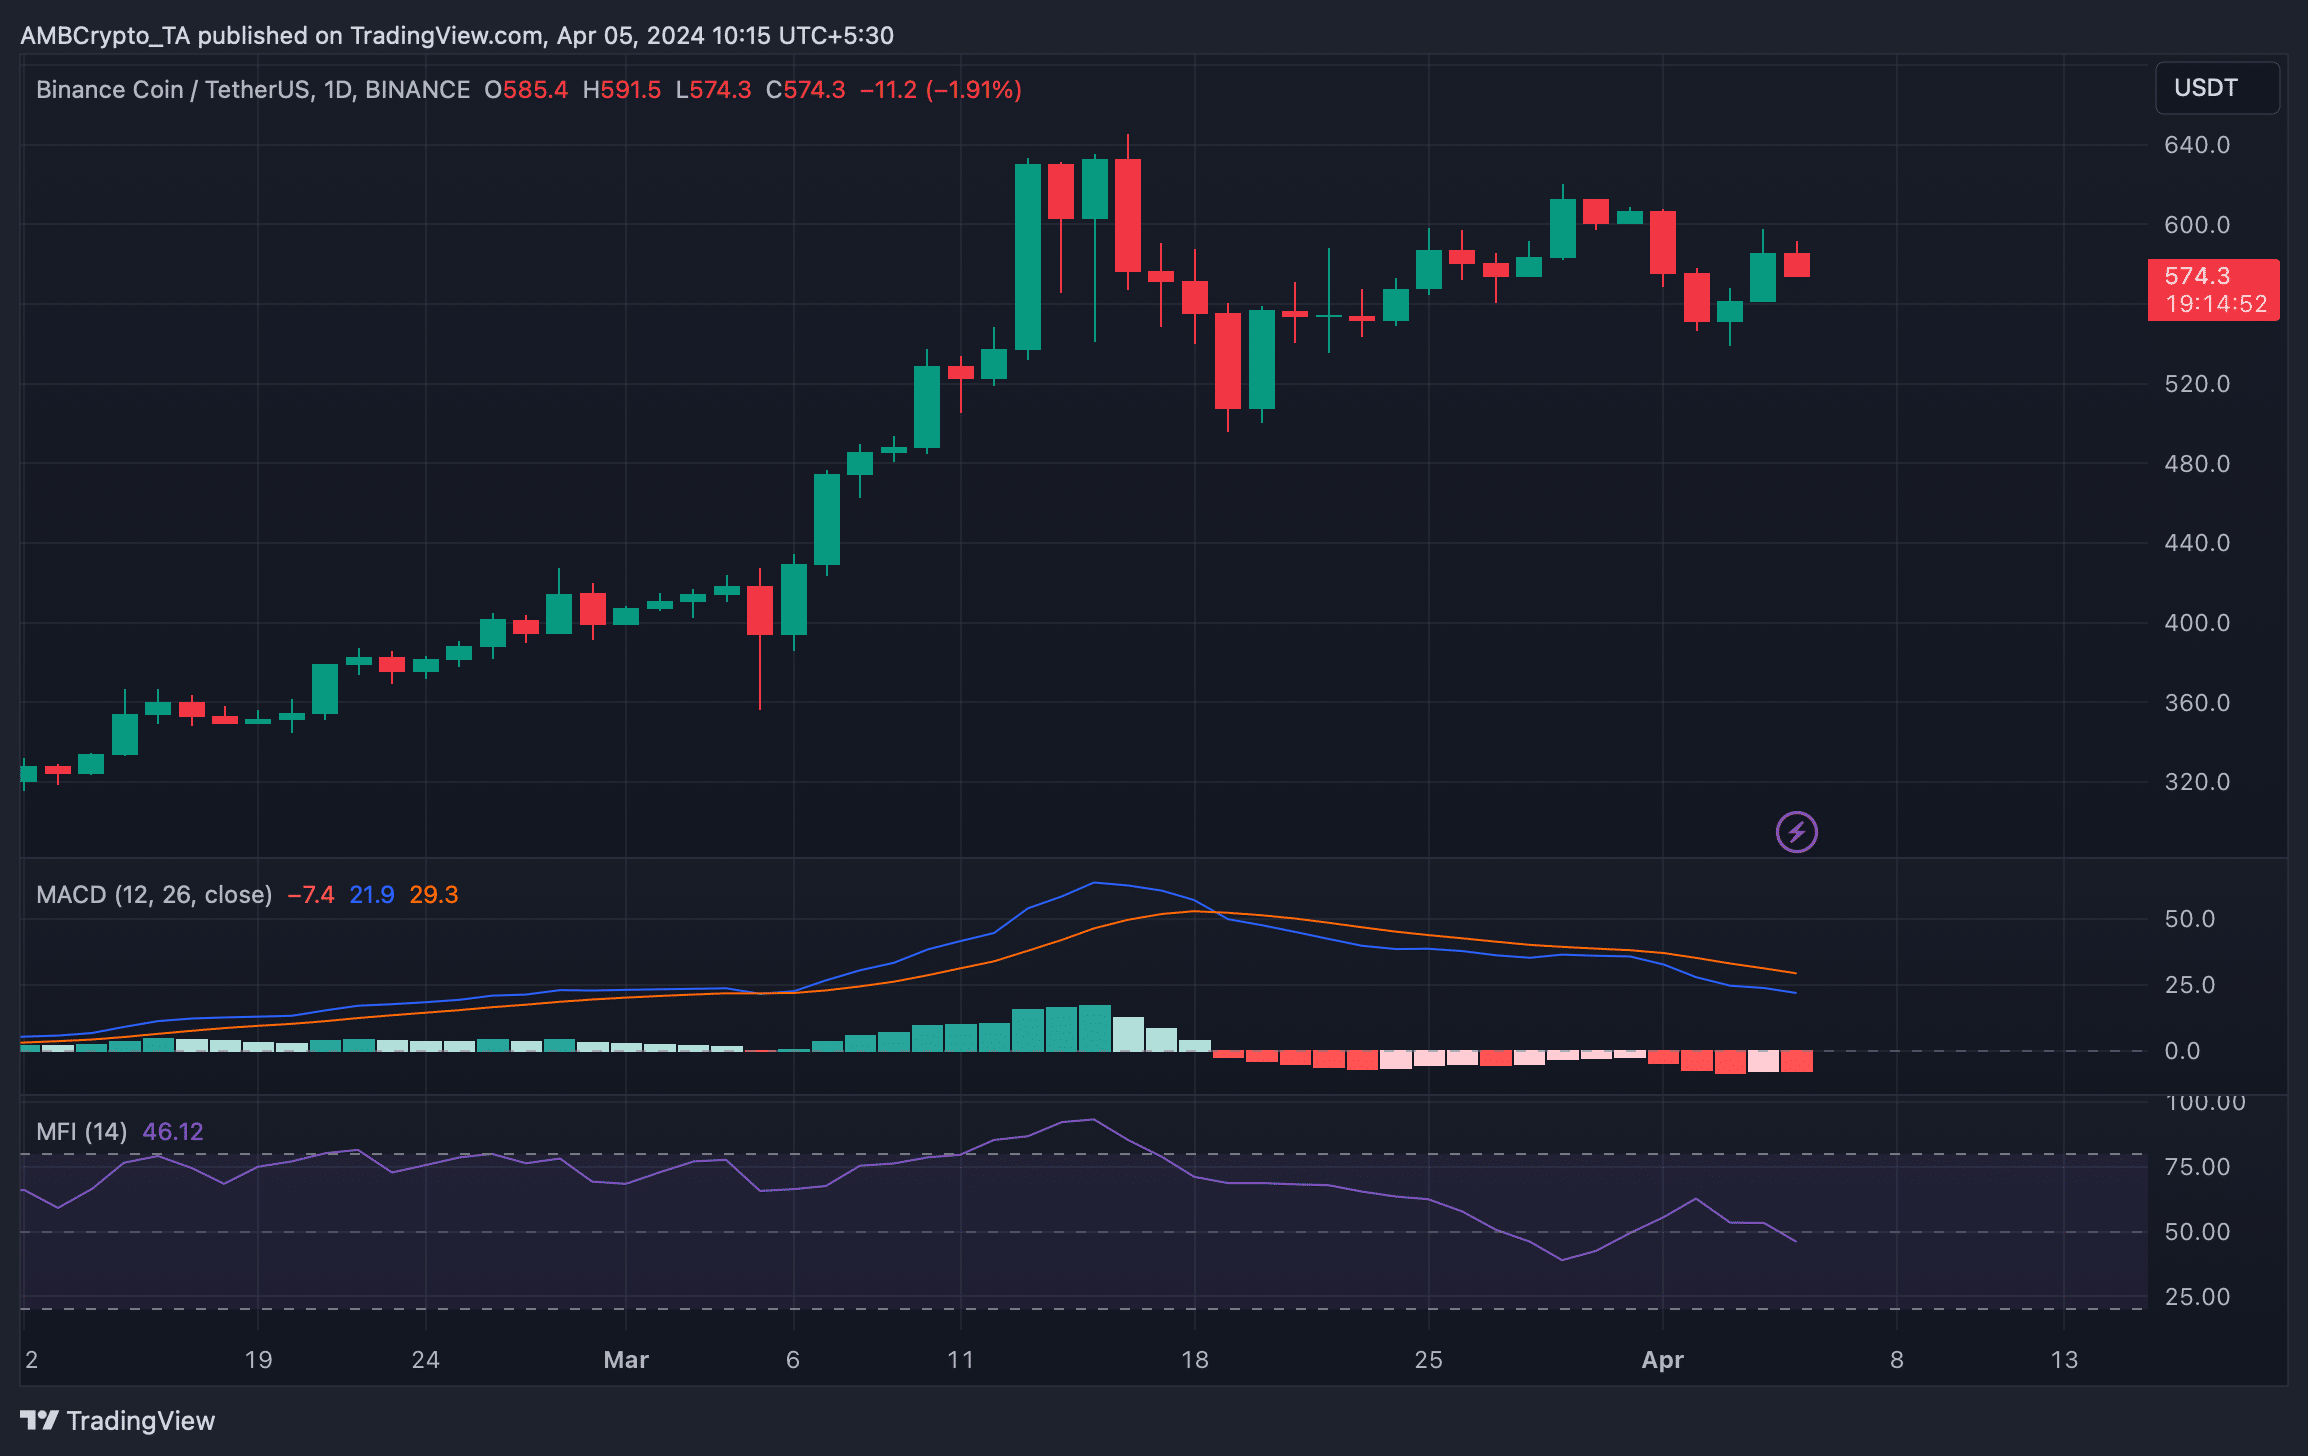
Like captured value, things on the price front also did not look good for BNB in Q2. According to CoinMarketCap, the coin was down by more than 4% in the last seven days. At the time of writing, it was trading at $576.10.
To see what to expect from the coin in the coming days, AMBCrypto analyzed its daily chart. The technical indicator MACD displayed a bearish crossover.
The coin’s Money Flow Index (MFI) also registered a dowtick and was headed further below the neutral mark. These indicators suggested that the chances of BNB’s price sinking further were high.
Read BNB’s Price Prediction 2024-25
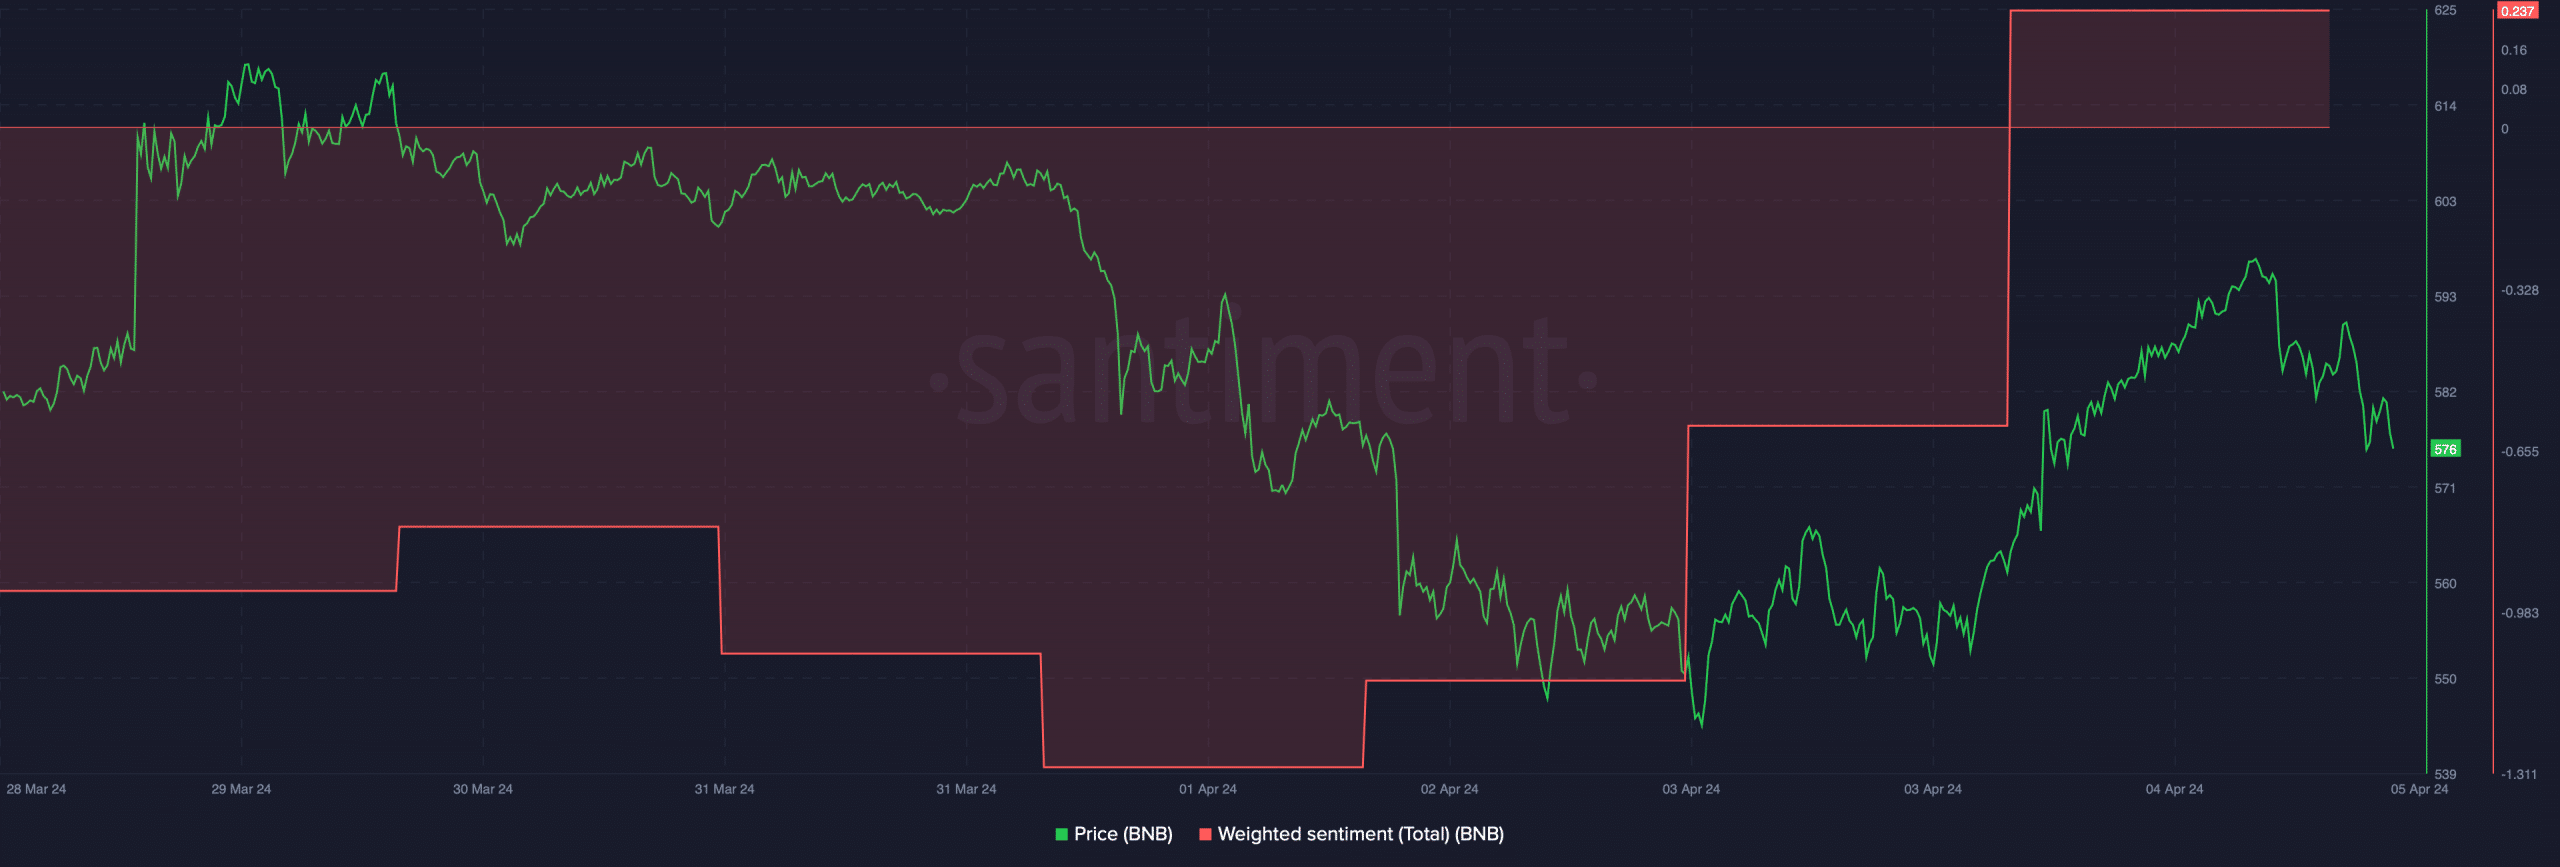
It was interesting to note that despite the bearish price action over the last week, investors’ confidence in the coin has risen in the recent past.
This was evident from BNB’s weighted sentiment, which went into the positive zone on the 4th of April.